BTC Elliott Wave count 1H TFWXY correction for a b wave. Any break of the blue channel (Y wave) may shift the trend to the upside!
Probably will do an ending diagonal c wave from Y wave.
Good luck! and Happy New Year!
Elliottwaveanalyis

EUR/USD long correction potential endingjust by the slope we can see we have a time consuming correction and by overlaps we can suppose we have a lot of diagonals, well this is my count if you have a better one call me

BTC Elliott Wave count 2H TFProbably Bitcoin will go to retest 0.618 fib retracement (16570 zone) and than will go up for a wave C.
My trading plan to catch this C wave is to enter long after we retake 16700 with target 17350 zone.
Good luck!

BTC Elliott Wave count 1H TFBictoin may continue to the upside to end an ABC zigzag correction. 0.5-0.618 fib retracement target where I am looking to sell.

FTM/USDT Elliott Wave count 12H TFFantom into a falling wedge pattern what I think it is a 5th wave ending diagonal, translated into Elliott wave theory.
Probably we ended the wave A from an ABC 5th wave of a 5th wave bigger degree and now we may enter into wave B from this ABC pattern(red count).
A trade plan here is to sell into 0.5 - 0.618 fib retracement (0.235 - 0.226 zone) of the wave A where also we have a strong resistance, the red pointed slope trend line.
Targets for this 5th wave is 0.150 - 0.145 zone where we have previous low from July 2021. We may take into consideration a truncation here as 0.618 fib extension 3rd vs 4th it perfectly aligns with the previous November 22 bottom.
Bigger picture remains bearish on FTM.
Any breakup of the wedge pattern will invalidated the count!!
If you want me to analyze other coins that interest you, please write in the comments, I will gladly do it within the available time.
Good luck!


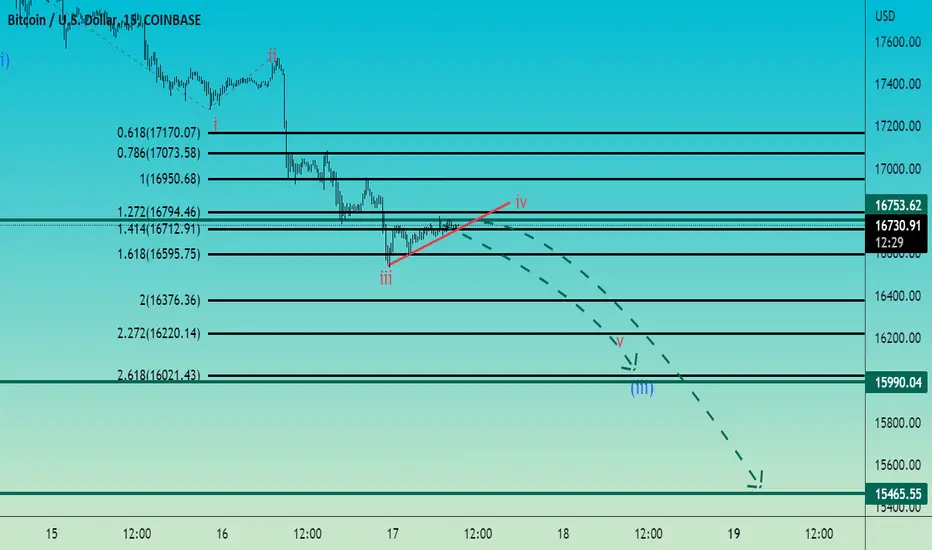
Bitcoin Elliott Wave count 15min TF This is my trade plan for Bitcoin.
Wait to break up the red slope trend line and enter short with 2 targets 16000 and 15500 and Stop lose above 16800.
Watch also related idea!!
Good luck!
I will post updates on this trade soon as we have more price action.
Bitcoin Elliott Wave count 12H TF I am expecting Bitcoin to fall into the zone of June 2019 high (14000) to end this ending diagonal 5th wave.

Gold/XAUUSD Elliott wave analysisGold just finished a 5 wave structure by an Expanding Diagonal.
Downtrend Expected

TSLA, Turn?If you find this information inspiring/helpful, please consider a boost and follow!
Any questions or comments, please leave a comment!
Also, check out the links in my signature to get to know me better!
Cheers!
Not a bad area for a turn here. Hitting some resistance, some Elliott Wave Fibs and some geometry. BUT the bounce up appears to be a 3 wave move and a swift move down, which may suggest it is just a correction and more down is coming. Some kind of truncation could have occurred but would need to see some swift upwards to confirm. Watching this retracement. If it comes up to at least the .50 in a corrective move, that could be an indication the down is come. IF it heads down, there is some nice previous resistance that could be as support.

BTC/USDT Elliott Wave count 4H TFBictoin bullish and bearish scenarios.
Bullish scenario: Bitcoin could go up correctively with an extended flat pattern if the formation in the ellipse is a 12 12. The confirmation of this scenario could be if Bictoin breaks above 17500. Also look at the realted idea for the bullish scenario.
Bearish scenario: Bitcoin could go down if this correction is a triangle for a wave B, which is not yet completed. The proof of this scenario could be if Bictoin forms this triangle and breaks below 16000, which would also invalidate the bullish scenario.
If you like my analysis, give it a like and click subscribe for future counts.
Good luck!

USDCADUSDCAD , Looks like a bullish movement incoming in upcoming days ! With the elliott wave theory , 5th running :)

BTCUSDT H1 analysis with Elliott wavesWell, A wave was completed.
We can have a corrective wave that is a function of A-B-C waves and then goes for an attractive 16500

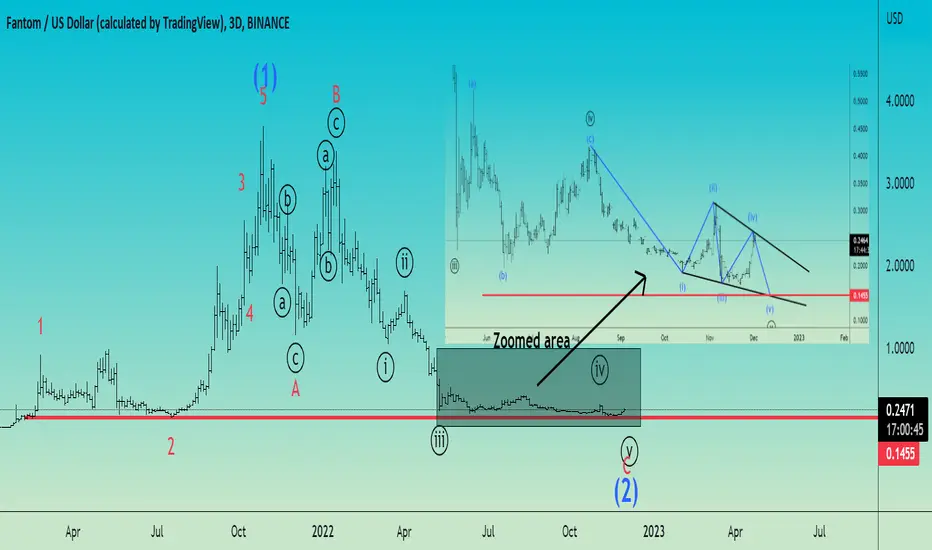
FTM/USDT Elliott Wave count 3D TFFantom may drop soon to end a 5th subwave from a 5th wave of a C wave from an extended flat correction that probably is wave 2.
What I expect next is a downward movement of the price to the 0.1455 zone marked by fib projection 3 vs 4 that you see in the zoomed picture of the last price action moments to complete this 5th wave from an ending diagonal .
I think that soon we will have the end of wave 2 and the Fantom will start the formation of wave 3 from a higher degree.
At this time I expect this wave 3 to start from 0.1455 zone where probably we will have the bottom of the correction.
I will stay short untill this ending diagonal is completed!
I have also a scenario with wave 4th a triangle but I will put it as a comment so as not to clutter the view but the overall things are bearish .
If you like my analysis please hit the like button and subscribe for future elliott wave counts!
Good luck!
The USD Outlook- Elliott WavePCE was out, seems like Inflation is stable. Powell noted they will slow down the hike, so even if data is strong they will probably stick to the plan. If data is bad, which is not impossible, considering that economy is slowing down, then the DXY will fall further. So I see win-win for the bears on DXY going forward.
But there will be pullbacks of course. Here is another count I am looking at; potential impulse from a monthly channel top.
I will turn back bullish if I see strong bounce from 103.80 and back to 109.

SOL/USDT Elliott Wave Count 2H TFSolana may continue to the downside after ended a runing flat correction!
Wave B hits 1.236 fib extension of wave A and wave C hits 0.618 fib projection wave A vs wave B.
Clear invalidation if price goes above wave C (15 usd).
Good luck!

BNB Elliott Wave count Daily TF No clear direction for BNB as we may have an X wave for a move to the upside or an ABC correction to retest the bottom of the 183 - 336 range.

BTC/USDT Elliott Wave Daily TF countBitcoin may be into an ending diagonal.
It may go up to retest previous broken support and this move fits perfect for a 4th wave (0.382-0.5 fib retracement of the 3rd wave).
I am waiting to catch it in this zone for some short trades.
Good luck!

LTC Elliott Wave count 1W TFI dont think Litecoin ended his correction from the macro view and will turn to the downside soon!
The corrective pattern that I am watching for Litecoin is a wave 2 flat starting from december 2017.
Recently move to the upside may be a 4th wave from an impulse C wave that forms flat pattern.
Also this 4th wave may go to 102 before turns down to end this flat C wave.

Financial Wave. BTC m15Our preferable scenario in BTC remains the same: a rise towards the first target of $19,500. A fall in the price of BTC below $15,500 will change our view, as well as a prolonged flat may be one of the factors for revising the markup.

Cardano short target 0.2636Hey trader!
This technical analysis discusses how the price of Cardano could potentially decline to a lower price target. In the analysis an Elliott Wave is made as the resistance levels become lower. The start of the first wave starts at the resistance level at 0.5947 . After the first wave, the waves get progressively lower indicating a bearish trend. At the end of the Elliott formation , the strong support level at 0.3233 appears, where the price is close to break and enter a fall below the strong support . This fall, according to an applied fibonacci line , could indicate that the price should fall all the way down to the target at 0.2636.
The analysis uses the following background indicators to inspire the execution: Day Buy Sell Volume Label, VSAR Visual Signal ActivatoR, & RSI background.

BTC Elliott Wave count 12H TFBitcoin could be in a corrective wave of the extended flat type and the first indication would be the fact that the price had a bounce in the 1.236 Fibonacci extension of the red wave A and we could assume that this is where the red wave B of this flat ended and would follow impulsive type C wave.
I am still not convinced by this count, but if we have a break of the resistance in the 17578-18128 area, then Bicoin could continue towards 23000 or even 27000.
Also, breaking the 17578-18128 area could confirm the scenario of a double bottom pattern.
For now my advice is to wait to see more price action and I will come back when I have more confirmation.
You can also see my previous analysis(related idea) in which I suggested the possibility of a massive drop in the price of Bitcoin. Success!

USDMXN is breaking the supportsUSDMXN remains bearish and it’s now in a sharp intraday decline aboutwe have been warning about in the past. We see pair now breaking the trendline support and its falling below the important 19.70 level. This may cause more more weakness as a higher degree bearish triangle can come to an end. In fact, MXN has been one of the strongest even when USD was up vs GBP, AUD and NOK. So if these are ready to gain, or at least make a pullback, then we think that USDMXN can easily come much lower. Check where USDMXN is despite DXY bull run in the last 12 months.
A bearish HS pattern also signals for more weakness on USDMXN.
Grega
