TOTAL3 - ALT SEASON - Bull Swing CRYPTOCAP:TOTAL3 is ready for the Alt Season.
#Altcoins will be rockin' the boat in '25.
CRYPTOCAP:BTC.D is running out of steam, thus opening the door for #AltSeason to start.
The correction on MARKETSCOM:BITCOIN Dominance is the key to #Alts to shine.
1.13T MC has been touched, previous #ATH.
Now CRYPTOCAP:TOTAL3 is in a Wave 4 (#ElliottWave Triangle), with Wave 5 of the Larger Degree C Wave about to shoot.
Targets between the #Fibonacci Extensions 200-261.8%.
That's the 1.5T to 1.8T range.
Elliottwaveanalyis

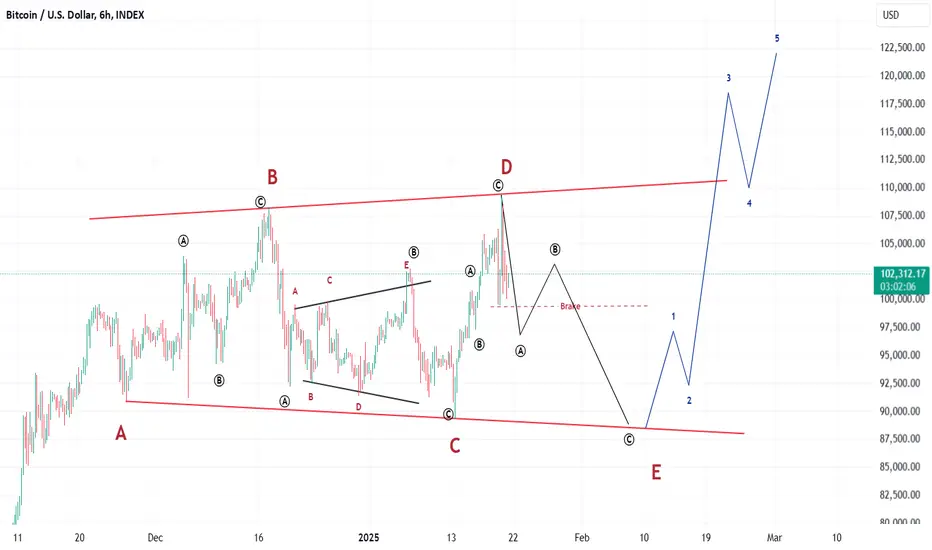
BTCUSD Reverse Triangle BTC peaked on November 23 and then entered a sideways corrective formation.
The corrective formation is called a reverse triangle, and it is characterized by the following features:
Three consecutive lower bottoms (A-B-C)
Two consecutive higher tops (B-D)
With the potential completion of the E bottom of the triangle, we can take a buy position on a lower timeframe if we identify a reversal pattern at the bottoms.
The initial target is a new all-time high.

Bank Of IndiaSharing my view on Bank of india based on elliott wave theory, where price seems to complete correction phase, but here is the tricky part if price breaks, price will move up.but, if it breaks 137 price level then and then only we can consider the start of wave 5, untill then it will correction uptrend and price can remain sideways.

Predicting Bitcoin's Cycle Using the Elliott Wave Theory, Part 3Hello Traders. With the new year upon us, I think sufficient time has passed for the charts to develop from our previous #Bitcoin analysis. Having accurately forecasted the macro trends for each pivot within a reasonable margin of error, I believe we're approaching another pivotal moment this year, aligning with our previous predictions. Please take this post with a grain of salt, and more importantly, please use it to add confluence to your personal theories.
In this post, we will be diving deeper into the Elliott Wave Theory by also integrating the Wyckoff Market Cycle Theory.
By combining the two theories, the chart below represents our current position within the final leg for what could be giving us signs of a possible reversal (again, within margin of error depending on how far wave 5 extends):
Wyckoff believed that markets move in cycles, which arguably has a direct correlation to the Elliott Wave 5-wave/3-wave cycle. Wyckoff introduced a four-stage market cycle , attributing it to the actions of institutional players who strategically influence price movements to capitalize on the behavior of uninformed traders. Simply put, the theory gives us a further understanding of 'cause and effect' within the markets.
In my view, the Wyckoff cycle also does a fantastic job of representing market psychology. And if intertwined correctly with the Elliott Wave Theory, price action tends to follow patterns in similar ways. The Elliott Wave Theory and Wyckoff Theory often overlap in their application and interpretation of market behavior, but they approach the market from different perspectives. Both theories aim to understand and predict market movements based on the behavior of market participants and price cycles, making them complementary in many ways.
Commonalities Between the Elliott Wave Theory and Wyckoff Theory:
Market Cycles
- Wyckoff Theory identifies a four-stage market cycle: Accumulation, Markup, Distribution, and Markdown. The Elliott Wave Theory also emphasizes cyclic behavior through a fractal structure of impulsive and corrective waves within broader market cycles.
- Both theories suggest that price movements are not random but follow identifiable patterns driven by market psychology.
Psychological Basis
- Wyckoff focuses on the interaction between "big players" (institutional traders) and "uninformed traders," highlighting group psychology and how institutional actions exploit public sentiment.
- Elliott Wave focuses on the crowd psychology behind price movements, suggesting that mass investor sentiment drives waves in predictable patterns.
**Both theories reflect the influence of human behavior and emotions on market prices.**
Application Across Timeframes
- Both theories are applicable across multiple timeframes, from intraday trading to long-term investments. This flexibility allows traders to use them in conjunction for deeper market analysis.
Identification of Trends and Reversals
- In Wyckoff Theory, phases like Markup and Markdown align with Elliott Wave's impulsive trends, while Accumulation and Distribution phases can correspond to corrective wave patterns.
- Both approaches aim to identify key turning points in the market, helping traders anticipate trends and reversals.
-----
The Four Stages of the Market Cycle According to Wyckoff
Accumulation Phase
This is a sideways range where institutional traders accumulate positions quietly to avoid driving prices higher. During this phase, the asset remains out of the public spotlight, and uninformed traders are largely unaware of the activity. On a price chart, the phase appears as a range-bound movement between areas of support and resistance.
Markup Phase
Following the accumulation phase, the market enters a classic uptrend. As prices rise, uninformed traders begin to notice and join in, further fueling the rally. Institutional players may take partial profits or continue holding for greater gains. Short sellers caught off guard are forced to cover their positions, adding additional buying pressure and driving prices to new highs.
Distribution Phase
After the uptrend loses momentum, the market transitions into a sideways range, marking the distribution phase. Institutional players use this period to offload their holdings, while uninformed traders, still expecting higher prices, continue to buy. Some institutional traders may also initiate short positions during this phase to benefit from the subsequent price decline. On the price chart, this phase appears as a reversal of the uptrend into a sideways range.
Markdown Phase
The markdown phase is characterized by a downtrend following the distribution phase. Institutional traders add to their short positions, while uninformed traders, recognizing the decline too late, sell in panic, creating further downward pressure. The market eventually reaches new lows as selling accelerates.
The Model of Group Psychology
After the markdown phase, the cycle often repeats, moving from accumulation to markup, distribution, and markdown again. The Wyckoff cycle offers a simplified perspective on market behavior, focusing on the psychological dynamics between two groups: institutional traders (the "big players") and uninformed traders (the "small players"). It highlights how the mistakes and emotional reactions of uninformed traders often benefit institutional players.
The Wyckoff cycle provides valuable insights into market behavior but is not without limitations:
Limitations of the Wyckoff Trading Cycle
Difficulty in Identifying Phases
Distinguishing between accumulation and distribution phases can be challenging. What appears to be an accumulation phase might turn into a distribution phase, with the market unexpectedly breaking lower.
Timing Challenges
Entering trades during accumulation or distribution phases is difficult due to the lack of clear stop-loss levels. Placing stops around support and resistance often leads to being trapped.
Complexity in Trading Trends
Trading the markup and markdown phases requires skill, as they are filled with complex price action patterns. Modern markets often experience frequent trend reversals, complicating trade execution.
Irregular Cycles
The market does not always follow the textbook sequence of accumulation, markup, distribution, and markdown. Variations such as accumulation followed by markdown or other combinations are possible.
Despite its limitations, the Wyckoff cycle remains a useful framework for understanding market behavior. It is best combined with other strategies, such as price action and market dynamics, to enhance its practical applicability. While modern markets may reduce the cycle's predictive reliability, it still serves as a powerful tool for traders who know how to apply it effectively.
Proper Application of the Elliott Wave Theory and Wyckoff Overlap (in Practice):
Trend Identification:
The Markup Phase in Wyckoff often aligns with Elliott's Impulse Waves (1, 3, and 5), while the Markdown Phase aligns with corrective waves or bearish impulses.
Sideways Markets:
Wyckoff’s Accumulation and Distribution phases correspond to Elliott’s Corrective Waves (A-B-C) or sideways consolidations (Flats and Triangles).
Volume Confirmation:
Traders can use Wyckoff’s volume analysis to validate Elliott Wave patterns, especially in identifying wave 3's (typically accompanied by high volume) and wave 5's (often showing declining volume).
Timing and Execution:
Wyckoff’s emphasis on identifying support/resistance levels and trading ranges can help refine the entry and exit points suggested by the Elliott Wave Theory.
Combining the Two:
Many traders find value in combining these theories:
- Use Wyckoff to identify key price levels and market phases (e.g., when accumulation or distribution is occurring).
- Use Elliott Wave to determine the broader trend structure and anticipate the next moves within those levels.
- By integrating Wyckoff’s volume-driven approach with Elliott’s fractal patterns, traders can gain a comprehensive view of the market and improve their ability to time trades effectively.
----
By integrating the concepts from both theories and the outlined schematics, we can now take a closer look at how Bitcoin is behaving through the lens of these frameworks.
As observed, Bitcoin appears to be nearing the completion of the potential 5th wave we've been discussing over the past year. In my view, a bear market (or at least a significant correction) may be approaching. While timing is uncertain due to the unlikely nature of extensions, we can use insights from both Wyckoff and Elliott Wave theories to gauge our current position. I believe we are likely in the Distribution phase, which aligns with the 5th wave.
The 5th wave can extend as much as it wants, but it won't change the overall conclusion of the cycle. We still anticipate the cyclical behavior that Bitcoin has shown in the past. While past price action isn't necessarily a predictor of future movements, it often follows a similar pattern.

DXY ELLIOTT WAVE ANALYSIS: 07 JAN, 2024 - BEARISH©Master of Elliott Wave: Hua (Shane) Cuong, CEWA-Master.
Wave B-grey has just completed a corrective wave labeled ((a))((b))((c))-navy and wave ((c))-navy has completed a full five-waves in a Zigzag (5-3-5) pattern, so wave C-grey could be back to push lower. But it is too early to conclude such a major bearish trend.
On the other hand, the shorter-term outlook suggests we may head down to the 105.420 area, while price must remain below 109.533 to maintain this view.

Starbucks Corporation: Elliott Wave Correction Unfolding [SHORT]NASDAQ:SBUX
Overview:
Starbucks is in the midst of an Elliott Wave corrective structure, likely entering the C-wave of an ABC correction. The bearish momentum suggests that the correction isn't complete, presenting an opportunity to short as the structure completes.
Elliott Wave Analysis:
Wave A: The initial impulsive wave down broke key support levels, signaling the start of a correction. This wave exhibited strong bearish momentum.
Wave B: The corrective upward retracement faced resistance near $93.12, forming a potential lower high and respecting the descending channel. With failure to break out above $94, this wave has likely concluded, paving the way for the final corrective wave.
Wave C: Currently forming, this wave is expected to extend toward lower Fibonacci retracement levels, targeting $88.71, $84.29, and $79.88. The typical symmetry in Elliott Wave corrections suggests that Wave C may equal or exceed the length of Wave A.
Key Trading Levels:
Entry: $93.12 (near the end of Wave B).
Stop Loss: $94.00 (just above Wave B resistance).
Target 1: $88.71 (38.2% Fibonacci extension of Wave A).
Target 2: $84.29 (61.8% extension and channel support).
Target 3: $79.88 (full measured move of Wave C and strong support).
Trading Strategy:
Short Entry: Look for confirmation of rejection near $93.12. This aligns with the conclusion of Wave B and the start of Wave C.
Risk Management: Place a tight stop-loss at $94, above the resistance line formed by Wave B.
Profit-Taking: Scale out of positions as price approaches each Fibonacci target and key support zones.
Additional Notes:
The Elliott Wave correction is part of a broader descending wedge structure. A decisive breakdown could trigger a stronger bearish continuation.
Confluence of technical factors (Fibonacci levels, trendline resistance, and Elliott Wave symmetry) supports the bearish scenario.
Monitor volume and RSI for divergences to confirm the wave progression.
Disclaimer:
This analysis is for informational and educational purposes only and should not be considered as financial advice. Trading and investing involve significant risks, and you should consult with a qualified financial advisor or conduct your own research before making any investment decisions. The author is not responsible for any financial losses or decisions made based on this analysis. Always trade responsibly and within your own risk tolerance.

VIRTUAL’s Incredible Year: Is a Top in Sight??VIRTUAL has experienced a phenomenal rise in recent months, climbing to rank 36 in the overall crypto market with an impressive $3.7 billion market cap. This meteoric growth is a testament to the strong interest and momentum behind the project. However, as we approach the end of the year, there are signs that a potential top could be forming. Let’s analyse the chart and key scenarios to watch for in the coming weeks.
Key Levels and Observations:
1.) Elliott Wave Analysis:
The price action suggests we are completing the 5th wave of an Elliott Wave cycle, signaling a potential exhaustion of the current uptrend.
Based on the Fibonacci extension of the last corrective wave, the 1.618 level is a critical resistance at $3.8134.
A breakout above $3.8134 could open the doors to test the psychological level of $4. However, failure to break this level might confirm the end of the 5th wave and initiate a correction.
2.) Head and Shoulders Formation (Potential Setup):
There are early signs of a Left Shoulder formation on the chart. If the price rejects at the 1.618 Fibonacci level, we could see the development of a Head and Right Shoulder, forming a bearish reversal pattern.
Confirmation of this pattern would require a clear neckline and increased selling volume, signaling a trend reversal.
3.) Time-Based Correction:
A correction could align with the broader crypto market trends as we head into early 2025. Given the potential for Bitcoin to drop to the 84K support zone, this could trigger a sell-off in altcoins, including VIRTUAL.
4.) Overall Market Sentiment:
While the broader market has been bullish, a Bitcoin-led correction could drag down the entire crypto market.
Altcoins often experience sharper corrections during Bitcoin downturns, which could result in VIRTUAL retracing some of its gains.
Volume Analysis: Monitor volume levels at key resistance points (e.g., $3.8134 and $4) for confirmation of breakout or rejection.
Market Correlation: Keep an eye on Bitcoin’s price action, as any significant movement could directly impact VIRTUAL and other altcoins.
Note: These are my personal thoughts and interpretations of the current market conditions. Please take them with a grain of salt. The crypto market is highly volatile and further data and confirmations are essential before drawing definitive conclusions. Happy trading!

US10Y ELLIOTT WAVE ANALYSIS: 19 DEC, 2024©Master of Elliott Wave: Hua (Shane) Cuong, CEWA-M.
The entire ((2))-navy most recent completed as an (A)(B)(C)-orange Zigzag, and the ((3))-navy is now retracing to push higher.
It is subdividing into a (1)(2)-orange, and they have completed, since the high of 4.126%, the (3)-orange is unfolding to push lower, targeting the high of 5.163%

chilizchiliz technical analysis basically on ellott waes Principle and priceaction strategy
chiliz can be grow up to 0.5$
wait and watch...

ASX:FMG ELLIOTT WAVE ANALYSIS: 1 DEC, 2024©Master of Elliott Wave: Hua (Shane) Cuong, CEWA-M (Master's Desgination).
So the wave ((iii))-navy could be unfolding to push higher, targeting the high around 23.84, a break of which would take us to 28.80.
While price must remain above 17.54 to maintain this view.

GOLD ELLIOTT WAVE ANALYSIS: 27 NOV, 2024 - BULLISH©Master of Elliott Wave: Hua (Shane) Cuong, CEWA-M.
The wave ((b))-navy itself is a Zigzag, labeled wave (a)-orange, and the most recent wave (b)-orange is probably also finished, now we could be moving up with wave (c)-orange. While price must remain above 2,605.085 to maintain this view.
Alternative scenario (ALT, less likely): Shows that wave (b)-orange is not finished yet, but has a leg to push lower.
Key point: 2,605.085

GOLD ELLIOTT WAVE ANALYSIS: 24 NOV, 2024 ©Master of Elliott Wave: Hua (Shane) Cuong, CEWA-M.
Wave count changed to maximize probability. Wave 3-grey has ended, and wave 4-grey is still unfolding, there is little data to suggest it has ended, I think it may still be developing. More specifically wave 4-grey is developing as a Flat, its wave ((a))-navy has completed, and its wave ((b))-navy is pushing higher, it could reach 2.765 (Wave ((b)) retraces 90% of wave ((a))-navy), or higher, then a push lower with wave ((c))-navy will unfold.
Alternative wave count: Wave 4-grey has ended, and wave 5-grey will unfold. We also have a pullback with wave ((ii))-navy after that.

ASX:WES - ELLIOTT WAVE ANALYSIS: 22 NOV, 2024 - BULLISH©Master of Elliott Wave: Hua (Shane) Cuong, CEWA-M.
1D Details: Wave 4-grey ended at the low of 66.27 and wave 5-grey is unfolding to push much higher, targeting around 77.17 - 80.00.
Invalidation point: 69.14

SMHI - Can an ugly chart actually be a good play?This is one of those charts I had on a watchlist titled "Waiting For Bottom". I checked in on Friday and it was touching the bottom of the channel. Boom!
Is this post a prediction? Nope. Do I think this Elliott Wave count is for sure accurate? Nope. So what is this?
First of all, remove all of the markings and look at the chart with nothing but price action. What do you see? If your answer is a "a complete mess that was generally melting up until the middle of 2024", you'd be correct. This is not a trending stock with a high probability setup. There is no clear 5-waves up pattern playing out. In fact, there is no clear anything pattern playing out. But that's exactly why I think this "might" be a diagonal and might be an interesting play for a solid risk/reward.
What is a diagonal you ask? Let's make sure you understand.
In Elliott Wave, there are only TWO types of bullish patterns. The first is the classic 5-wave impulse where the underlying trends up in odd numbered waves and correcting each one in the even numbered waves. Think of a lightning bolt.
1 - Up off a low.
2 - Corrects 1, can't move below it.
3 - The breakout, usually the most impulsive and powerful wave.
4 - Corrects 3, can't break below the top of 1.
5 - The final move up, can be powerful, can be weak, but will almost always give a higher high.
5-wave impulsive moves start when the underlying is very bearish. Wave 1 starts by getting back to or breaking a key resistance area. Those who jump in during it are considered early adopters. The only support is the previous low. The vast majority of market participants are avoiding. Once it tops and rolls over, the majority are convinced new lows are coming. Some early adopters sell out or take profit. But a successful Wave 2 holds above the previous low, giving a higher low setup. It is followed by a consolidation as momentum builds up in the beginning of the 3rd wave. Once Wave 3 breaks out above Wave 1, smart technical traders start jumping in. Maybe it happens on an earnings report and some fundies jump in. It starts to really trend as more heads start to turn and realize that not only did it hold a higher low, buts its also working on a higher high. And if it is powerful enough, it will break more resistance and more and more participants will jump in. Eventually though, Wave 3 tops. Many early adopters take their profit and leave. It consolidates into a Wave 4, holding another higher low above the Wave 1 top. But as it starts Wave 5, the majority of the participants are now the late adopters and retail traders, with a spattering of early adopters who still have a small tranche left, already being in the green on smart sales at the top of Wave 3. Wave 5 then completes, often trapping late adopters who were sure it was going to the moon.
Well this stock doesn't seem to be that. This thing overlaps all over the place. It could be an upward corrective wave of some sort before a drop to new lows. But as of now, it's playing along nicely with what its called a diagonal.
A diagonal is a 5-wave structure. But this one is different. With diagonals, Wave 3 "can" overlap below the top of Wave 1. And one of the leading clues you might be in a diagonal is when the subwaves break down into segments of 3 wave moves instead of 5 wave moves. Why does this exist? Well, it starts off similar to a standard 5-wave move. A low is formed and a move is commenced off of it. But the succeeding retracement of that move is VERY deep, retracing almost all of the first move up. The next higher high is then around 100-161.8% of the first move, with the retracement that follows also very deep. All of this is likely happening within Wave (1) and Wave (2) of the diagonal. See, market participants are so polarized with the underlying, that they are whipping it back and forth, neither side able to ultimately win very long, yet the bulls slightly nudging out the bears with marginal higher highs and higher lows. It continues this whipsaw with every move, slowly melting upward. Instead of the whole 5-wave pattern targeting the 176.4%-200% extension of Wave 1 from the bottom of Wave 2 (what happens in a standard 5-wave impulse), it targets lower extension levels, typically the 161.8% level.
Diagonals are either LEADING or ENDING moves. They CAN NOT be 3rd waves in larger patterns. So you will either get one as a first wave of a larger move, or you will get one to finish a larger move. In this case, it would be a leading diagonal of something much larger.
So back to this specific stock. Thanks for enduring the educational section. Let's talk why I think this is a diagonal.
You can see the wave labels clearly outlining the 3-wave moves within the larger 5-wave diagonal. They are labeled ABC within the (1)(2)(3)(4)(5). At present, this is within $1 of the ideal retracement level of the (3)rd wave for Wave (4). And it's clearly the 3rd segment of the ABC we would expect for a corrective (4)th wave. Not only that, it's holding the channel (but that's not required, just an area of support). Diagonals do often retrace deep, so I wouldn't be surprised to see it continue to the 76.4% correction area around $4.50. If you are risk averse, you could enter in the current area with stop just under $4.49. But as long as it holds the Wave (2) low, the diagonal stays valid. Ideally, it would be either contracting (trendline connecting (1), (3), and (5) contracting toward trendline connecting (2) and (4)) or expanding (same thing, but trendlines diverging away from each other), with expanding diagonals being pretty rare, but possible. They can tend to run in channels as well. So ideally, this doesn't get much lower as that would turn it into an expanding diagonal, which we know is rare, and leads to future bullish action being even MORE unreliable.
Standard supply and demand zones are on the chart representing major support and resistance areas. If this holds support, it likely finds renewed strength up toward resistance and will bounce around in mostly unpredictable, overlapping structures that generally melt up. But once it engages the next C Wave, you should be able to track a standard 5-wave pattern within that C, as C-waves are always 5-wave structures.
As I stated at the beginning, in no way is this a reliable structure. But you see things like this fairly often, and anywhere from second to monthly charts. The longer the duration, the more confusing, as you can have years of price movement that seem to make no sense. Ultimately, you have to watch supports and play smart. Is this something you want to align a lot of your money in? Probably not. It's unpredictable at best. And it could fail at any moment at worst since diagonals are "technically" corrective structures even when bullish. But is a chart like this giving up a setup for potentially phenomenal risk/reward? You bet. Just make sure and manage your risk. And you do that with your position sizing, using an appropriate stop *and if you get stopped, stay stopped. You set it for a reason, don't second guess), and understanding your targets, making sure to de-risk as quick as possible by selling enough at key levels to get your original equity back should it move upward.
Feel free to ask questions. This was meant to be educational and shed some light on a complicated chart structure while providing a thesis for how to potentially play it.
Standard disclosures:
1. This is 100% my idea. It was not sourced from any other avenue.
2. I am not invested in this company, though I am likely buying shares soon.
3. I am not paid to post content nor do I receive any contributions of any kind.
4. While this is outlining a potential profitable setup, this article is not investment advice. You should do your own due diligence on any company you invest in and apply your own trading strategies.
5. I know nothing about the fundamentals of this company. I suggest doing your due diligence if fundamentals are important to you.
6. Readers should always remember that markets are their own creature made up of millions of individuals and institutions each following some combo of inherent bullishness, inherent bearishness, fundamentals, technicals, stupidity, and pure emotion. Elliott Wave, and specifically Fibonacci Pinball (developed by Avi Gilburt at elliottwavetrader.net and prominent Seeking Alpha author), merely provide a framework based on the observed price action to date.
7. I know that while my wave outline is based on years and years of data and application from not only me, but some of the best in the game, I also know that markets do not follow a set path and that sentiment can remain irrational far longer than I can remain rational. That is why you MUST consider the alternatives and manage risk appropriately. Know the pivot zones that could lead to the primary path failing.
I warrant that the information created and published by me on TradingView is not prohibited, doesn't constitute investment advice, and isn't created solely for qualified investors. My analysis is not a recommendation for a specific trade. My analysis outlines a potential scenario and provides risk assessments for multiple alternate scenarios. My analysis is purely educational.

MATH - This is how you REALLY use Elliott WaveThis is a great example of a beautiful setup and how to lay out a low risk, high reward trade, especially for those that are still learning and wondering how to apply Elliott Wave. Or maybe you are unfamiliar with Elliott Wave or someone who thinks it's nonsense. Well let me show you how I do it and hopefully help you learn the best technical strategy. These are the setups I salivate on. And I don't care if I lose 8 out of 10, because the 2 that hit will more than pay off the losers.
Support box is clear. Below the September low and I'd be out as we'd be below the reliable 61.8% retracement. Breaking that fib retracement level means that it can do anything from bullish, to diagonal, to sideways, to bearish moves. And we don't want to waste our time with stocks that aren't trending. Nothing is reliable anymore - therefore, we don't want to trade it below that. Toss it away. Move on to the next one.
For this play, you could accumulate shares under $2.25 which is the previous high. I have it labeled as a Wave (1) but it could easily just be an (A) wave. As a quick refresher, trending impulsive moves happen in 5-wave moves. Since we don't know for 100% certainty that this will become that, we have to prepare for the other likely scenarios. We are already protected from significant downside with our stop below the 61.8% retracement, so I just don't care what might happen in a bearish count. So for bullish, I want to accumulate under the last high and catch the breakout. Once broken out, minimum target is $4.25. That's the 100% extension of (1) from the bottom of (2), the first resistance. If this ends up being a 3-wave (A)(B)(C), it would top out there at the 100%, so we want to make sure we have all of our money back by then. A full bullish follow through could take it anywhere between $12 (161.8% fib) and $22.50 (200% fib, which is where a standard impulsive 5-wave rally is expected to end with no extensions).
If you buy a stock like this with stop below the 61.8%, you can go net free (return of original equity) by selling however many shares are needed to get your original money back at the previous high around $2.25 which should reject at first try (as it is the most likely landing spot for Wave 1 inside of Wave (3). Once a higher low forms from there (Wave 2 of (3)) between $1.20 and $1.75, you could go in even harder, buying more shares, and moving your stop on all shares to that higher low, providing a very low risk scenario. By the time $4.25 is hit, you should be completely net free with plenty of shares left and maybe even take some good profits.
Remember, this is an outline NOT A PREDICTION. That's why we have a stop, a plan, and multiple targets. As it plays out, we gain more clarity and update our outline. Probably even find a trend channel. This is Elliott Wave. This is Fibonacci Pinball (the creation of Avi Gilburt at elliottwavetrader,net). It's not telling you what's going to happen. It's telling you what could happen, laying out the most probable path, limiting your risk, and telling you when it might be wrong and how to pivot. And don't go thinking this will happen all at once. Keep good notes of your entry and all sales. This likely takes 1-3 years.
Standard disclosures:
1. This is 100% my idea. It was not sourced from any other avenue.
2. I am not invested in this company, though I am likely buying shares soon.
3. I am not paid to post content nor do I receive any contributions of any kind.
4. While this is outlining a potential profitable setup, this article is not investment advice. You should do your own due diligence on any company you invest in and apply your own trading strategies.
5. I know nothing about the fundamentals of this company. I suggest doing your due diligence if fundamentals are important to you.
6. Readers should always remember that markets are their own creature made up of millions of individuals and institutions each following some combo of inherent bullishness, inherent bearishness, fundamentals, technicals, stupidity, and pure emotion. Elliott Wave, and specifically Fibonacci Pinball (developed by Avi Gilburt at elliottwavetrader.net and prominent Seeking Alpha author), merely provide a framework based on the observed price action to date. 7. I know that while my wave outline is based on years and years of data and application from not only me, but some of the best in the game, I also know that markets do not follow a set path and that sentiment can remain irrational far longer than I can remain rational. That is why you MUST consider the alternatives and manage risk appropriately. Know the pivot zones that could lead to the primary path failing.
I warrant that the information created and published by me on TradingView is not prohibited, doesn't constitute investment advice, and isn't created solely for qualified investors. My analysis is not a recommendation for a specific trade. My analysis outlines a potential scenario and provides risk assessments for multiple alternate scenarios. My analysis is purely educational.

XAUUSD PERSPECTIVEIt's been awhile.
Kindly remember, Elliott Wave is highly subjective, i will post if there's a new update on my perspective. Trade safe, Everyone! Cheers.

bitcoinbitcoin technical analysis basically on elliott waves Principles
bitcoin made a leading diagonal as a wave 1 and it can down to current level and make a new wave as wave 3
wait and watch

KNCUST Elliott wave countKyber network may have been bottomed @ 0.3561 after wave (v) of ((c)) finished as an ending diagonal.
Above 0.41 and clearing 0.53 we are looking for 5 waves to clear previous wave (iv) of wave ((c)).
For up trend Wave (i) an expending leading diagonal and wave (ii) bounced into 0.618 fib retracement.

I maintain my biases towards the black countAs I have discussed many times previously, we are about to enter the stage where triangles typically will break apart. What will constitute the triangle breaking apart is for price to breach either our purple (a) wave high, or our purple (b) wave low. Price must continue to constrict to maintain the integrity of the triangle. Nonetheless, in my primary analysis I do believe we break upwards in the black count, but as of right now we have no confirmation as whether the purple or black count will prevail.
I suspect this week will be informative.
Chris

The Large Triple Correction WXYXZ in BTCThe Large Triple Correction WXYXZ in BTC is a formation often used in Elliott Wave Theory to describe a major corrective move. This formation refers to an extended series of sub-waves in a large correction. The general structure consists of five waves: W, X, Y, X, Z, representing a more complex corrective process. The typical behavior is as follows:
W: The first corrective wave, usually taking the form of a zigzag or corrective wave.
X: The recovery phase of the correction; generally a weak upward movement and often formed with lower volume.
Y: The second corrective wave, following the completion of wave W, representing a new downward move.
X: The second recovery wave, similar to the first X wave but typically shorter in duration.
We are nearing the end of the Large Triple Correction WXYXZ in BTC. After completing the final wave C, I expect a downward turn. Once it reaches the 48-49 level, the long journey may begin.

USDCAD - More downside look likelyFrom an Elliott Wave perspective, it looks like more downside is probable on the USDCAD. We have two have count possibilities (white and red numbering) and both point to another leg lower that should take prices below the previous low of 1.3436. We could go short at the market with a stop above 1.3630 for a great R:R.

