DOW Elliott Wave Analysis for Wednesday 19/07/2023In the 1 hour, it looks like the DOW is close to finishing an impulse to the upside. If we see the fifth wave ending with divergence, traders can initiate a short (against the main direction). A safer way to trade is to wait for the wave ((ii)) pullback and go long from there.
Elliottwaveanalyis

FTSE Elliott Wave Analysis for Wednesday 19/07/2023In the higher timeframe, we are doing a pullback. Also, the lower timeframe looks bearish. We are waiting for an ABC correction to the upside and initiate a short from there.

RDNTUSD Elliott wave count 4HRDNT 5 waves up leading diagonal for wave a/1 and correction into 0.618 fib retracement for a wave b/2.
Price break the 0.3030 pivot of wave b so we can keep the focus up against 0.2813 in a still-extending wave c/3,looking for price to aim for the 1 or 1.618 projection between waves (a/1) and (b/2).
Hit the like button if you like my analysis and follow me for future updates!
Future updates will be posted as updates to this count.
Daily intraday updates on 1H and 4H time frame, don`t miss them!!
Good luck!

XAUUSD DAILY TIMEFRAMELower timeframe perspective attached down below.
Elliott Wave is high subjective, i will post if there's a new update on my perspective.
Trade safe, Everyone!
Cheers.

buy setup for audusd the best scenario is to see the price mitigate the demand level for searching for buying opportunities from better prices
_____________________________________________________________
don't forget your risk management
follow for more :))

NASDAQ Elliott Wave Analysis for Thursday 06/07/2023Although the NASDAQ looks bullish in the higher timeframe, we expect a pullback in the lower timeframe. In the 4 hours, we see 5 waves up and wave 5 is ending with divergence compared to wave 3. If the divergence is not erased, we would expect a pullback. We had another successful trade yesterday. Now we have to wait for more data.

Ethereum Elliott wave count 1H intradayEthereum may be into an 4th wave impulse to the upside.
Key levels 1807.24 must keep it and than clearing 193.70 may continue to end the 5th wave.
Possible targets for this 5th wave 2026.15 - 2077.85 range.
Hit the like button if you like my analysis and follow me for future updates!
Good luck!

Bitcoin 2H Elliott wave countBitcoin probably entered into the correction phase of the wave 2 as the price had hit the 2.272 - 2.618 range of the Wave 1 fib extension.
Expecting targets for wave 2 are 29451.8 for a mega run up or if it break below it than expecting to go into one of the fib retracement of this impulse that may be 0.618 (27345.2) and this scenario is the most probable.
Also the price cleared previous top 31059 and this is a good point.
Hit the like button if you like my analysis and follow me for future updates!
Good luck!

Fantom Weekly Elliott wave countFantom looking promising on log scale.
Price was rejected into 1.618 fib extension of an impulse that may be Wave 1 than moved down into a correction that may be an expended flat pattern.
The price held an important level from 0.1530.
Keeping 0.1642 level and than clearing 0.5468 it may start an impulse that may be the 3rd wave from a bigger degree 5th wave.
Hit the like button if you like my analysis and follow me for future updates!
Good luck!

Part [A] Basic of Wave PrincipleElliott Wave background
In the 1930s, R.N Elliott identified the price of the stock trends and reversed a specific pattern. This pattern is repetitive in form and, the patterns have predictive value. He decided to use this pattern (Elliott wave theory) to predict the market. The Elliott wave is not primarily a trading system. It is a detailed description of how the market acts. The Elliott wave is part of technical analysis. Also, the Wave principle is the reassembled form of dow theory.
-Elliott Wave Principle The key To Market Behavior]
Waves in the market?
We all know that price never moves in a straight line. It will neither fall in a straight line nor rise in a straight line.
Price will create highs and lows. And this high and low creates waves. Elliott wave theory is all about counting waves and, we are going to use the Elliott wave to trade the market.
Now, the concept of waves is acceptable for you.
Elliott wave theory is made of 5+3= 8 waves.
Let me show you that structure in both trends.
In bull market ( UP Trend ) :
Figure 1.1 This is the Elliott wave structure in an uptrend. As we discussed, Elliott's wave theory is made up of 5+3=8 waves. Where five waves move with the trend and three waves move against the trend.
In Bear market (downTrend)
Figure 1.2 This is an example of Elliott wave theory in the Bear market. We can see that five waves move with the trend and, three waves move against the trend.
Take a deep breath, I know you have lots of doubts in your mind. Let me solve some.
1. Elliott wave theory works in any time frame.
2. These 5+3=8 waves will give us a market edge. It will provide strong trends & trend reversals.
3. The accuracy of Elliott wave theory is 84% of you are using the wave principle correctly.
Practical Example of Elliott wave theory :
In the Bull market :
Figure 1.3 This is the TATA MOTORS 4 hour timeframe chart. I used bar charts because It is easy to recognize Elliott's waves in bar Patterns. Well, it works for me to recognize if you feel that you can recognize patterns in another chart, go ahead with bar charts!
In Bear Market:
Figure 1.4: This is the ITC daily time frame chart. It shows the beautiful Elliott wave structure in the Bear market.
Elliott wave structure :
Now, we all know that Elliott is made of a 5+3= 8 wave structure. So, Let's start getting into it!
To understand the wave principle, we have divided the wave structure (5+3=8) into two Phases which are an Impulse phase/structure & a corrective phase/structure.
Figure 1.5 This picture illustrates Two phases of the Elliott wave principle.
The impulse phase is made up of 5 waves and, the corrective phase is made up of 3 waves.
Figure 1.6: This picture divides the wave principle into two phases.
1. Impulse phase/structure ( which includes five waves and, which moves with the trend you can see in bull market impulse phase is going upward and in a bear market, impulse phase is going down which is directional move.)
&
2. Corrective Phase/structure ( which includes three waves and which moves against the trend, you can see that in bull market corrective phase is going downward and
In bear markets, the corrective phase is going upward, which is a counter-trend move.
Figure 1.7 , Elliott wave has 2 phases. motive/Impulse phase ( directional move ) and corrective phase(counter trend move). We can divide these 2 phases into two types of waves. Impulsive waves and corrective waves.
Let’s zoom in on the impulse phase to understand the underlying structure and wave behavior.
Motive/Impulse Phase :
Important things about the impulse phase
1). Motive/Impulse phase is a Five wave structure that includes wave1,2,3,4 & 5.
2). motive/Impulse phase is a directional move ( moves with the trend.)
3). The Ending point of the impulse phase is the starting point of the corrective phase.
4). motive/Impulse structure is powerful than corrective structure.
5) Impulse phase can divide into two types of waves
i) Impulse waves: 1, 3,5 ( move with Trend of impulse Phase )
ii) Corrective waves: 2,4 ( Moves against the trend of Impulsive Phase)
Let me give you a quick understanding because we are going to cover these waves in-depth,
Impulsive waves are trend-following moves. We can find this type of wave structure in both phases. Impulsive waves create trends. Impulsive waves are (1,3,5,A,C). Corrective waves are counter-Trend moves. We can find this type of wave structure in both phases. Corrective waves provide pause to continue the trend,
Corrective waves : (2,4,B)
Motive/Impulse Phase in Bull market
Figure 1.8(A) , wave 1,3,5 is an impulsive wave of impulse phase because The trend of impulse phase up and, Impulsive wave are following the trend and heaving upward move.
And
wave 2,4 is the corrective wave of an impulse phase because the trend of the impulse phase is up but, the corrective wave is moving down, which is against the trend.
Figure 1.8(B) , wave 1,3,5 is an impulsive wave of impulse phase because the trend of Motive/impulse phase down and Impulsive wave are following trend and heaving downward move.
And Wave 2,4 is the corrective wave of an impulse phase because the trend of the Impulse phase is down but, the corrective wave is moving upward, which is against the trend.
Corrective Phase/structure :
Important things about the impulse phase
1). The Corrective Phase is a three-wave structure that includes waves A, B, C.
2). The corrective phase is a counter-trend move ( moves against the trend.)
3). The Ending point of the corrective phase is the starting point of the Impulse phase.
4) correction phase can divide into two types of waves
i) Impulse waves: A, C ( move with Trend of correction Phase )
ii) corrective waves: B ( moves against Trend of correction Phase )
Corrective Phase in a bull market:
Figure 1.9(A) : wave A, C is the impulsive wave of the Correction phase because the trend of the correction phase is down and Impulsive waves are following the trend and heaving downward move.
And
Wave B is the corrective wave of a Correction phase because the trend of the Corrective Phase is down but, the corrective wave is moving upward which is against the trend.
Figure 1.9(B): wave A, C is the impulsive wave of the Correction phase because the trend of correction phase Up and Impulsive waves are following the trend and heaving Upward move.
And
Wave B is the corrective wave of a Correction phase because the trend of the Corrective Phase is Up but, the corrective wave is moving down, which is against the trend.
Impulsive wave structure:
1. Impulsive waves are directional moves that are bigger than corrective waves.
2. Impulsive waves create trends.
3. Impulsive waves are subdivided into five waves.
( that means wave 1,3,5, A, C which moves with the trend will have five sub-waves.)
4. Impulsive waves are easy to recognize.
(Impulsive waves can also be called motive waves)
5. Ride of impulsive wave can give us a high probability trade setup with high Rewards
We are going to cover impulsive wave formations in the next part.
(diagonals,extensions,Impulse,Truncation)
Figure 1.10: As we discussed, Impulsive waves subdivide into five waves.
Here wave 1,3,5, A, C has five subwaves which you can see in the chart.
See you in the next part.
@forextidings

How to Count Waves Using Chart Patterns?We can count waves using traditional patterns like Head and shoulders, Double Top and Bottom,
Triangle, cup & handle, etc. This article is about how you can count waves by identifying chart patterns.
I have covered Three chart patterns in this article,
1) Triangles
2) Head and shoulders
3) Double Top and Bottom
1) Head and shoulders:
In addition, the two lows formed when the price failed to rise and fell back down were basically at the same level. The horizontal line is often referred to as the "neckline" When the price fails to fall back for the third time neckline will break. So "head and shoulders" was officially established.
Changes in volume with head and shoulders:
During the formation of "head and shoulders", the left shoulder has the largest volume, the Head has a slightly smaller volume, and the right shoulder has the smallest volume. The phenomenon of diminishing trading volume shows that when the stock price rises, the chasing force is getting weaker and weaker, and the price has the meaning of rising to the end.
Operation plan after the Head and shoulders appear:
When the head and shoulders formed, you can decisively follow up the short order. The formation of the head and shoulders indicates the beginning of a new round of decline in the market, and the minimum drop is the distance from the head to the neckline. The profit is very substantial. Therefore, studying the formation of the Head and Shoulders is also a necessary analysis process for band enthusiasts.
Wave Count:
The left shoulder: wave 3/A.
The first touch on the neckline: wave 4/B
Head: wave 5/C
The second touch on the neckline: wave A/1
The right shoulder: wave B/2
The ending point of the right shoulder: wave C/3
2) Triangles:
These are the most commonly used triangle patterns. In this motion, we are going to understand the triangle in terms of the Elliot wave. We'll be talking about the classical triangle pattern in an upcoming educational series.
Wave Count:
A triangle forms in corrective waves. There are Four corrective waves in Elliott wave theory. The corrective waves are 2,4, B, and X.
There are four waves in a triangle which are A, B, C, D, E.
The starting point of wave A of the triangle is the ending point of impulsive wave 1/3/A/W. After the completion of wave E of wave 1/3/A/W, the Impulsive wave will initiate.
3) Double Tops and Bottom:
In the chart, you can sometimes see the stock price fluctuations. The stock price fell back after reaching the highest price. After some sorting, it rose again to near the previous stock price level and then fell back. Two "normally highs" The high point is formed on the circuit diagram and will not be seen again in the short term.
Wave Count:
In a Bull market, The first Top of the pattern represents the completion of the impulsive wave. The ending point of the Impulsive wave is the starting point of the corrective wave.
I started the wave count from the first Top and labeled it as A, B, and C waves.
In a Bear Market, The first Bottom of the pattern represents the completion of the impulsive wave. The ending point of the Impulsive wave is the starting point of the corrective wave.
I started the wave count from the first Bottom and labeled it as A, B, and C waves. After wave C is complete, we can ride the impulsive waves.

ETH looking to start to take offAs you can see from my EW count, looking for upside resumption in ETH, as we have successfully retraced in a wave (ii), clear three wave structure and we are now looking for a completed five wave move into wave i and a potential completed three wave move in wave ii.

Bitcoin 15 min Elliott wave countBitcoin may end soon an impulse that may be a 3rd wave as the price is approaching 1.618 fib extension of an precedent wave that may be wave 1.
Key level for the 4th wave retracement is 28676.06 where also we have 0.382 fib retracement of the 3rd wave, if the price will break down I doubt that this trend will continue upwards. keep in mind this!!!
I will put updates soon as will see more price action!!
Hit the like button if you like my analysis and follow me for future updates!
Good luck!

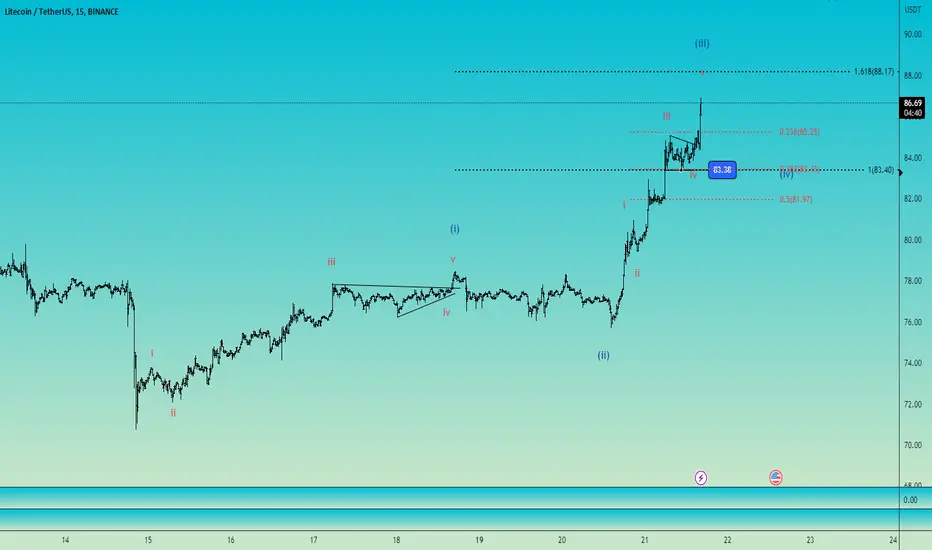
Litecoin 15 min Elliott wave countLitecoin may hit soon 1.618 fib extension to end an impulse that may be the 3rd wave.
Pivot point to the 4th wave 83.36, if will break down I doubt that this trend will continue upwards. keep in mind this!!!
I will put updates soon as will see more price action!!
Hit the like button if you like my analysis and follow me for future updates!
Good luck!
CRWD to continue higherInteresting EW setup here fro CrowdStrike. Looking for continuation higher into wave 3 as we have just reached equality of wave (c) vs. (a).
If I am correct we shall see an acceleration to the upside soon.

Dax to be supported soonI am looking at the possibility of a potential flat in wave 2 as we keep falling in what could be a wave {c}. Equality of wave {c} vs.{a} is where I would like to start seeing some support and that would be at the beginning of the golden box.
Feel free to ask question, trade safe!

Bitcoin Elliott wave intraday 4HBitcoin still going correctively and we may see further move to the downside to complete the Y wave.
Triangle pattern for the X wave if the 26435.81 remains intact.
Breaking near-term key level 25385.52 probably will start the move for Y wave.
Possible targets for the Y wave remains 0.5 fib retracement where we have 0.618 X vs Y or 0.618 fib retracement where we have equality between X and Y.
Hit the like button and follow me for future updates if you like my analysis.
Good luck!

BTC Elliottwave update 10/06/2023Hello Everyone,
Bitcoin is completing 4th wave & getting ready for 5th wave. Target is 35000 level.
Note: we have shared this info for education purpose only, not a recommendation, we are not responsible for your profits or losses, always trade with your own risk. We have the right to be wrong.

BTC Getting Ready to DROP - Read for more info!Bitcoin could enter a strong 3rd wave down soon which would likely send the price down to as low as 20700.
Due to the formation of the 5 clear waves in orange, the next major move looks like it will be a steep drop down.
A good entry on the short is at the Entry prices shown below.
The volume profile on the left hand side shows a significant amount of volume at the 28000 price level. This price is also at the 50% retracement of all 5 orange waves, so this would be an excellent place to enter a short position. In addition, we have the upward sloping white trend line and the 0.618 (golden ratio) retracement at 28740 which would also be an incredible place to enter a short position.
The stop loss is placed at the top of orange wave (1) because if the price goes beyond this level this count becomes invalid, although this seems highly unlikely to be reached.
The take profit shown below is at the price equal to 1.618 * the length of waves (1) to (5) taken from the 0.618 retracement of all 5 orange waves. This is a common ratio for price to reach during a '3rd' wave down (which this would be if it plays out). According to Elliott Wave Theory "The 3rd wave is usually the longest and strongest".
Entry Prices: 28741, 28056, 27387, 26897
Stop Loss: 31085
Take Profit: 20700
Disclaimer: Not financial advice and only intended for educational purposes

BNB set to ATH? I guess the explanation is in the chart. Much confluence all around which makes me think we could finally resume higher.
Questions are welcome, trade safe!

Bitcoin Elliott wave count 1HIf the correction WXY (black bubbles) is over than we may start to push higher.
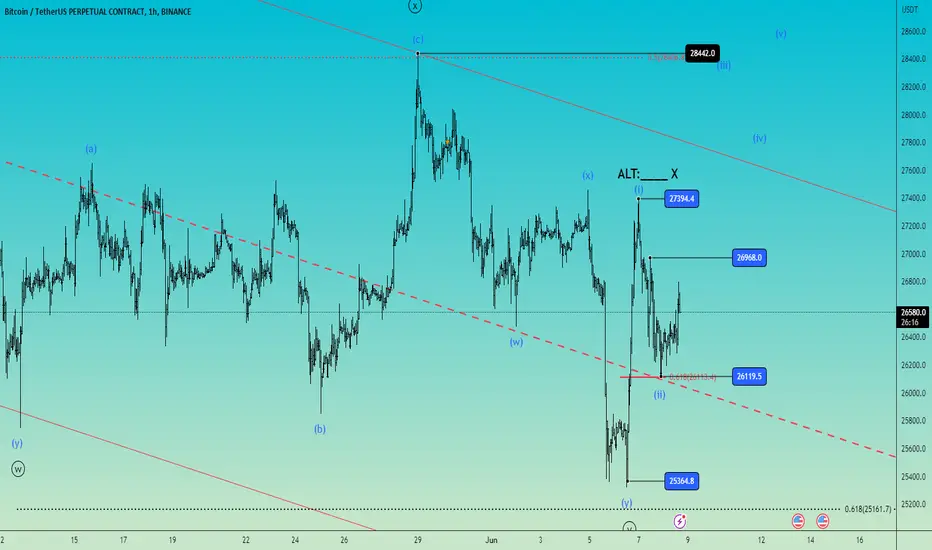
We may have an wave 1 started from 25364.8 and ended at 27394.4 to start an impulse to the upside.
Price bounced on 0.618 fib retracement of this wave 1 and probably completed wave 2 at 23119.5.
If this count is correct we may see for move to the upside if the price break above 26968.0 level.
Also a break below 26119.5 level may change this wave 1 count into an X wave (ALT scenario) and send the price into a deeper correction.
Good luck!
Hit the like button and subscribe for future updates if you like my analysis.
Bitcoin Elliott wave count 4HPrice on Bitcoin still into a down trend (red channel) that may be a corrective pattern, complex correction WXY(black count).
As I mentioned in the previous count (see the related idea) we started to go to the downside after price was rejected into the 0.5 (28430) fib retracement of the X wave.
The correction may end at the 0.5 (23255) fib retracement of the all up trend where also we have 1:1 proportion W vs Y waves.
At this moment price is approaching 0.618 (25235) proportion W vs Y waves where we have a heavy support zone and I am expecting the price to bounce.
If the price will not break this heavy support zone and will start to go up. only if it break out the channel and will take up 28430 level we can say that the correction is completed and the trend changed to the upside again.
Probably the Y (black count) wave will take the form of a complex correction (blue count) as we had into the W (black count) wave.
Also this WXY correction may transform into a leading diagonal but is not the time to talk about it because is too early!!! Only I want to signal that at this moment we have an ABC to the upside (All up trend started from 15460) and things could be worse!!!
Hit the like button and follow me for future counts if you like my analysis.
Good luck!

XAUUSD PROJECTIONElliott Wave is high subjective, i will post if there's a new update on my perspective.
Trade safe, Everyone!
Cheers
