A Step-by-step Guide to One of the Chart Analysis Method: VOLTASHello Friends,
Welcome to RK_Chaarts,
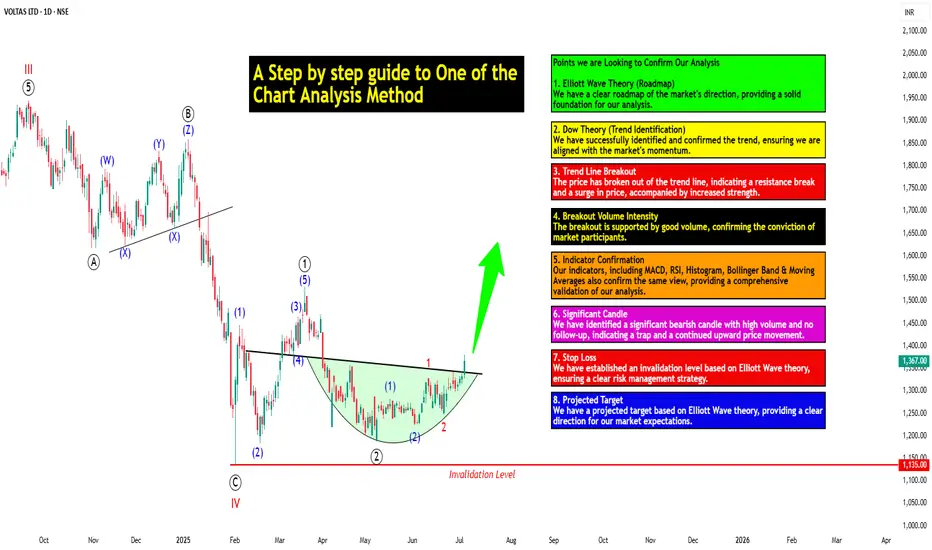
Today we're going to learn step-by-step guide to one of the chart analysis Method by analyzing a chart of " VOLTAS LTD. " to identify a trend change opportunity.(Educational Post).
Let's get started!
Applying Elliott Wave Theory
According to Elliott Wave theory, we can see that the high of September 20, 2024, marked the end of the wave III of the cycle degree in Red. After that, a corrective wave unfolded, which reached its low on February 1, 2025. This was the wave IV of the cycle degree in Red, with a low of 1135.
The approximately 6 months correction ended here, and now the wave V of the cycle degree in Red has begun. Within this, there will be five sub-divisions of primary degree in black, which we can label as waves ((1)) to ((5)). Of these, waves ((1)) and ((2)) are complete, and we are possibly now in wave ((3)) of the Primary degree in Black.
Within wave ((3)), there will be five sub-divisions of intermediate degree in blue, of which waves (1) and (2) are complete, and the (3)rd intermediate degree in Blue is underway. Within this, there will be five sub-divisions waves of minor degree in red, of which 1 and 2 are complete, and today we saw the breakout of the 3 of the (3).
Possibly, this is a momentum move according to Elliott Wave theory, which we can call the third of the third of the third.
Now that we have this low of wave IV at ₹1135, it should not go below this level according to Elliott Wave theory. If it does, our current wave count will be invalidated. That's why we have an invalidation level within Elliott Wave, which according to this chart is at ₹1135. This low should not be breached. If it is breached for any reason, we'll have to re-analyze our entire count, and the counts could be different.
However, if this low holds, then the minimum target for wave V, based on the projection of wave theory, would be at least 100% to 123% of the fall from top III to bottom IV, which could take it to around ₹2000 to ₹2100. Shown in chart image below
Possible Elliott Wave Counts on Daily Time Frame Along with Invalidation level & Target levels.
Dow Theory Suggests now Up Trend
After forming the top of wave III, we can see that the price has moved downwards in a pattern of lower highs and lower lows. However, after completing the bottom of wave IV, the price has started forming a pattern of higher highs and higher lows, indicating that an uptrend has begun.
This is a clear signal that supports our wave counts moving upwards, i.e., towards an impulse move, based on Dow theory. The successful completion of wave IV and the initiation of the higher highs and higher lows pattern suggest a strong bullish trend, and we can expect the price to continue moving upwards. Shown in chart image below
Breakout with good intensity of Volumes
In this chart, we've observed a rounding bottom type chart pattern, and today, we've seen a breakout above the upper resistance trend line. Today's candle volume is also significantly higher than the average. Shown in chart images below
Chart Pattern: Rounding Bottom
Resistance Trendline Breakout with Good Intensity of Volumes
Supporting Indicators & Moving Averages
Also we can see that the current price has closed above the 50-day EMA and 100-day EMA. Additionally, indicators like RSI is above 60 and showing momentum, MACD is positive and above the zero line, and the histogram is also showing a breakout. Shown in chart images below
Breakout above 50DEMA & 100DEMA
RSI Breakout above 60+ on Daily Time Frame
Bullish side Breakout in Histogram on Daily Time Frame
MACD running Positive & above zero line on Daily Time Frame
Bollinger Band on Weekly
If we look at the weekly time frame, the current week's candle is above the middle Bollinger Band, indicating that the price is above the 20-period simple moving average on the weekly time frame. which is very good sign. Shown in chart image below
Price Trading above 20 SMA on Weekly Time Frame (Mid.Bollinger Band)
Significant Observation in Price Action & Volumes
Before the breakout, the rounding bottom chart pattern that was forming at the bottom can be interpreted as accumulation, as a red bearish candle with high volume appeared, marking the highest volume. Notably, no candle has closed below the low of that candle since then.
Although a gap-down candle occurred, it opened and closed bullish, indicating no selling pressure below that level. The absence of bearish follow-up and the subsequent breakout today are significant observations, combining price action and volume. This is a positive sign suggesting the price may move upwards. Shown in chart image below
This is how chart analysis is done for investment purposes. We've seen many signs in our favor, and yet we still use a stop loss to prevent significant losses in case the stock or market moves unexpectedly. This is what stop loss is all about - minimizing potential losses.
We've also discussed the target projection based on Wave theory, 123.6% level, which we explained through an image. So, friends, I hope you've understood the entire conclusion and learned how to analyze charts using different methods, one of which we shared with you today.
I am not Sebi registered analyst.
My studies are for educational purpose only.
Please Consult your financial advisor before trading or investing.
I am not responsible for any kinds of your profits and your losses.
Most investors treat trading as a hobby because they have a full-time job doing something else.
However, If you treat trading like a business, it will pay you like a business.
If you treat like a hobby, hobbies don't pay, they cost you...!
Hope this post is helpful to community
Thanks
RK💕
Disclaimer and Risk Warning.
The analysis and discussion provided on in.tradingview.com/u/RK_Chaarts/ is intended for educational purposes only and should not be relied upon for trading decisions. RK_Chaarts is not an investment adviser and the information provided here should not be taken as professional investment advice. Before buying or selling any investments, securities, or precious metals, it is recommended that you conduct your own due diligence. RK_Chaarts does not share in your profits and will not take responsibility for any losses you may incur. So Please Consult your financial advisor before trading or investing.
Elliottwaveanalysisnifty
TSLA Elliott Wave Insight: A Bullish Path AheadTechnical Analysis of TSLA Based on Elliott Wave Theory
Overview
Based on the Elliott Wave Theory, we observe that TSLA has commenced a fresh impulse wave from the bottom of January 2023. This new wave marks the beginning of wave I in the red cycle degree, which concluded at the peak of July 2023. Following this, wave II in the red cycle degree began moving downward and concluded at the bottom of April 2024. It is crucial to note that wave II did not retrace beyond the start of wave I, confirming that the Elliott Wave principles have been adhered to. The bottom of wave I was at $101.43, and wave II concluded at $138.86, which is within the acceptable range.
Now, wave III in the red cycle degree has started its upward journey, which is expected to show significant strength and momentum. Typically, wave III can extend up to 161.8% of wave I, implying a strong bullish trend.
Subdivision of Wave III
Within wave III in the red cycle degree, there are five subdivisions expected, labeled as wave ((1)) to ((5)) in the black primary degree. Currently, we have embarked on wave ((1)) in the black primary degree, which itself should also subdivide into five smaller waves labeled wave (1) to wave (5) in the blue intermediate degree.
- Wave (1) and Wave (2) in Blue Intermediate Degree: These waves have already been completed.
- Wave (3) in Blue Intermediate Degree: We are likely in the early stages of this wave now.
Characteristics of Wave III
Wave III is often the longest and most powerful wave in the Elliott Wave sequence. Here are some key characteristics and signs to watch for:
1. Momentum and Strength: Wave III usually exhibits the strongest momentum and covers the most distance in the shortest time compared to waves I and V.
2. Volume Increase: There is often a significant increase in trading volume, reflecting heightened investor interest and confidence.
3. Impulsive Nature: Wave III is impulsive, meaning it moves in the direction of the larger trend. This is often driven by fundamental news and investor sentiment.
4. Extension: It is common for wave III to extend, reaching up to 161.8% of the length of wave I.
5. Subdivisions: Within wave III, there should be clear five-wave subdivisions in lower degrees, following the typical Elliott Wave structure.
Roadmap and Invalidation Level
The roadmap for TSLA suggests a bullish trend ahead, supported by the structure of the waves and the characteristics of wave III. The key invalidation level to watch is $138.86. As long as this level is not breached, the bullish outlook remains valid.
- Wave III Target: Ideally, wave III could extend to around 161.8% of wave I.
- Key Invalidation Level: $138.86. If TSLA breaks below this level, it would invalidate the current wave count and necessitate a reassessment of the wave structure.
Conclusion
The Elliott Wave analysis of TSLA indicates a strong bullish trend with the commencement of wave III in the red cycle degree. This wave is expected to show substantial strength and momentum, with a likely target near 161.8% of wave I. As long as the invalidation level of $138.86 holds, the bullish bias remains intact. Investors and traders should watch for the key characteristics of wave III and monitor the wave subdivisions closely to confirm the ongoing wave structure.
I am not Sebi registered analyst. My studies are for educational purpose only.
Please Consult your financial advisor before trading or investing.
I am not responsible for any kinds of your profits and your losses.
Most investors treat trading as a hobby because they have a full-time job doing something else.
However, If you treat trading like a business, it will pay you like a business.
If you treat like a hobby, hobbies don't pay, they cost you...!
Hope this post is helpful to community
Thanks
RK💕
Disclaimer and Risk Warning.
The analysis and discussion provided on in.tradingview.com is intended for educational purposes only and should not be relied upon for trading decisions. RK_Charts is not an investment adviser and the information provided here should not be taken as professional investment advice. Before buying or selling any investments, securities, or precious metals, it is recommended that you conduct your own due diligence. RK_Charts does not share in your profits and will not take responsibility for any losses you may incur. So Please Consult your financial advisor before trading or investing.

Unfolding Waves in Chambal Fertilisers: Bullish Path AheadAn analysis of Chambal Fertilizers using Elliott Waves, we can observe an interesting progression in the stock's price movements on a weekly cycle. The chart has completed the initial waves I through IV, and it is currently unfolding wave V, signaling a strong potential for a bullish trend ahead. Let's delve deeper into the details of this wave analysis.
Weekly Cycle
Wave V: We are observing the unfolding of wave V on the weekly cycle. This wave is showing potential for further upside as the stock completes its final wave in the longer timeframe.
Subdivision of Wave V: Within wave V, the stock has already completed waves (1) and (2), and it is now unfolding wave (3).
Wave (3) of Wave V
Progression within Wave (3): In the ongoing wave (3) of V, we've seen waves 1 through 4 completed, and the current focus is on wave 5 of (3).
Hourly Timeframe
Progression within Wave 5 of (3) of V: In this specific timeframe, wave 5 has already seen the completion of sub-waves ((i)), ((ii)), ((iii)), and nearly all of wave ((iv)). This suggests we are likely at the end of wave ((iv)), poised for wave ((v)).
Elliott Waves Fundamentals
Wave Counts: The stock's progression through each wave provides valuable insights into potential market behavior. The typical characteristics of an impulsive wave, as seen in the unfolding of wave V, include strong, directional movements, which are followed by corrective waves.
It’s essential to apply appropriate risk management techniques, such as setting stop losses, to mitigate potential downsides. Be cautious in managing your exposure and avoid over-leveraging.
This analysis is purely for educational purposes and should not be taken as investment advice. Always conduct your own research and consult a financial professional before making any investment decisions. Remember, market conditions can change rapidly, and past performance does not guarantee future results.
This analysis aims to provide an overview of the potential trajectory of Chambal Fertilisers based on Elliott Waves. It's always important to stay vigilant and adjust your approach as new information becomes available. Happy trading!
I am not Sebi registered analyst.
My studies are for educational purpose only.
Please Consult your financial advisor before trading or investing.
I am not responsible for any kinds of your profits and your losses.
Most investors treat trading as a hobby because they have a full-time job doing something else.
However, If you treat trading like a business, it will pay you like a business.
If you treat like a hobby, hobbies don't pay, they cost you...!
Hope this post is helpful to community
Thanks
RK💕
Disclaimer and Risk Warning.
The analysis and discussion provided on in.tradingview.com is intended for educational purposes only and should not be relied upon for trading decisions. RK_Charts is not an investment adviser and the information provided here should not be taken as professional investment advice. Before buying or selling any investments, securities, or precious metals, it is recommended that you conduct your own due diligence. RK_Charts does not share in your profits and will not take responsibility for any losses you may incur. So Please Consult your financial advisor before trading or investing.

Nifty hourly Elliott wave analysisThe move from 17348 is corrective. There is no way an elliottician calls it an impulse move going on.
So, the move should be correct 100% to justify it as a corrective move.
There are a few corrective moves that don't retrace fully, eg. the legs of a triangle. But this move seems like it should correct 100% soon.
A good elliottician is not the one who always has counts, but the one who give counts when there is most and more probability and possibility.

NIFTY Lower time frame If we do not break 17930-17900 range downside then a possibility of the wave 3 upside.
The counts are on the basis of lower time frame. Please refer to the earlier chart where if broken lows of 23.12.2022 we can further move down.
The 2 possibility are in the view.
Please do your own analysis before going for a trade or investment.
Regards
