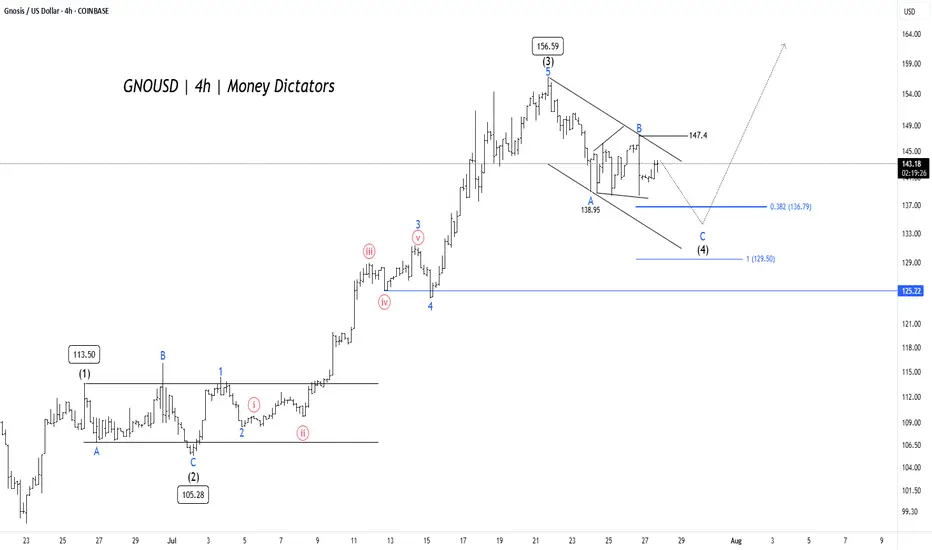
GNO/USD Price Action Aligns for Final Wave 5 PushGNO/USD pair is unfolding a clean Elliott Wave impulse pattern on the 4-hour chart. The rally began with Wave (1) reaching 113.50, followed by a corrective Wave (2) that bottomed near 105.28. This set the stage for a powerful Wave (3) that surged to 156.59, aligning well with Elliott Wave theory where Wave 3 is typically the strongest and steepest leg in the sequence.
Wave (4) is now in progress, taking the form of an A-B-C correction inside a descending channel. Interim support was found at 138.95 during Wave A, and Wave C could extend toward the 0.382 Fibonacci retracement level at 136.79 or the deeper support zone near 129.5. These levels are crucial, as they often mark the end of a corrective phase and the beginning of the next impulse. A confirmed breakout above 147.4 would signal the start of Wave (5) and the return of bullish momentum.
Short-term targets have the potential to reach 135 – 128 , while 125.22 remains the invalidation level for this bullish setup. After the completion of Wave (4), traders can look for long opportunities targeting 147 – 154 – 172 . As long as the structure holds and price respects key supports, the outlook remains favorable for a fresh push higher in Wave (5).
Elliottwavecorrection
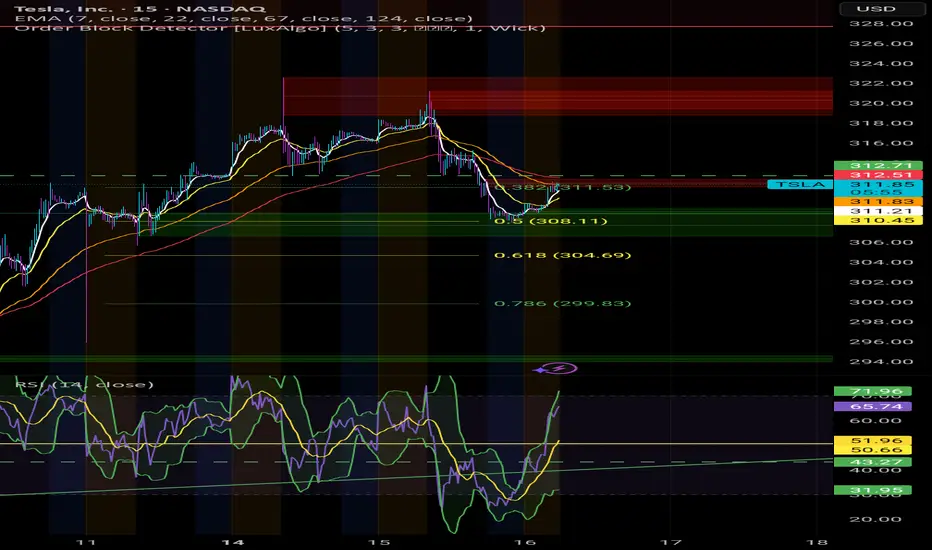
Is the BullRun over? I don't think so. $TSLAYesterday we saw a somewhat heavy fall in Indexes, and it probably scared alot of retail Bulls outs.
However, it seems we've fallen straight into potential medium term supports across multiple stocks in the markets.
I'm convinced we will get a good economic data print today.
This would open the door to new ATHs, again, in the Indexes.
For this to play out, the local bottoms established over night need to hold.
GOLD (XAUUSD) – Wave b Complete? Preparing for Wave c RallyGold tapped into the key demand zone and swept sell-side liquidity (SSL) beneath wave (iii) lows.
A five-wave decline appears complete, with wave (v) of b terminating just below the o.618 fib extension at 3344.86.
🟢 Wave c projection now in focus — looking for a 5-wave impulsive rally to develop.
Targeting the Sell Zone between the 0.5–0.764 retracement (3395.87–3425.07).
🧠 Structure Notes:
✅ Imbalance Zone (IMB) formed during the breakdown has now been tapped
🔻 SSL swept + bullish reaction = potential change of state
🟢 Wave (i) and (ii) projection underway – price needs to maintain structure above 3357.43 for bullish continuation
Targets: 3408.81 (0.618 Fib)
Invalidation below: 3340.31
Momentum and RSI divergence support reversal

EUR/USD Elliott Wave Outlook – Expanded Flat Playing Out?EUR/USD appears to be unfolding a classic expanded flat correction for wave (4):
Wave A formed as a 3-wave zigzag
Wave B retraced beyond the start of A — a key trait of expanded flats
Now looking for a 5-wave C-leg decline toward the 1.1122 – 1.1002 area
Aligned with 1.0–1.618 extensions of A
RSI + MACD divergence adds bearish confirmation at the B top
Potential bullish reversal zone into late June / early July
As long as price holds below the B high (~1.1650), the bearish path in wave C remains in play.
📍 Target zone: 1.1122–1.1002
📈 Bias: Bearish short-term, bullish long-term (wave 5 up next)

WTI Crude Oil – Bearish Elliott Wave SetupOn the 15-minute chart, I’m tracking a corrective rally in wave (ii) heading toward the 0.618 Fib zone (around 62.2–62.3) before the next major leg lower.
🔻 Bearish target: 52.00
📈 Looking for the final push up before confirming downside continuation.
💬 What are your thoughts on this Elliott Wave count?
For more updates and ideas, check my profile bio!
#WTI #CrudeOil #elliottwave #priceaction #technicalanalysis

DXY Has More To The UpsideDXY is right now in what I believe to be a 4th wave correction, which has turned into a wxy, and probably also will turn into a WXYXZ.
It has plenty of room to develop.
Since 4th wave corrections has a tendency to enter the area of the 4th wave of previous impulse, it will most likely go up to the area of the green rectangle above.
This will be between 103.2 - 104,7.
If it will go further up before heading down is to early to say.
But my previous forecast about it will go down below 96 is still in play and intact.

Gold Is Doing What Ever Gold Wants To DoPreviously I posted a reading where I said gold was to go a bit down before is went up. But Gold didn't go down, and went straight up.
But it did go up right :D
Right now I strongly believe gold is in a wxy correction.
And I think will finish the y-wave i the green box area somewhere between 3,147 and 3,077, which is the 100-123% fib-level of the w-wave.
The reason I believe this, is at that timewise the y-wave will here have taken as long as the w-wave, and I the price is heading for that cyan median line. And normally price will also go to the bottom and a bit below of the Kennedy line.
Multiple factors are pointing to that level.
When price hits that level, I believe we will see a 5th level to the upside where 4,000 definitely is in play.
I will include a link to a higher degree reading, where you can see I believe gold has finished a third wave, so we still need a 5th wave to the upside.

BTC is Still A Correction.BTC is in good rally these days, but my believe is that it is still in a correction.
I am not 100% confident in wavecount, but I am confident that BTC is not done correcting until it has gone down to somewhere between 62.500 - 52.500.
If the rally BTC is currently in, I believe we are seeing a flat, and I will correct my count accordingly.. But right now I'm seeing a W-X-Y-X-Z correction.
Be careful, and do not bet on BTC is rallying to a million just yet ;)
For now I believe there will be good odds for following the white line I've drawn on the chart.

Elliot wave corrective ABC Triangle pattern Wave A is an impulsive wave that 5 subdivisions. Wave B is an abcde triangle and each wave has 3 subdivisios. a-b of the triangle is connected by wxy (also has 3 subdivisions each).
Look at smaller time frame to see (and confirm structure). Currently looking out for wave d of the triangle (wave 1 of 3) to complete then followed wave e 3 waves in the opposite direction, before there can be any break-out.
This is only an idea not financial advice

EURJPY: Short Setup with Target Zones in FocusEURJPY outlines a clear W-X-Y corrective pattern. Wave (W) ended at 161.297 , followed by an upward corrective move in Wave (X), which topped at 162.665 with a classic ABC formation.
Currently, the price is hovering around 162.084, likely forming Wave B of the final Y leg. A brief move higher could complete this B wave before the pair resumes its decline toward the 160.922–160.680 area, which marks the projected end of Wave C of (Y).
The broader correction is framed by two descending blue trendlines, providing dynamic resistance and support, while a short-term red ascending trendline is currently holding the price action but may soon give way. If the price stalls or rejects around the 162.3–162.5 zone, it could signal the start of the next leg down, making it a potential setup for short positions. After the reversal from Wave Y, potential upside targets are 161.600, 162.500 , and 163.100 .
We will update it soon!

Binance Coin BNB is Likely to go down, until at least end of MayBNB has been in a correction since the start of December '24. And as time went by, it developed into an combo correction.
I believe we are at the end of the purple B-wave of the green (Y) wave.
We are right now finithing the white ((c)) wave of purple B wave, so we are going to see a small wave up until around the 630-640 level. And after this the purple C wave is going to take on downwards.
And since very rarely the c wave has a shorter timespan than the a wave, we are not going to see this correction end until the end of may/ start of june.
I believe the purple C wave are going to take us down to the 382 level in that yellow box.
The 383 level is the 61.8% retracement of the primary white ((1)) wave. And this level is also roughly around the 100% Fib level of the purple A wave.
If price comes to the green box I've drawn out. I belive that would be a good time to start looking for a confirmation to short.

Elliott Wave Principles: A Study on US Dollar IndexHello friends, today we'll attempt to analyze the (DXY) US Dollar Index chart using Elliott Wave theory. Let's explore the possible Elliott Wave counts with wave Principles (Rules).
We've used the daily time frame chart here, which suggests that the primary cycle degree in Black weekly wave ((A)) and ((B)) waves have already occurred. Currently, wave ((C)) is in progress.
Within wave ((C)) in Black which are Weekly counts, Subdivisions are on daily time frame, showing Intermediate degree in blue wave (1) & (2) are finished and (3) is near to completion. Post wave (3), we can expect wave (4) up in Blue and then wave (5) down in Blue, marking the end of wave ((C)) in Black.
Additionally, within blue wave (3) Intermediate degree, we should see 5 subdivisions in red of Minor degree, which is clearly showing that waves 1 & 2 are done and now we are near to completion of wave 3 in Red. followed by waves 4 and 5, which will complete blue wave (3).
Key Points to Learn:
When applying Elliott Wave theory, it's essential to follow specific rules and principles. Here are three crucial ones:
1. Wave 2 Retracement Rule: Wave two will never retrace more than 100% of wave one.
2. Wave 3 Length Rule: Wave three will never be the shortest among waves 1, 3, and 5. It may be the largest most of the time, but never the shortest.
3. Wave 4 Overlap Rule: Wave four will never enter into the territory of wave one, meaning wave four will not overlap wave one, except in cases of diagonals or triangles.
Invalidation level is a level which is decided based on these Elliott wave Principles only, Once its triggered, then counts are Invalidated so we have to reassess the chart study and other possible counts are to be plotted
The entire wave count is clearly visible on the chart, and this is just one possible scenario. Please note that Elliott Wave theory involves multiple possibilities and uncertainties.
The analysis we've presented focuses on one particular scenario that seems potentially possible. However, it's essential to keep in mind that Elliott Wave counts can have multiple possibilities.
I am not Sebi registered analyst.
My studies are for educational purpose only.
Please Consult your financial advisor before trading or investing.
I am not responsible for any kinds of your profits and your losses.
Most investors treat trading as a hobby because they have a full-time job doing something else.
However, If you treat trading like a business, it will pay you like a business.
If you treat like a hobby, hobbies don't pay, they cost you...!
Hope this post is helpful to community
Thanks
RK💕
Disclaimer and Risk Warning.
The analysis and discussion provided on in.tradingview.com is intended for educational purposes only and should not be relied upon for trading decisions. RK_Charts is not an investment adviser and the information provided here should not be taken as professional investment advice. Before buying or selling any investments, securities, or precious metals, it is recommended that you conduct your own due diligence. RK_Charts does not share in your profits and will not take responsibility for any losses you may incur. So Please Consult your financial advisor before trading or investing.

Still Need Some Correction For S&P500 / ES Before Going UpAttention: Prices are read on the futures chart, so they might be different if you are reading on cash charts. But directions and realtionships, should be very similar.
I believe S&P is in a very volatile correction and it is a bit hard to read.
To me it looks like price completed a green (a) of the grey ((y)) wave with a failed 5th and started the green (b) wave with a very aggressive purple a wave.
I believe we are now finishing the blue a-b-c correction in a c-wave diagonal and I would like to see it go down to 5110 area in the green box, for the c wave to have room to develop into the yellow box in the 5530 area.
If price is heading above the 5630 area, I would start to look for another count, since this would mean the green (a)-(b)-(c) correction should have been a flat, and since the green (a) wave is not counted in three waves, this can't be correct.
Right now I would like price to go down to the 5110 area, then back up to the 5530, and then we start the last green (c) wave of the grey ((y)) correction.
And this green (c) wave has plenty of room. All the way down to 4176 before it invalidates the count.
After all this correction, happy days are starting again, where the 5th wave could be heading for the 6500 to 7000 area.

A Zoom of the Weekly DXY into a Daily viewI kept the colored rectangels from my weekly analysis, to keep the focus and knowledge where we are on the chart.
DXY is doing a long A-B-C before it's is going into the last impulse og the C of Y of x of the larger degree.
It's quite a lot of corrections to manage, but if you swipe from the daily to the weekly timeframe, it makes good sense. For me at least :D.
The purple B wave took some time to figure out, but this was what made most sense to me. I was trying to look at it as a triangle, but that wouldn't have a good shape, so I ended out with this white ((w))-((x))-((y)) correction.
DXY is right now performing, what I see as, a extended 5th wave in the white ((iii) wave, before it goes into the white ((iv)) correction.
The white ((iv) wave correction could be become a long shallow drawn out correction for two reasons.
We had a steep and swift white (ii) followed by an extended white ((iii) wave. This usually means we are going to spend some time correcting that white (iii) wave and the rule of alternation tells us, if we have a quick 2nd wave, we are usually going to see a slow fourth wave.
I don't believe we have completed the white (iii) yet, so we have a long time to go still until that white (iv) wave is done.
When the white (iv) wave is done, the white (v) wave is probaly going to take us down to that green box.
So relax for the next 6 months and grab yourself a cup of coffee.

DXY In Difficult Circumstances Since the Start 80's I decided to give a go at the Dollar Index given the circumstances around the world. And to be honest, I tried to put on the positive glasses.
I believe the dollar has been in a complex correction since the mid 80's. Starting out with a large dump in '85 with the a-wave, the correction slowed down and only grew more and more complex.
Thought about current wave: What I believe we are going through now is, that we are finishing up the purple C-wave in a green (C)-wave. This wave can end at any time now, since it's now at the 61.8% fib level of the purple A-wave. But it might go down to the 95 level (The green box) to complete at the 100% fiblevel of the purple A-Wave.
But first we will have the fourth wave meaning the DXY is gonna struggle for some weeks. Because we had a swift two week wave 2, which means we are probably going have a slow fourth wave according to the rule of alternation. This mean the purple C-wave could drag out into the end of '25 into early '26.
This is also with that in mind that a C-wave most likely will take longer than an A-wave. These are the Purple boxes.
BUT, after this, DXY is gonna experience some happy years again, going back up to the yellow box somewhere between 110 and 120 to finish the WXY of x of the larger degree. This will take DXY into a couple of years bull-run as long as the green (C) wave runs and completes no earlier than late '27, depending when the purple C-wave prior to the green (C) wave ends. But I believe the green (C)-wave will take about two years to complete.
But after this, DXY could again go into some dark ages and considering the high degree purple w-wave took 23 years to complete (blue giant box), there is no reason to believe this high degree purple y-wave will be a swift matter and actually don't complete before the year 2050. And it will take the DXY all the down to start 60's or lower.
The reason I said I tried to put on the positive glasses, is that I tried seeing the white channel as a leading diagonal for a new bull run, but I just don't see it as such.
I also tried seeing it as a C-wave of a flat diagonal, but this would result in another C-wave afterwards, and also take us down to the 60's level. So that didn't do us any good.
For the sake of DXY, I hope I'm wrong, but this is how I see it.

CFD Gold Chart Analysis: Wave 4 in FocusHello friends, let's analyze the Gold CFD chart from a technical perspective. As we can see, the higher degree Cycle Wave III (Red) has completed, and we're currently in Cycle degree Wave IV (Red). Within Wave IV, we expect a Primary Degree ((A)), ((B)), and ((C)) in Black. Wave ((A)) has completed, Wave ((B)) is almost complete, and Wave ((C)) is expected to follow.
Within Wave ((B)) in Black, we have Intermediate Degree Waves (A), (B), and (C) in Blue. Waves (A) and (B) are complete, and Wave (C) is nearing completion. Once Wave (C) in Blue completes, Wave ((B)) in Black will end, and Wave ((C)) in Black should begin.
According to theory, Wave ((A)) came down and then wave ((B)) retraced upwards so now Wave ((C)) should move downwards, forming a zigzag correction. The equality level is around $2858. However, we don't know if it will reach this level or extend/truncate.
The invalidation level for this view is 3169.23. If the price breaks above this level, our analysis will be invalidated.
This analysis is for educational purposes only and not trading advice. There's a risk of being completely wrong. Please consult your financial advisor before making any trades.
I am not Sebi registered analyst. My studies are for educational purpose only.
Please Consult your financial advisor before trading or investing.
I am not responsible for any kinds of your profits and your losses.
Most investors treat trading as a hobby because they have a full-time job doing something else.
However, If you treat trading like a business, it will pay you like a business.
If you treat like a hobby, hobbies don't pay, they cost you...!
Hope this post is helpful to community
Thanks
RK💕
Disclaimer and Risk Warning.
The analysis and discussion provided on in.tradingview.com is intended for educational purposes only and should not be relied upon for trading decisions. RK_Charts is not an investment adviser and the information provided here should not be taken as professional investment advice. Before buying or selling any investments, securities, or precious metals, it is recommended that you conduct your own due diligence. RK_Charts does not share in your profits and will not take responsibility for any losses you may incur. So Please Consult your financial advisor before trading or investing.

My take on Gold. It's a difficult one..This is the read that makes most sense to me. And I have zoomed all the way into 15m, for you to be able to see my thoughts around it all.
For that wave down from April 2nd to April 7th to make any sense to me, I have labeled it as W-X-Y to complete (A). At first I had labeled it as a diagonal, but then price should not have retraced as much as it has since April 7th.
And I also believed Gold has finished a 5th of a 5th wave, so we need to see some more correction before price head to the upside again.
I simply can't read the retracement back up since the April 7th as a A-B-C, and this is why I believe price is just finishing up the A wave (and it might already have) before it goes into the B correction.
The initiated wave down (wave B of (B)) I believe will go down to 3,044 - 3,013 level and then finish of the flat with a wave C of (C).
This wave C should be able to go to the 3,130 - 3200 level.
But as I said, first we spend some days to the downside heading for that 3,044 - 3,013 level.
What is your current take on gold?

NVDA’s Final Act: A Breakout Waiting to HappenNVDA appears to be nearing the completion of its corrective phase, setting the stage for a potential move to new highs. The current pattern resembles a falling wedge, indicative of an ending diagonal formation, which often signals a reversal and the start of an upward trend.
The structure of the corrective channel, along with the termination of the diagonal pattern, suggests a high likelihood of a running flat formation. Buyers are likely to intensify demand pressure as the price approaches the lower boundary of the trendline. A trend reversal may occur if there is a decisive breakout above the Wave 4 level of the ending diagonal.
Buying opportunity with minimal stop is possible after the reversal from lower side of the channel. Targets can be 112 - 120 - 132 - 140.
I'll be sharing more details shortly.

Asian Paints Weekly Elliott Wave Analysis – March 17, 2025The price action of Asian Paints (NSE: ASIANPAINT) has been following a clear Elliott Wave structure.
The stock completed a primary wave (3) at the peak, with a truncated 5th wave, indicating weakness in the final leg of the impulse.
It is currently undergoing a wave (4) correction, following a W-X-Y pattern, with the price moving lower towards the 1.618 Fibonacci extension target at ₹1,931.
The invalidity level is set at ₹1,297, below which the larger wave structure would need reconsideration.
Indicators like RSI and MACD are reflecting oversold conditions, suggesting a potential bounce or consolidation before further downside.
A confirmation of wave (4) completion would signal the start of wave (5) towards new highs.
📉 Key Levels to Watch:
Support: ₹1,931 (1.618 Fib Extension)
Resistance: ₹2,492 (Wave Y previous support)
Invalidation Level: ₹1,297
This wave count suggests that Asian Paints is nearing the end of its correction phase. A reversal from the target zone could set the stage for the next bullish impulse.
📢 Disclaimer: I am not a SEBI-registered analyst. This analysis is for educational and study purposes only. Any profits or losses from trading based on this analysis are entirely your own responsibility. Do your own research before making any trading decisions.

Short term Possible double correction in progress, looking for more upside as long as current lows hold

DJT transportation - Macro Bearish outlookI would count the 2022-2024 rally in DJT transportation index as a large corrective subwave (B) up to be followed by a subwave (C) of wave (4) down

Possible wave counts of chart NVIDIA dip now then upHello Friends,
Today we have plotted Elliott wave counts on NVIDIA Corporations chart Technical Analysis Case study, In this study we used Elliott Wave Theory & Structures, it involves multiple possibilities, and the analysis presented focuses on one potential scenario. The provided information is for educational purposes only, not trading advice. There's a risk of being completely wrong, and users are warned not to trade or invest solely based on this study. The content is not an advisory and does not guarantee profits, We are not responsible for any kind of profits and losses; individuals should consult a financial advisor before making any trading or investment decisions.
I am not Sebi registered analyst.
My studies are for educational purpose only.
Please Consult your financial advisor before trading or investing.
I am not responsible for any kinds of your profits and your losses.
Most investors treat trading as a hobby because they have a full-time job doing something else.
However, If you treat trading like a business, it will pay you like a business.
If you treat like a hobby, hobbies don't pay, they cost you...!
Hope this post is helpful to community
Thanks
RK💕
Disclaimer and Risk Warning.
The analysis and discussion provided on in.tradingview.com is intended for educational purposes only and should not be relied upon for trading decisions. RK_Charts is not an investment adviser and the information provided here should not be taken as professional investment advice. Before buying or selling any investments, securities, or precious metals, it is recommended that you conduct your own due diligence. RK_Charts does not share in your profits and will not take responsibility for any losses you may incur. So Please Consult your financial advisor before trading or investing.

Bitcoin Elliott Wave Signals Potential Corrective Phase TargetsLooking at the recent BINANCE:BTCUSDT chart through the lens of Elliott Wave Theory, we can observe a clear and compelling price structure. The market has completed a textbook Impulse Wave pattern (1-5), with Wave 5 reaching a notable peak around 109,000 USDT. This aligns perfectly with Elliott Wave principles, where Wave 5 typically extends beyond the peak of Wave 3, which is exactly what we witnessed.
The market has now transitioned into a Corrective Wave pattern (A-B-C). We've already witnessed the completion of Wave A's downward movement, followed by Wave B's characteristic short-term rebound. Currently, price action suggests we're in Wave C, which traditionally implies further downside potential.
Particularly noteworthy are the three projected target levels for Wave C:
87,847 USDT
82,270 USDT
66,149 USDT
These targets align beautifully with Fibonacci retracement levels, a tool that consistently demonstrates remarkable synergy with Elliott Wave Theory. The lowest target at 66,149 USDT could represent a significant base formation, especially if selling pressure intensifies in response to market conditions.
The chart's notation of "Wave(C) OnSet" is significant, indicating we're entering the initial phase of Wave C. This wave could potentially extend to any of the three target levels in the near term. As the price approaches these projected levels, we might see the emergence of a new bullish cycle.
I anticipate that if the BTC price drops below 90k, the significance of the Corrective wave (C) across all three levels will become even more pronounced. This could indicate substantial selling pressure, making any potential recovery in the upcoming period more challenging.
However, prudent analysis requires careful attention to support level confirmations and corresponding trading volumes at each target. In practical trading scenarios, price movement doesn't always reach the lowest projected targets. Wave C might be truncated, or conversely, could extend beyond our projections. This underscores the importance of incorporating additional technical analysis tools to form a comprehensive trading strategy.
This wave structure presents an intriguing setup, and it will be fascinating to observe how price action develops in relation to these projections. Remember that successful trading requires a holistic approach, combining wave analysis with other technical indicators and careful risk management.
