FB: Buy zone is 205-210FB just completed a 5-wave move off the low. This is a good sign that the stock has indeed bottomed. What comes next is the W-2 pullback. The standard fibonacci retracement targets for a pullback are .5 and .618, which translates to a buy zone of 205-210. There are also bearish divergences in MACD and RSI, indicating that the uptrend is exhausted. I do not own shares of FB, but if I did, I would be selling covered calls against my shares to protect my downside over the next week or so. FB should reach about the $300-$350 region this year.
Elliottwavecorrection

LUNA / USDT ELLIOT WAVE LUNA / USDT ELLIOT WAVE
Impulse dalgasının ABC düzeltmesi bitmiş ve öncül Diagonal olmuş gibi duruyor , bu yeni bir Impulse dalgasının 1 dalgası olabilir. Eğitim amaçlıdır yatırım atvsiyesi değildir.

mkr do the best i am bullish and hope to follow the blue path
what do you think?
i appreciate your feedback.
thanks
TP 9000$
SL 1513$

ABC Flat, wave 4 macro finished?I'm still having this possible scenario. The bullish structure of the new impulse upwards from January 24th is only valid if we don't go below these levels we are now. Losing them will send us at least to those low levels again to finish the 5th wave down of the ABC the correction.

Short term move for Vechain Once this ABC-pattern triggers vechain's bound to hit the .441 fib retracement. Bullish times ahead :)
Also just a massive fan of Vechain fundamentally.

ALLY Wave 4 Completed?Hello everyone, I wanted to share with you all what I'm seeing with ally. I believe Ally has completed a flat wave 4 correction. I have outlined 2 pink lines, one will invalidate the flat correction thesis and the other will validated. In other words if Ally breaks and closes below $44 the pattern will be invalidated and a larger correction will probably be in play ; on the other hand if ally breaks and closes above $49 the pattern will be valid and longs should be considered. I hope this helps some of you. I'm not a financial advisor, I'm only sharing what I'm doing. Good luck everyone!

XAUUSD Elliott Wave Forecast - Wave C UpdateAs previously mentioned, price should now be in Wave iii of C (please refer to linked idea below).
Following the lower degree wave 1 of iii, the lower degree wave 2 of iii is currently being printed. This is commonly a Zigzag resembling a 5-3-5 wave structure.
We saw the initial 5 waves form during the earlier part of this week. The 3 waves of the 5-3-5 now also appear complete with wave (C) reaching the 123.6% of wave A.
The final 5 waves of the 5-3-5 should now follow, either in an impulse or diagonal. The near term price objectives for these final 5 waves are 1816 and 1825. A further extension towards 1836 is possible and also a level where price should see stronger resistance if reached.
Please do leave your thoughts in a comment below.
As always, your support with a 'like' or 'follow' is much appreciated.
Thank you for taking the time.
BeyondEdge
Your Edge Is Your Perception. Go Beyond.

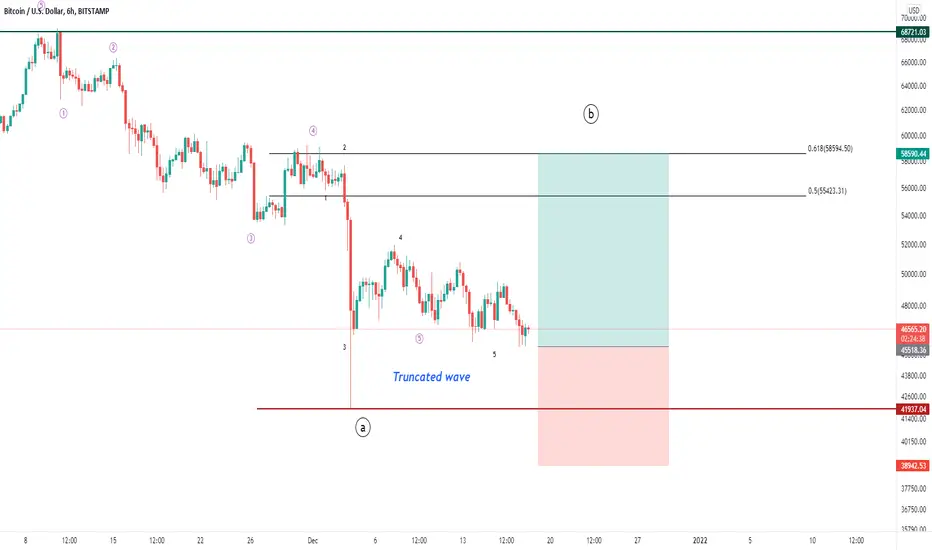
BTCUSD Elliott Wave Forecast - Wave 4 Correction (alternate)The chart depicts my alternate count for the current Wave 4 correction. I believe we are in the final impulse sub wave C which is close to completion.
For those of you who are unfamiliar with this; a flat correction, be it Regular, Expanded or Running all consist of a 3-3-5 wave structure (ABC).
As BTC had printed a more complex correction for Wave 2, alternation guidelines concerning Waves 2 and 4 would allude to a simple correction for this ongoing Wave 4. The simple correction here is in the form of a Running Flat. Please see linked idea below for the Expanded Flat scenario.
I am currently leaning towards this alternate count. The Expanded Flat scenario will only take precedence should price drop below 28.6k. If this level is breached, we can expect further depreciation towards the 24k-25k level.
I hope you found this useful, do leave your thoughts in a comment below.
As always, a 'like' and 'follow' is much appreciated and provides encouragement to share further ideas.
Thank you for taking the time.
BeyondEdge
Your Edge Is Your Perception. Go Beyond.

Its A TRAP!!!The market should finish Intermediate Wave 4 today, possibly in the morning before we head down again to Groundhog Day. My models have the most agreement around 4436 for the top so that is my conservative top for now. Wave 5 still needs to take us below Intermediate Wave 3's bottom of 4222.62. Earliest guess is a bottom south of 4100 and relatively quick. I will readjust once wave 4 data is finalized.
Great news for most of February as it is rally time. But the rally will be short-lived. Earliest forecasts are gains around 11% off the bottom but this could change. We have one more major fall set for end of February and most of March. After that we will work back toward all-time highs.
Regarding the gap this morning is Fed-hype, maybe hoping the "jobs data" will delay the Fed's action. But reality will set in after the meeting that inflation is out of control, hence the drop to end this month. Then short-term memory will forget the last month as large company earnings trickle out in February which likely paints a semi-rosier picture than what we had from the inflation fears. Inflation is here to stay, the new prices we pay today WILL BE the lowest prices we pay from here on. Businesses will not slash prices once people are accustomed to paying them and the businesses are complacent with the profits.

BTC expected movement according Elliot waves strategy i falling in love with Elliot waves
i expected this waves as next BTC price move.

XAUUSD Elliot Wave Forecast - ZigzagPlease see linked idea below.
A wave 2 correction is typically in the form of a Zigzag (5-3-5) thus the final Wave C subdivision should consist of a 5 wave structure as depicted in the chart.
Sub division breakdown:
Wave (3) was shorter in length from Wave (1) which indicates that the final Wave (5) will be shorter than Wave (3).
There is a possibility that Wave (4) is not yet complete and could further extend lower than today's low towards 1824. A move above 1843.24 will rule this out.
I hope you found this useful, do leave your thoughts in a comment below. As always, a 'like' and 'follow' provides encouragement to share further ideas.
Thank you for taking the time.
BeyondEdge
Your Edge Is Your Perception. Go Beyond.

MSFT flat correctionElliott wave analysis view for MSFT suggests the decline from November 22, 2021 high is unfolding as a flat correction.
It turned out to be quite an interesting structure. Down from November 22 ATH wave (w) ended at 328.2 as simple ZZ, and rally in wave (x) is expanded flat ended at 343.86 (as we know each reactionary wave, labeled X, can take the shape of any corrective pattern). Wave (y) is ZZ and ended at 317.2. So we have complete WXY combination as a part of wave of flat. Rally in wave ended at 344.3 with internal subdivision as a ZZ. Final leg wave ended at 300.63 as ending diagonal and it has extension 1.272 from wave .
In terms of technical analysis, we have a price stop near the strong level of 305 and a good demand zone from 300.. There is also convergence of price and RSI indicator.
I can assume that wave 4 has probably ended and the formation of sub-waves of the 5th wave will soon begin.

Difference between ABC and WXY Elliott Corrective WavesElliott Wave Principle , developed by Ralph Nelson Elliott, proposes that the seemingly chaotic behaviour of the different financial markets isn’t actually chaotic. In fact the markets moves in predictable, repetitive cycles or waves and can be measured and forecast using Fibonacci numbers. Elliott wave predicts that the prices of the traded financial instrument will evolve in waves: five impulsive waves and three corrective waves.
This educational article aims to present only the difference between ABC and WXY corrective waves and will not cover other wave paterns (triangle corrective waves , or any of the impulsive (motive) wave structures)
Both ABC and WXY corrective waves are patterns made of 3 waves (swings) corrective structure and this similarity mostly confuses practitioners while labeling. The main difference between the two is in the internal subdivision of the waves (legs)
Each pattern has its own rules, where ABC could be
- a ZigZag patern that have 5-3-5 internal stracture
- a Flat (Regular, Running or Expanded Flat) patern that have 3-3-5 internal stracture
while WXY patern is made of 3-3-3 internal stracture. WXY is combination of two corrective patterns , hence often called as a double three or a double correction. Each wave W, X or Y could have almost any corrective structures (double three, triple three, zigzag, flat, triangle (wave W can’t be a triangle structure), or any complex combinations)
WXY is also know as 7 swing stracture even it is made of 3-3-3 internal swings, the X-wave is considered as a connector wave because it binds two corrective waves and is counted as 1, W and Y waves are counted as 3 and hence 7 swings
WXYXZ is combination of three corrective patterns, hence often called as a triple three, a triple correction or 11 swing, WXY rules applies also for WXYXZ
Tips :
An elliott wave practitioner in general may assume a trend continuation once an ABC correction is completed. In todays market complex corrections are more common than simple corrections, the markets are in a correction phase nearly %70-%80 of the time. Hence, once an ABC correction is completed a trend continuation failure must be considered in the trading plan and in fact, this failure is the main characteristic of the X-wave, a trend that has failed. Once X wave is completed another corrective structures is to be expected
live examples (not financial advice, just experimental analysis)
GOLD
BTC
Below is a link to Elliott Wave Oscillator study, where the "EWO with Signals" indicator helps traders to track the waves (in lower degrees). It provides insight to traders to observe when an existing wave ends and when a new one begins

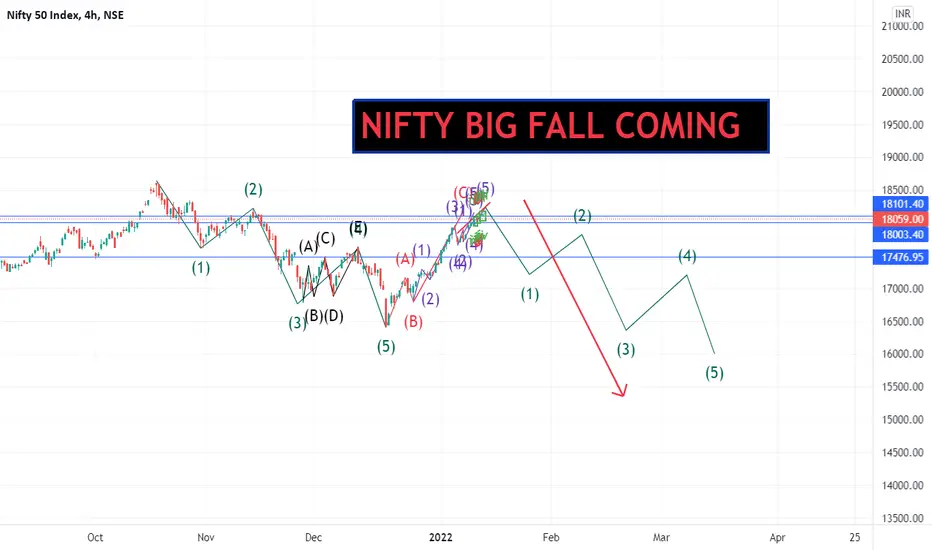
Nifty Big Fall of 2022Nifty is about to made its B wave of ZIGZAG pattern . post completing this pattern nifty will fall for 2000 points till feb expiry . Plz find below level .
this is Nifty spot price .
Short here - 18100-18165
tgt - 16000 till feb expiry
sl - 18200-250
Correction wave on Total Crypto Market Capacity.After past month's Bearish Momentum, we can see Bulls trying to regain their spot.
As Elliot wave Analysis shows:
- Wave A starting from 2.87Trillion on 10 Nov. and ending at 1.93 trillion on 3 Dec.
- Wave B is in Progress in which we could see sub wave a and sub wave b Being terminated (ended) , and we are in progress of sub wave c (last sub wave of wave B) .
Sub wave C target is 2.56T area and 2.74T area.
If My Analysis is right, we could see a rejection at such levels area, which coincides with 61.8% and 78.6% Fibonacci levels of Impulsive Wave A
- Wave C (Last wave of correction) once it starts to progress, could find its target at 1.53Trillion level area, just before we start a new Bull cycle on Cypto Currencies where we would see ultimate new highs On BTC, Eth, etc...

CADJPYLooks like we have broken the trend and head and shoulder pattern , as per elliott wave we are in b wave so i feel we will get crash on cadjpy

SHORT MATIC USDT | Elliott Correction WaveShort MATIC USDT
As you see we could enter in the third wave of the Elliott Corrective Pattern.
It is often see as a bull trap as people thinks the bull trend is still healthy. However, the price could fall if the price is following the Elliott Wave Pattern.
Entry Price: 2.544
✔️ Target Profit: 2.265
❌ Stop Loss: 2.637
Potential Profit: 11%
Ratio Risk / Reward: 3
You may enter this position as a margin position for increasing the profit as the Ratio Risk / Reward is low. That's up to you.
I am also curious to earing your opinion too.
Should you feel that analysis helps you, feel free to leave a like, and I wish you a good day!

Bank Nifty 28 Dec Elliot Wave AnalysisHello Traders ,
as We can clearly see there is a mirror pattern is forming in BNF Chart and according to this we can see 1000 Point down Move . Let see in coming session and check whether
it Will complete Mirror Pattern or not ,
if yes ,
then it will give down move of 1000 poin in BNF

LUNAUSDT | LUNA / USDT | Elliott Wave PatternWe might have here a perfect example of Elliott Wave Pattern.
It offers us 2 positions.
Firstly, a Short Position in order to take advantage of the corrective Wave D.
Secondly, a Long Position that might offers us some profit as well.
Nothing is sure; however, the Elliott Wave Pattern seems appear in this chart.

SHORT ADAUSDT | SHORT ADA / USDTElliott Wave Correction
Price Entry: 1.464
Target Profit: 1.390
Stop Loss: 1.484
Risk Ratio: 3.75

XAUUSD - Elliott Wave Rules & Guidelines of Wave FormationThis publication will focus on some of the rules and guidelines of wave formation in Elliot Wave theory in relation to the correctional sequences of Wave 4 and zigzags.
Whilst Elliott Wave rules are requirements and form the basis of counting waves, understanding the guidelines of wave formation is as crucial in identifying wave structure and the likely scenarios that could unfold. Guidelines are not the same as hard and fast rules that cannot be broken, they are not always observed. However, they have proven to be very reliable over time.
Alternation guidelines within an impulse dictate that; Wave 4 has a tendency to differentiate both in depth and form, from the previous Wave 2 of the same degree. Often trending sideways for the final Wave 5 to breakout from impulsively.
Whilst a more common formation for Wave 4, the simple sideways correction (flat structure) formed as a Wave 2 between from July 2016- August 2018. Keeping in mind the alternation guideline of wave formation highlighted above, the potential for Wave 4 to play out as the alternate, more complex sharp correction is highly probable.
Having reached the current ATH in August 2020, the ensuing correctional Wave 4 played out an initial Wave A which had a sub-division of 5 waves. This further enhanced the likelihood of Wave 4 being a zigzag correction consisting of the following rules.
Rules for Zigzag (5-3-5)
• Zigzag is a corrective 3 waves structure (ABC)
• Sub-division of Wave A and C is 5 waves
• Wave B can be any corrective structure
• Wave B of a zigzag never moves beyond the origin of Wave A.
•Wave B of a zigzag always subdivides into a zigzag, flat, triangle, or combination of the three.
Wave B failed to surpass the origin of Wave A and in doing so respecting the following rule; Wave B never moves beyond the origin of Wave A.
This added further confluence to the correctional sequence being identified as a zigzag and we can assume that there is a higher probability that Wave C will end with going beyond the completion of Wave A according to the following guideline; Wave C of a zigzag will often end beyond the pivot of wave A. Although truncation cannot be ruled out entirely.
Another guideline which is important to note here is of the guidelines for channeling. One particular guideline states that; Wave C in a zigzag will often end at the projected trendline of the parallel channel. The obstacle here being the trendline of the larger degree channel. For this reason, it is my personal opinion that the wave C will not meet the trendline of its parallel channel. Rather, ending at the trendline of the larger degree.
In any case, both scenarios are possible as a further channel guideline accommodates the possibility of a throw-under; a possible throw-under could also occur with wave 4 falling below the trendline. This would allow for Wave C to end at the trendline of the larger degree channel. Although this would mean that the completion of Wave C will need to be much sharper and a significant throw-under which is less likely to occur. For this reason, I should think the guideline of Wave C ending beyond Wave A to be sufficient.
The guidelines covered above aren’t exhaustive, those highlighted are for the purpose of this analysis. I hope you have found the above information educational. Please remember that Elliot Waves are most effective for the long term analysis of markets and one should not make any trading decisions based on this theory unless they fully understand it.
If you found this helpful, I would most appreciate it if you would like the publication and leave a comment. You are most welcome to follow if you are interested in reading further publications/ideas of a similar nature. A breakdown of the lower degree wave counts will be published soon.
Thank you for taking the time.
BeyondEdge

BTCUSDT As long as bitcoin holds above 39k dollars , we will see 55k and 58k , in upcoming days or weeks
AAPL Looking at a dip before the last leg upAAPL looking to retest demand zone in a wave 4 drop before heading upward to complete the 5th wave. This is just for education purposes only, you are responsible for whatever action you take based on this information.
