Elliott Wave View: Downside Pressure in USDJPYhort Term Elliott Wave is calling for an impulsive move in USDJPY from April 25, 2019 peak. Down from 112.4, wave ((i)) ended at 111.36 and wave ((ii)) ended at 112.03. Wave ((iii)) ended at 109.44, and wave ((iv)) ended at 110.05. Internal of wave ((iii)) subdivides also as an impulse of lesser degree. Down from 112.03, Wave (i) of ((iii)) ended at 111.02, wave (ii) of ((iii)) ended at 111.7. Wave (iii) of ((iii)) ended at 110.27, wave (iv) of ((iii)) ended at 110.96, and wave (v) of ((iii)) ended at 109.44.
Bounce in wave ((iv)) ended at 110.05 as a zigzag structure. Below from there it made a new low suggesting that wave ((v)) is in progress. While below 110.05 peak it should extend lower.
Elliottwavecorrection

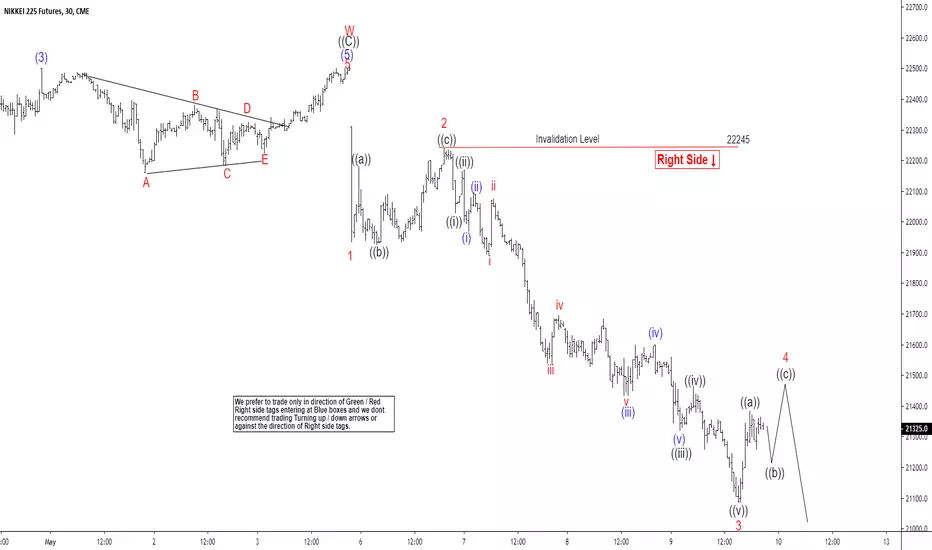
Elliott Wave View: Impulsive Decline in NikkeiOur Elliott Wave view on Nikkei suggests the rally to May 4, 2019 high (22505) ended wave w. This ended cycle from December 26, 2018 low and the Index is in the process of at least doing a larger 3 waves pullback. Short Term, decline in Nikkei from May 4, 2019 high is unfolding as an Elliott Wave impulse structure. Down from 22505, wave 1 ended at 21935 and wave 2 ended at 22245. Wave 3 ended at 21080 low.
Expect wave 4 bounce to fail in 3, 7, or 11 swing as far as wave 2 pivot at 22245 stays intact. Possible target for wave 4 is 23.6 – 38.2 retracement of wave 3 at 21539 – 21672. Alternatively, Index can end the entire 5 waves from May 4, 2019 high already. In this case, it should do a larger 3 waves bounce to correct the cycle from May 4 high before the decline resumes. We don’t like buying the Index and expect further downside in the Index to complete a 5 waves down.
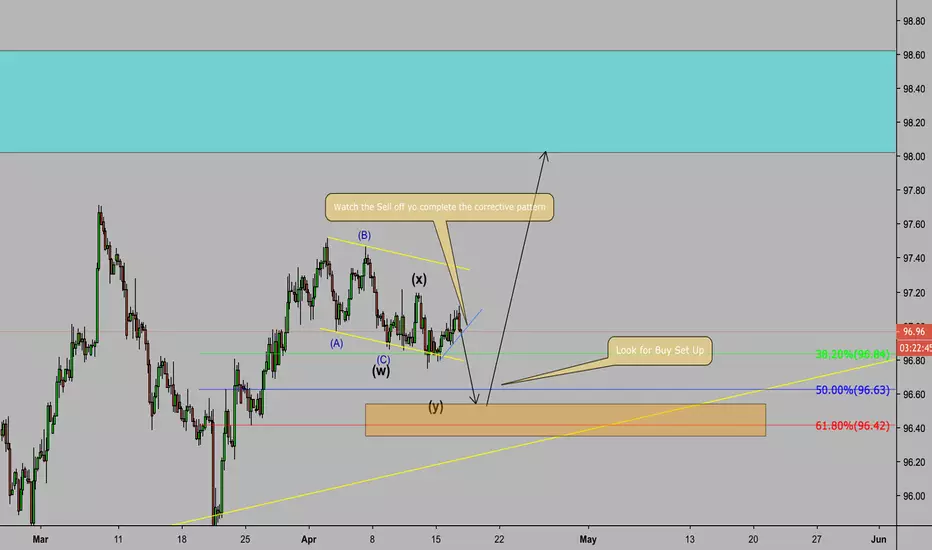
USD/CAD WAVE ANALYSIS POTENTIAL BUY SET UPWatch for price to push higher towards the Blue box if we break through the orange box which is a supply zone. I believe we have a completed 3 wave structure as well and we are gearing up for a Impulsive Bullish wave

NZD/USD gets direction change in my technical sight Hello traders,
Last update for NZD/USD on March 27th, 2019 was a while ago and the target has been hit yesterday:
Currently NZD/USD is trading at around 0.6583 handle and probably the support zone for Kiwi has been founding here to end its C leg in minor degree flat correction. A change of direction is now expected to see in the coming time, but to be convinced of a change thereof, I think from above the price level of 0.6707x will be considered .
Happy trading!

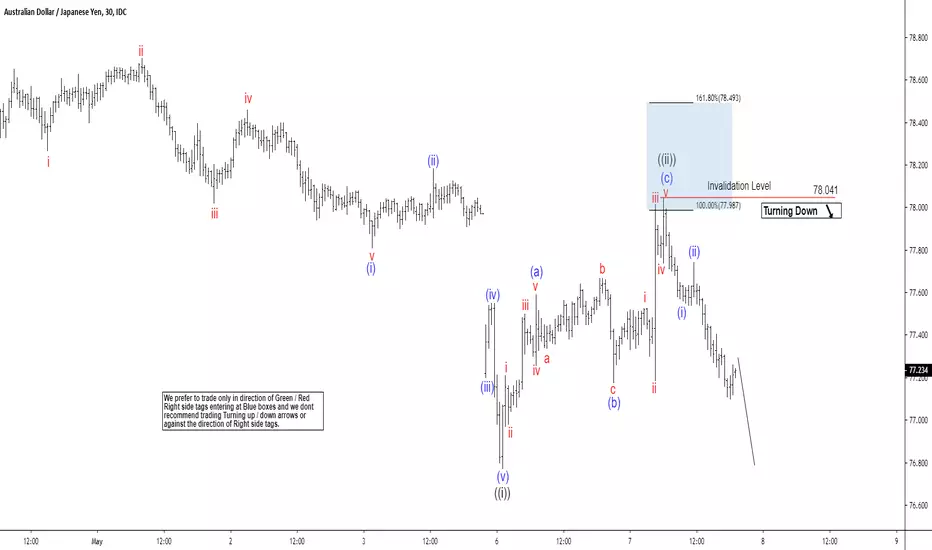
Elliott Wave View Expecting AUDJPY to Extend LowerAUDJPY shows an incomplete Elliott Wave sequence from April 17, 2019 high, favoring more downside. The 100% target can reach as low as 75.7 – 76.3. In the chart below, the bounce to 78.94 ended wave 2. Wave 3 is currently unfolding as an Elliott Wave impulse with wave ((i)) of 3 ended at 76.77. The internal of wave ((i)) subdivided as another impulse structure of lesser degree. Wave (i) of ((i)) ended at 77.81 and wave (ii) of ((i)) ended at 78.18. Down from there, wave (iii) of ((i)) ended at 76.96, wave (iv) of ((i)) ended at 77.55, and wave (v) of ((i)) ended at 76.77.
Wave ((ii)) ended at the blue box area (78.041). We don’t like buying the pair and like to stay short from the blue box area with a risk free position. As long as it stays below 78.041 peak it is expected to extend lower.
GBPUSD Ride the WaveGBPUSD is showing signs of an Elliot wave in progress. Giving strong bullish indication with the trend break and retest also.

NZDUSD 4h Expanding flat completeNZDUSD is coming towards the end of 4h expanding flat corrective structure.
Look for buys for next impulsive leg up

AUDUSD - buy at the lows. 4hAUDUSD is making expanding flat pattern, look for buys on the break lows of the next impulse up.

EURUSD 1D possible Running flat in the makingEURUSD on the daily chart is currently making running flat corrective pattern.
Currently its starting the C wave, look for longs on pullbacks

XVG LONG (BULLISH GARTLEY & TRUNCATED CORRECTIVE C WAVE)XVG is standing right above the Bullish Gartley's Stop Loss Zone, still in the Potential Reversal Zone. It is coming this major trendline ; Elliott Wave count with the help of RSI makes me think that XVG finally bottomed with a truncated 5th wave.
Let's note that RSI has also a Bullish Convergence.
Good trade and good luck everyone,
Zakaidze Omar

BTC - Complete bear market countBTC count for the current bear market.
I believe we have just put in the A wave of the largest degree and should be expecting slow, choppy uptrend for most of this year.
Followed by the final leg down to sub 1k.

Sell stop before corrective wave 3Recently due to the news from EU euro wenr down. Now we can see a corrective Elliote Wave, where wave 1 is already done, wave 2 is in progress, so we have a reason to wait for the wave 3 down. In addition, there will be some news about EU at Monday, so it's highly likely we'll see another strong wave down. I suggest to put a buy stop order under the end of wave 1.

US Dollar Index Wave Analysis Two Trade Set UpsThe US Dollar Index is looking to make a bearish push to the orange box to finish the complex W-X-Y corrective structure. After the corrective structure is finished look for the Buy set up for the Dollar to make higher highs in the Bullish tremd
Bitcoin Full Elliot Wave Analysis (BTC)Bitcoin long term analysis.
You can see my whole setup from the all time high. It might be too chaotic and messy to see, sorry for that. But if you know Elliot wave count, I do not think there will be a problem.
After the all time high I suppose WXYXZ full correction happened. Before finishing the Z wave $6100 area was holding the price very long time, but when it break the support with triangle correction patter it made a huge dump to $3200. For me, Bitcoin finished its WXYXZ correction on $3200.
Recently it broke the resistance line and huge spike has occured. I see it as impulsive wave and need a decent correction to enter long position. It might be the start of the next huge movement, but need the break $6100 area, previous support, as confirmation.

GBP/USD Wave Analysis Sell Set UpPrice is completing a corrective structure that I believe to be a triangle structure, look for price to have a sell of completing the bigger corrective structure finishing in the blue box.

Elliott Wave View: Nikkei Still Missing Wave 5Short Term Elliott Wave view on Nikkei Futures suggests the pullback to 20704 ended wave (2). The Index then resumed higher in wave (3) which ended at 21985. The internal of wave (3) subdivided as an impulse Elliott Wave structure. Up from 20704, wave 1 ended at 21415, wave 2 ended at 20985, wave 3 ended at 21765, wave 4 ended at 21490, and wave 5 of (3) ended at 21985. We can also see the internal of wave 1, 3, and 5 all subdivide as an impulse (5 waves) of lesser degree. This is an illustration of fractal within Elliott Wave where each wave consists of smaller waves and the pattern repeats indefinitely.
Wave (4) dips appears complete after a 3 waves pullback ended at 21588+ blue box area. The internal of wave (4) unfolded as a zigzag Elliott Wave structure where wave A ended at 21735, wave B ended at 21835, and wave C ended at 21565. At this stage, Nikkei still needs to break above wave (3) at 21985 to avoid a double correction in wave (4). While dips continue to stay above wave (2) low at 20704, expect Index to extend higher in wave (5). If bounce from the blue box fails to break above (3) high and it breaks the recent low, then structure of wave (4) should become a double three Elliott Wave structure and would be labelled as WXY. We would be able to define the next blue box area for a bounce if the bounce does fail and breaks the recent low.


NEOUSD - 1H setting up for a rally NEOUSD is looking to rally hard while BTC and majors like LTC , EOS , and ETH continue to consolidate.
Look for buy for upside.

RLC/BTC 4h flag for buyRLC/BTC is ready to start making the next impulsive leg in its cycle.
4H is making a nice flag for more upside.

CRON - 4h buy for C waveCron is making flat pattern.
Looking like good buy for the C wave before more downside continuation.


