USD/JPY Elliot Wave Analysis Watch for price to breakout of the corrective channel for a buy set up to finish the Flat correction then the sell set up after the structure is complete
Elliottwavecorrection


Elliot Wave Analysis USD/JPY Corrective Wave Structure ExplainedWatch as I explain some basic Elliot Wave Concepts of Corrective Formations and anticipating the next waves. I Also breaks down the idea of an IF-Then-Thought-Process using Elliot Wave and reacting to price.

IYR Elliott Wave Analysis: Pullback can Provide Buying ChanceHello Traders,
In this Elliott Wave Analysis, we will have a look at the Real Estate ETF (IYR).
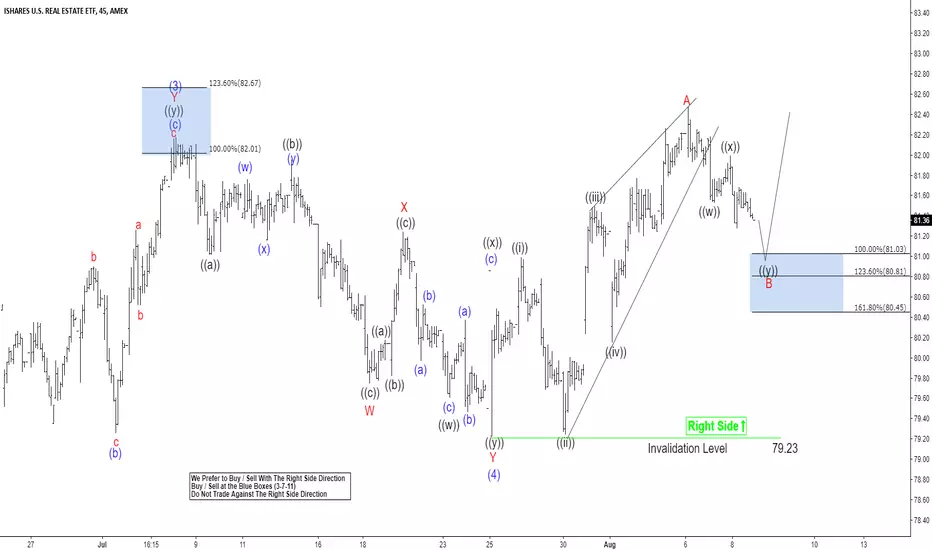
IYR ended the cycle from 03/23/18 (72.71) low at the peak of 07/06/18 (82.20) in blue wave (3). Below from there, the ETF ended the correction from 07/06/18 (82.20) peak in blue wave (4) at 79.23 low. Up from there, it broke already to new highs, confirming that the next extension higher has started.
Near-term IYR ended the correction from 07/06/18 (82.20) peak in blue wave (4) at 79.23 low. The internals of blue wave (4) unfolded as Elliott Wave double correction which ended red wave W at 07/18/18 low (79.76), red wave X pullback at 07/19/18 peak (81.26) and red wave Y of blue wave (4) at 07/25/18 (79.23).
Up from there, the ETF ended the cycle from 07/25/18 low in red wave A at 08/06/18 (82.50) peak. The internals of that move unfolded as a leading diagonal where it ended black wave ((i)) at 07/26/18 low (81.01), black wave ((ii)) pullback at 07/30/18 low (79.24), black wave ((iii)) at 07/31/18 peak (81.51), black wave ((iv)) at 08/01/18 low (80.15) and finally black wave ((v)) of red wave A at 08/06/18 peak (82.50). The ETF is currently in the progress of correcting the cycle from 07/25/18 low (79.23) in 3-7 or 11 swings in red wave B.
Near-term focus remains towards 81.03-80.81, which is 100%-123.6% Fibonacci extension area of black wave ((w))-((x)) to end red wave B pullback. Afterwards, the ETF is expected to find buyers for red wave B higher ideally or should do a 3 waves reaction higher at least. We don’t like selling it into a proposed pullback as the right side remains to the upside.
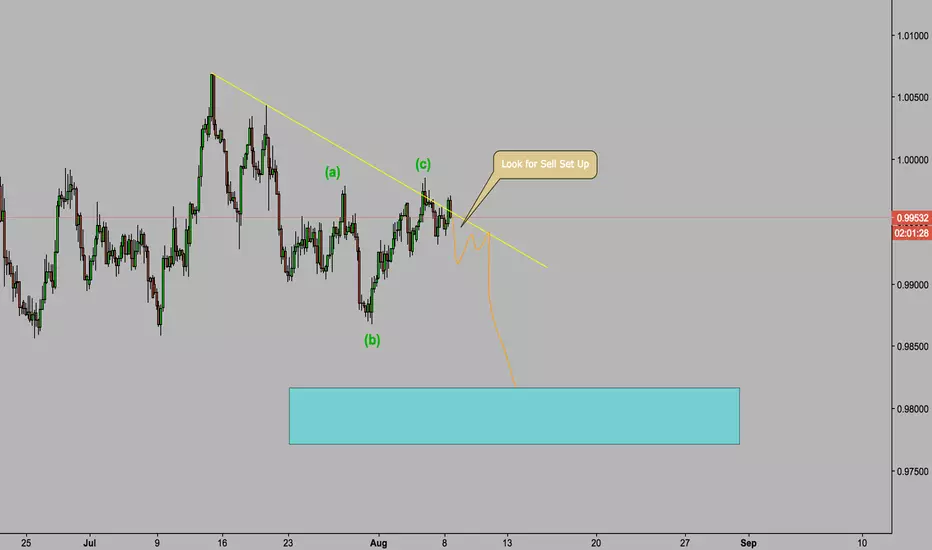
Elliot Wave USD/CHF Potential Sell Set UpI believe price have completed an Flat correction now watch for an impulse to the downside then a correction to get Short.
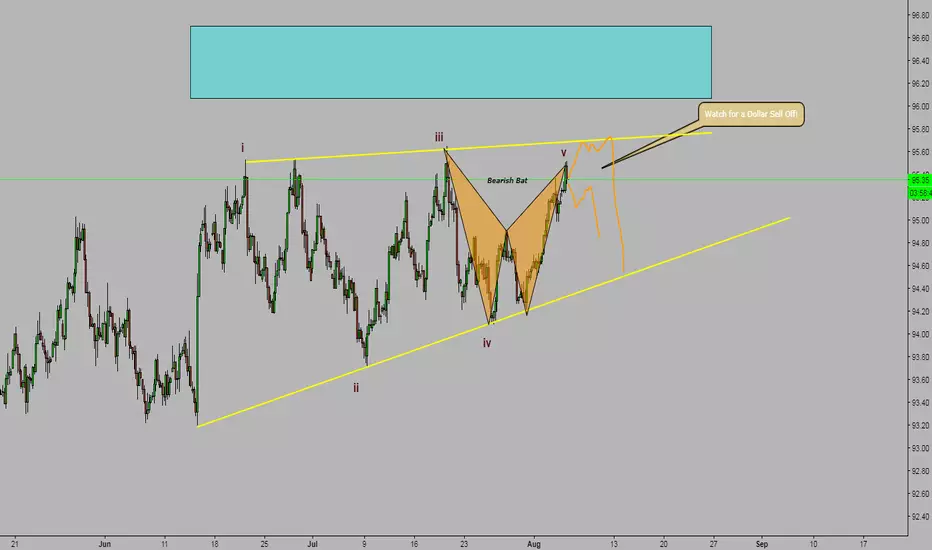
Elliot Wave DXY Dollar Sell off Set Up Ending DiagonalThere is a strong possibility that we will see a US Dollar Sell off. We have a completed Bearish Bat and price is at a strong level of Supply. Also price is taking the shape of an Ending Diagonal Elliot Wave formation. I am getting out of my long positions where I have been buying the Dollar. Watch for this set up!

BTC Zigag correction. Looking to long between 0.5 and 0.618 fibBitcoin primary count is a standard ZigZag correction (5,3,5). Be ready for a sharp reversal if we get to 0.5 and 0.618 fibs. I'm going long there.

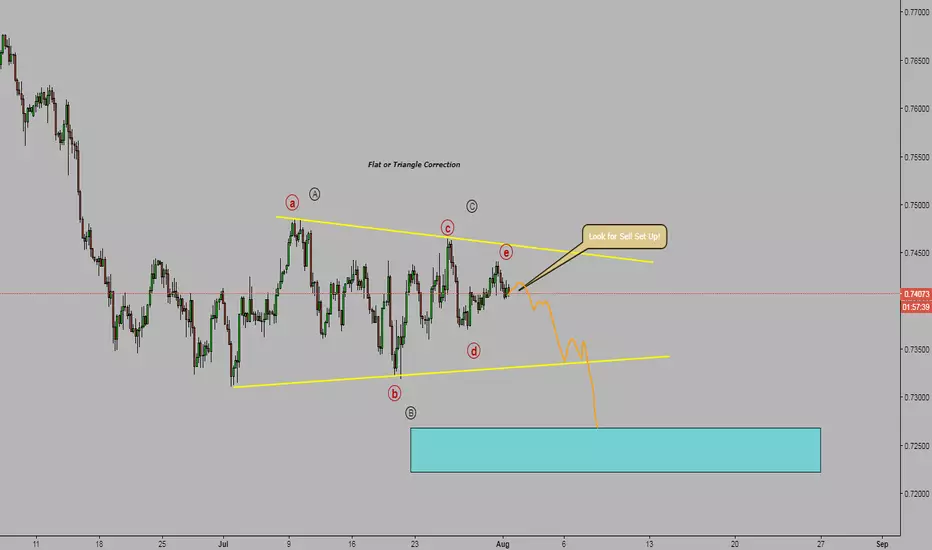
AUD/USD Sell Set Up Corrective Structure Triangle or FlatLook for price to make an impulsive move to the downside then a correction to get short. I believe price is near the end of forming a correction structure that has taken the shape of a Triangle of Flat, Both will point price to move lower
USD/CHF Wave Analysis Buy Set UpWatch for USD/CHF to finish the corrective structure which I believe is a running flat. Look for an impulse then a correction to get long and ride the wave up

EUR/USD Wave Analysis Sell Set UpEUR/USD have been forming a corrective structure. We could be near the end of the scorrection which I believe is a Triangle. Watch for an impulse to the downside then a correction to get short.


Short and Long We have a pattern of 5 complete waves, which in turn form wave 1 of greater degree, now we are in correction a-b,
once the c wave is finished, ideally in 78.6 a perfect Cypher pattern will be formed that will give us a more confirmed entry for wave 2 of greater degree..
also we have 2 magnets in 78.6 level that must be closed

EUR/CAD Wave Analysis Watch For The Sell!Price could climb higher a little finishing a corrective formation before the big drop. Watch for the Set Up!

Correction almost doneSome people didn't think a correction was possible. But here we are, couple of days later, and bitcoin made a much needed and healthy correction so far.
It seems we are currently working on the 5 of the C wave which could end around the 61.8% fib levels. That would be nicely above wave 1 , so valid according to Elliott rules
I will be looking to long when 4 is in and 5 seems to be starting

GBPNZD potentially finished running flat pattern, going up!GBPNZD running flat appears to be done and coiled to move higher but time will tell.

EURUSD short term consolidation break-out Eur/Usd is still in this sideways movement but currently taking shape of a more complex pattern.
Within this pattern I am taking a counter-trend move of buying EUR/USD to about 1.1820 area. I will then be looking to flip my position and play other direction.

WTI (CRUDEOIL) – Target: 88 USD!Hello,
looking for a longtrade?
WTI is good looking at the moment: seems to be a perfect entry-point for a longtrade with target about 88 USD.
In my opinion now there‘s an ideal 1-2 Elliott-Wave-Setup on the WTI-Chart with a double low. This indicates that wave 2 (blue in brackets) is already completed.
WTI most likely is in an intact upward trend in the middle of wave 3 of a higher wave level (purple in brackets, as shown in the charts above and beleow):
Take care,
tgo

Elliott Wave Analysis: Amazon May Start Another Extension HigherHello Traders,
Let's have a look at the Amazon 1 hour chart.
Short-term Elliott wave analysis suggests that pullback to $1646.48 low ended blue wave (2). Above from there, the stock is rallying higher in blue wave (3). The internals of that extension higher is unfolding as Elliott wave impulse structure with sub-division of 5 waves.
Above from $1646.48 low, the rally to $1858.88 high ended red wave 1. The internals of that rally higher took place in another 5 waves impulse sequence in lesser degree cycles. The first leg of a rally to $1725 high ended black wave ((i)) as Leading diagonal structure. Then the pullback to $1682.15 low ended black wave ((ii)) pullback as a Zigzag correction. Up from there, the rally higher to $1841.95 ended black wave ((iii)) in 5 waves. black wave ((iv)) pullback ended at $1791 low, and black wave ((v)) of red wave 1 ended at $1858.88 high.
Below from there, the stock did a 3 wave pullback in red wave 2, which is proposed to have completed the correction against $1646.48 cycle low. After reaching the blue box 100%-123.6% Fibonacci extension area at $1787.19-$1775.77. However, a break above $1858.88 high remains to be seen to validate this view & until then, a double correction lower in red wave 2 can’t be completely ruled out. Near-term, while dips remain above $1769.99 low and more importantly above $1646.48 low the stock is expected to resume the upside. We don’t like selling it and the right side remains to the upside.

AUDUSD complex pattern almost complete, short term upside Short-term upside is still needed for the audusd complex correction


EurUsd Daily Elliott Wave Count & Head and ShouldersExpecting Wave (4) to reach minimum target @ 1.1860 before resuming lower.
