Bitcoin #BTCUSD - close to important levelThe nature of downward move is corrective so the main impulsive count is still valid. The level to be observed for today: $ 8,438, i.e. the level invalidating the impulsive growth counter due to the overlap of waves 1 and 4.
Elliottwavecorrection


EOS dropping to support?Looks like EOS is dropping to the support line before starting the final wave of the Elliott wave structure.
After this final wave we will probably see a big correction from the whole structure, potential sell area between 17500 and 20000.
"NOT a financial advisor, seriousness reduces life. Make sure you feel blessed when waking up, millions of people died during their last night sleep."
If you want to donate crypto:
L T C : LgdvQDGv4v4krzdmVmozSopdvcLUbpj3Ye
B T C : 1Dx6c5e4BNaDMtSBp53dWGExYJccxmqc7k
E T H : 0x43e36a719c407285ec3c967857d13e9926771b78
X V G : DFT1FpC1d9MBHfFB7M4UPjorQEfJuFQEoh

LTC correcting from Elliott wave structureLTC is currently correcting from the Elliott wave structure prob till 0.5 or 0.65 fib lvl and is forming a downward channel.
After correction I think we are going to see the 3th wave of the bigger Elliott wave structure that it is forming.
NOT a financial advisor, seriousness reduces life. Make sure you feel blessed when waking up, millions of people died during their last night sleep.
If you want to donate crypto:
L T C : LgdvQDGv4v4krzdmVmozSopdvcLUbpj3Ye
B T C : 1Dx6c5e4BNaDMtSBp53dWGExYJccxmqc7k
E T H : 0x43e36a719c407285ec3c967857d13e9926771b78
X V G : DFT1FpC1d9MBHfFB7M4UPjorQEfJuFQEoh

$BTCUSD end of C wave on the 1D? Practicing my Elliot Wave counts/analysis. Looks like we are at the end of C corrective wave. This as I understand it usually signal a BUY. My counts could be off as I am still learning. I welcome any corrective criticism. Go well. (-_-)

Big Time Frames Simplify everythingThis is a monthly chart. For all the trauma that BTC induces this makes everything seem so simple. I included the fibs just to help give a better idea

Why We Look At Log Scale!For waves that occur over long periods of time looking at a normal arithmetic price scale lacks the ability to normalize exponential growth. Under these circumstances, by looking at the logarithmic scale we see a different perspective on how price has been moving. This also makes it easier to plot waves.
___________________________________________________
Here's the analysis
on the largest scale, it seems to me that BTC just completed wave 3, which makes sense the growth was ridiculous during this wave
By that same token, our current correction seems relatively small in relation to the entire graph which still makes me believe that wave 4 is not yet completed
Finally, this also means that we will be beginning wave 5 upon completing our correction and ideally we should see another hefty move up
____________________________________________________
*Warning*
IF this is right then when we finish this next wave we will have completed an entire 5 wave cycle and it would be followed by a massive correction

The Correction is just getting started
Starting from the last significant correction that BTC had, we moved up for over 2.5 years so my assumption is that a 4-month correction is relatively short. Instead, it wouldn't be absurd to assume that we are far from finishing this correction. With that being said in terms of Elliott waves, this correction has already retraced a significant portion of the move up making it unlikely that we are in a flat or triangle correction. The only thing left would be a zig zag correction which plays out as a (5-3-5). From what I can see we are nearing the end of wave 5 within A and B should be starting soon. In the chart, I have 2 possible end-points for wave 5 one of which is around 4500. Then by looking at the channel we have a decent idea of when this wave should finish playing out

Euro/Yen Bullish Triangle CorrectionAfter the bullish 5 wave pattern,
it looks a little bit like a
corrective triangle pattern
has begun to form.
D Wave.
With the completion of
a double top pattern
at the 136 zone,
the D wave of
the triangle pattern
will have met its
61.8% Fib Level requirement
along the triangle trendline.
E Wave
The location of the projected
61.8% retracement from the
D Wave endpoint seems logical
because that is where price
can be expected to run out of
momentum
Only time will tell

What Is Corn Up ToOn a bigger timeframe, it looks like we are forming a Contracting Triangle. These will generally have a .618 relationship with one pair of internal waves or more. Currently, we have already had the relationship occur once, meaning that it doesn't HAVE to happen again. However, assuming that it does we have a good idea of where things are headed. I Included another wave of a higher degree to give a better frame of reference as to where we are. Let me know what you guys think


XVGBTC - The verge Surge!Verge is exploding once more. The cause is an announcement to be made on April 17th. The golden rule of announcements calls: Buy
the rumour, sell the news.
Technical indicators on the 4 hour chart:
- Bullish MACD
- Bullish OBV, confirming buying volume
- Overbought RSI
I am showing the 30 minute chart because Verge is now consolidating in a perfect triangular pattern. Buy when this pattern is broken upwards.

Bitcoin #BTCUSD - the last chance for bulls?The previous impulsive scenario has been invalidated due to the wave (2) and wave (1) overlap. The current scenario is still bullish, but this look like a last chance for bulls to do their thing, otherwise the bears will push the market below $5,820 support in a no time.

One more leg up for a potential wave 4I see a last impulsive wave going down once the correction is finished.
Right now we have two clear waves making 3 curves.
Corrective target: 7140 to 7450 (0.236 & .382 fibos)
Two options:
A 5 wave structure to finish to make a 3-3-5 zig zag corrective pattern
or some side range action, triangles of 3-3-3-3.

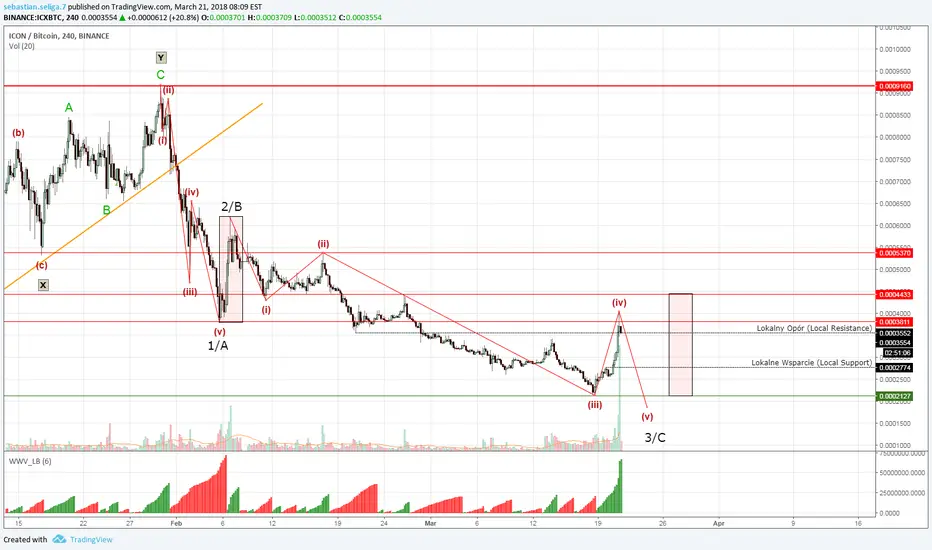
ICON #ICX - there is something missing here...According to the newest Elliott Wave Analysis of this relatively interesting cryptocurrency is now rallying higher on a high volume, but there is still missing the fifth wave to the downside. When the last wave down is made, then there will be a potential for another leg up, but fore now cautious is advised on the way up.

CADJPY - Elliott Wave counting - Forecast for a correction wave Hi followers,
look on the daily chart to find my counting for CADJPY.
I believe there will be in next time a correction wave.

USDJPY - Elliott Wave shows end of long correction and buysignalHi followers,
with the counts of Elliott waves it seems that USDJPY has enough of the correction W-X-Y.
Now you have a very good signal to go long with USDJPY. The channel, the w-x-y correction built, reach the bottom and can broke the upper line in the future.
Have a good trade!

Candidate Bullish Contracting Triangle on BTCUSD, 1DBTC loves a triangle: EW analysis of BTCUSD pair reveals a candidate bullish contracting triangle. Currently, I have a sell target @ $9500 on approx. 27th March and a subsequent buy target @ $8000 on approx. 3rd April.

Top of Wave 1 to 2, including targets for wave 2 and 3Well first two targets got hit pretty well. RSI, Vol, MACD and EMA 55 show us, that we hit the Top of wave 1 and are on a way down to 2.
Target of the wave could be between 0.382 and 0.5 Fib Ret.
I got my buy-orders stacked between 8000 and 8100. Target see on Chart.
Bulls and bears are still fighting on the way down, we might retarced higher and wave 2 might be shorter, anyway I shorted and wait for new signals.
As always: This is a hobby for me. I improve fast, keep on learning and reading. Feedback and ideas are always welcome!
I am not a financial adviser, please do your own research and let me know if we agree on targets and so on. I need people who correct me, tell me why and what if I analysed something wrong.
Thank you! :)

ABC correction with H&S pattern ?ETH/BTC looks for a correction.
I think a correction to 0.065 area is possible before the next run to new high.
BTC/USD is still in bearish cloud even if there was a strong rebounce as expected at 9k, so i'll would be prudent about holding ETH in the comings days.
As always, it's only my opinion. I'm not a financial advisor.

BTC Double Three for wave 4 of this diagonal?We appear to be moving in a double three for this 4th wave correction. Looks like it might continue up to ~8300 before turning back down.

XLM ELLIOTT TRIANGLE WAVE, FLAG POLE & MEASURED MOVE5 wave elliott corrective wave triangle formed with volume confirmation for pending breakout.
measured flag & pole suggests a move towards $10
it should not be long before the pattern breaks to a new direction.
