BITCOIN #BTCUSD Two possible scenarios!We are going to wait a few days in this triangle and we will go either way, i personally think that btc 1.33% will go to set new highs. The volume is getting smaller among the sails, that indicates a possible volatility as BTC has shown us, in turn shortening the space of our ascending triangle, meanwhile you can trade a bit inside the triangle but be careful.
Important levels:
- for further increases - the level of $ 17000 and until psychological barrier
- for continuing correction - the level of $ 16,750 and later $ 14,700
- for the continuation of declines - the level of $ 14,500 and later $ 12,700 and $ 12000 unil 9000$
Elliottwavecorrection

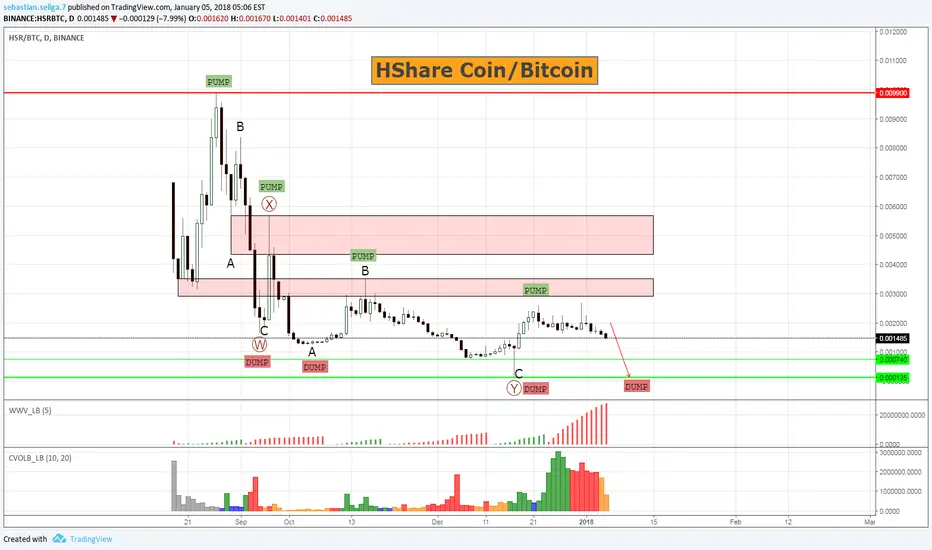
HShareCoin #HSRBTC - another dump in view?TECHNICAL ANALYSIS:
The price of the cryptocurrency HSare Coin quoted to Bitcoin HSRBTC remains on a downward trend, despite an extensive downward adjustment of the Double Triple WXY type correction. It is possible that the market will perform another downward wave, thanks to which the WXY structure will transform into WXYXZ, making all the movement even more complex and stretched over time. Such a scenario would correspond to the next cycle in the PUMP-DUMP scheme, as the price is currently in the DUMP cycle. This is confirmed by the lower lows on the daily time frame chart.
In order for growth to take place, the market would have to first of all reach 0.0030 (first pink zone) and move upwards to 0.0050 (second pink zone). Without such developments, it is difficult to talk about downtrend reversal.
TREND AND IMPORTANT LEVELS:
The main trend: DOWN
Indirect trend: DOWN
Daily trend: DOWN (price at a key level)
Key Levels:
for further increases - level 0.0030 and later 0.0035
for the continuation of drop - the level of 0.000740 and later 0.000135
PS: Please add me to the watched ones!
PPS: The next analysis of the next cryptocurrency will be published if this post will receive min. 50 likes. :)
complex wave 2 the price is in a big correction complex wave 2 and when eurgbp ended wave2 it will selloff in wave 3 .

XRP Ripple Ready To Launch Anytime From Now. Don't miss it!It appears that XRP is ripe for it's next Elliot wave, after already showing an a,b,c correction pattern, and furthermore tightening into a triangle formation as seen in previous waves. Whether this next wave/spike will occur tomorrow or next week, I am unsure, however I do expect a spike very soon. Thus, this may be a wonderful buying opportunity!
Disclaimer: This is my first idea posted as a beginner analyst. Please share your thoughts and feedback.

Cardano - #ADA - hit another target level!Just as anticipated, the price of Cardano ADABTC has hit the 261% Fibo extension at the level of 0.00009234. This level might be the top for the wave (3) and if this level is the top for this wave, then the corrective cycle in wave (4) should retrace min. 38%, so the next target would be at the level of 0.00006641.
Please notice the wave labeled as (3) might keep going up to the next target projection without any significant corrective cycle, but for now, the move up looks extended and need some pause

Cardano - ADA - at important level!ELLIOTT WAVE PRINCIPLE TECHNICAL ANALYSIS:
The price of Cardano cryptocurrency quoted for Bitcoinia ADABTC was at an important target level, which is at 161% Fibo at 0.000066. This is the typical range of the third internal wave, so the fourth wave is now expected to be adjusted to local support at 0.000059. Nevertheless, the third wave can be further extended to 0.000076 before the fourth wave will start. There is still one more wave to the upside left anyway, wave five, with a target at 0.000092 minimum.
If support is broken at 0.000059, the next support is at 0.000045.
TREND AND IMPORTANT LEVELS:
Main trend: UP
Intermediate trend: UP
Daily trend: UP (price at a key level)
Key levels:
- for further increases - 0.000066 and later 0.000076
- for continuation of correction - level 0.000066 and later 0.000059
- for the continuation of decreases - the level 0.000045
PS: Be sure to follow me!
PPS: The next analysis of the next cryptocurrency will be published, if this post receives a min. 50 likes. :)

BTC might fall to $9700 according to Elliott's Waves From my analysis we've just finished forming Elliott's wave A , BTC will go a bit bullish from here climbing to wave B, probably to the next major resistance and then going bearish, falling all the way to $9700 to wave C. This is not a financial advice by the way, if this helps u a simple thanks will be appreciated.

XRP completes wave 5 now what ABC do you like before new up moveHey guys,
what do you think about the completion of this 5 -wave up ?
I also have drawn 2 possible ABC retracements into support for the next leg up.
One is short term, the other medium term.
Or do you think we will just keep moving higher from current price?
I am bullish on XRP next target is a quick 3 and then into 5 and 10.
If not expanding out even further faster in 2018

Verge XVG - ready to rally?FUNDAMENTAL BRIEF:
"Verge is a decentralized currency designed for those users who value privacy. It improves the original Bitcoin blockchain using many anonymous-centric networks such as Tor and i2p. Utilizing the multi-argorite extraction, it improves security and ensures a fair distribution of coins for miners. "- this brief description can be found on the official website of the Verge project vergecurrency.com. Verge networks allow almost instantaneous transactions that are virtually undetectable. The Tor network uses many global servers. Each transaction is directed by a large number of such servers, and when the last server completes its operation, each server deletes the information from the previous one. Thanks to this, after the transaction is completed, it is not possible to trace the sender's I.P. address, so its data can not be known. The Tor network guarantees much faster sending and receiving of funds without the slow confirmation of the Bitcoin network.
The developer is under the pseudonym DogeDarkDev behind the Verge project. Coin was put into circulation on 25/10/2014, but until January 2017 it was basically not developed. Only the change in the composition of the developers resulted in the development of the entire project. Their goals and those to be achieved (Road Map - schedule) are presented on the official Verge website.
I believe that the project has considerable potential due to the high level of anonymity it provides and the speed of transaction execution. Nevertheless, this coin can was supplied heavily on the market, and currently it amount to about 13.4 billion, and its maximum amount can reach up to 16,555 billion units. And as you know, usually the more something is on the market, the smaller the unit price.
TECHNICAL ANALYSIS:
The price of Verge XVGBTC cryptocurrency quoted to Bitcoin ended impulsive increases and set the peak at 0.00001977. Since then, the price is in the correction cycle marked on the chart as wave 2. There is a high probability that the inheritance cycle ended at 0.00000765 and now the demand is trying to take control of the market. To achieve this, the level 0.00001371 must be impulsively stamped, and then the price must go towards 0.00001604. In addition, it would be best if the internal trend line (blue) were able to maintain the pressure of supply.
At a smaller time interval it is expected to break the top of the triangle (marked on the graph).
Main trend: UP
Intermediate trend: UP
Daily trend: UP / NEUTRAL (continuation of the correction)
Key levels:
- for further increases - level 0.00001514 and later 0.00001614
- for continuing correction - level 0.00001228 and later 0.00001371
- for the continuation of decreases - the level is 0.0000090
PS: Be sure to FOLLOW ME on TradingView and other social media!
PPS: The next analysis of the next cryptocurrency will be published, if this post receives a min. 100 likes. :)

Ripple still can go higher!Ripple is already the third largest cryptocurrency in the world. It is a technology that allows much cheaper interbank transactions. In just 7 days, Rripple grew by almost 60 percent. Where does this change come from?
Ripple is a technology for bank settlements and financial institutions that allows interaction without a central control center and intermediaries. - This allows them to cut costs as much as possible, which is in a sense a revolution for this sector - explains Brian Evans, head of consulting company BDE Ventures and man No. 7 on the list of the largest market influencers according to "Forbes". At the moment when the transaction parties operate in different currencies, Ripple can also perform a settlement function in the form of a Ripple token (XRP).
Ripple's market capitalization grew from 15 billion to over 60 billion dollars. in just three weeks.
Where did such increases come from? Several industry reports contributed to this. First of all, according to several sources, virtual tokens are to be added to the Coinbase offer - the largest cryptocurrency platform in the US. This may help in popularizing Ripple, although at the moment the Coinbase exchange has not yet confirmed these reports.
Secondly, several large banks in Japan and South Korea recently carried out tests related to the payment using Ripple.
TECHNICAL ANALYSIS:
The price of the Ripple XRPUSD cryptocurrency started like a rocket from level 1.0000 and so far no reason for the upward trend to be reversed. Wave 3 pulse reached the level of 161% Fibo, which is a typical range for this wave, and falls on the level of 1.65. For smaller, internal subwaves, successive target levels are 1.75 - 1.84, however, they will be achieved after wave 4 correction, which may go down to 1.35 before the upward trend continues.
Weekly time frame Elliott Waves Analysis:
Main trend: UP
Intermediate trend: UP
Daily trend: UP/ NEUTRAL (correction pending)
Key levels:
- for further gains - the level of $ 1.65 and later $ 1.75.
- for a continuation of the correction - the level of $ 1.35 and later $ 1.25
- for the continuation of decreases - the level of $ 1.25 and later $ 0.70
PS: Follow me please! :)
PPS: The next analysis of the Ripple cryptocurrencies will be published if this post receives a min. 50 likes. :)
Good luck! :)

EUR/USD Completed Elliot Wave and Began Retracement to the 61.8%EUR/USD Completed Elliot Wave and Began Retracement to the 61.8%

Bitcoin - Triangle correction time?The price of the most popular Bitcoin cryptocurrency rebounded after a fall from last week to the level of $ 16, 416. This level is 61% of the retracement of Fibo of the previous downturn, marked on the chart as A? Wave. IF the correction of the fourth wave (4) will develop in the form of the ABCDE triangle, then a few sub-waves have to be completed to finish the correction.
The goal for the wave (5) is still min. $25k, according to the previous analysis, on which I presented projections of the ranges of individual waves.
What do you think? Will there be new heights?

ES Mid -Term Correction in Play? S+P 500 DownWe have two pretty good EW Counts - A complete eight cycle, followed by a another five wave impulse, meaning we could be looking at the start of at least a short correction Wave 8. Priced touched the 200% fib extension off the last high. Of course we all know we are at an all time high where we have bearish Tweezer Tops and Doji, and also bears divergence with Stochastic rolling over and signal cross low. A retrace to the 38.2 fib - would have the gap completely filled around 2681, for a first target. After that it may very well start back up or you can hold for a bigger wave A down. What ya think ?

XLMBTC - Completion of a Corrective SetWild week for XLM - seeing a boom in volume, nearly doubling in price over the past 7 days, and grinding through a mass sell-off as BTC shoots through the roof - settling at a new floor around 800-900 sat. Even with this recent drop, the mean is still rising steadily.
Taking a look at the chart, we can see what looks like Elliott Correction after the spike in price, and the completion of Wave 2 today. The pink dotted line being the long term trend, I see Wave 3 taking us up to 1150, Wave 4 bringing us back down around the 1000 sat mark, and finally reaching back up to 1400 with the completion of Wave 5.
XLM is creeping along, creating new floors out of previous ceilings. This will be a fun one to watch in 2018.

BTCUSD - Elliott Correction to the MeanI know everyone's on the "BTC Moon Lambo" hype train right now, but reality shows a regression in Elliott Wave fashion.
Peaking out in a $16K hockey stick today, and I've seen people draw comparison to Amazon, Netflix -0.10% , Apple 0.28% , and whatever other stocks fit their mold, but the harsh reality is that Bitcoin 13.55% is MySpace, maybe even Friendster. They've kicked in the door in and sprinted into the room - but, first man in the room gets shot. Long term, this isn't going to last.
RSI is maxed out. Squeeze is peaked. Everything is primed for a rough crash. BTC 13.55% to drop down to the $11K range due to initial panic, a Bull Trap at $14K leads to a pull down to the long term support line at $10K.

DXY possible scenario for weeks to comeDXY is in consolidation, one more up move is possible within this structure, Lets wait and see. Please trade with care

EURUSD Short , 2 possible entriesAs the preceding uptrend may have been completed and we are on the correction phase of Elliot waves , the correction has almost shaped a flat which also confirms the shaping double top considering the decreasing volume in the second peak however the double top has not been confirmed yet.
Entry 1 : first short position can be entered based on the completion of the Elliot flat correction ABC and also the decreasing volume that suggests a double top is forming. The target for this Entry would be right above the blue support line.
Entry 2: the more appealing entry however is a clean (1% and 2 close prices) of the blue support line which confirms the shape of the flat and also confirms the happening of double top which is a Reversal pattern for the preceding trend (12345 Elliot impulse). The order entry would be a sell stop on the clean break of the blue line; stop loss would be the clean violation of the blue support line (turned into resistance after clean break) and profit targets would be the leg of the double top (around the start of wave 1 on preceding Elliot impulse).
please give me your feedbacks :) thanks.

Has Bitcoin completed Wave 4 and is breaking out?Looks like the Wave 4 ABC correction is complete. The candles have broken from the pattern. Also the sub wave 1-5 in C looks complete. Let continue watching. It looks like we are now on Sub Wave 1 of Wave 5.

Bitcoin Cash Breakout from WXYZ pattern?Could Bitcoin Cash have completed a WXYZ pattern and is now heading to complete Wave 3 at $1900?
I am new to Elliot Wave, so if you are a pro please comment on my chart and let me know what you think.

We may have some more to correct for BitcoinPreviously I mentioned that we may be near a ABC correction. After looking at the chart, there should be 5 subwaves starting from the end of B until the end of point C. For the 5 subwaves we should have 5 subwaves as seen in green. Subwave 3 is usually the longest wave and should further have 5 subwaves. So if we do a count of 5 subwaves with in Wave 3 then it should bring out correction lower to the 8700-9000 zone.

Bitcoins Wave 4 Correction looks to be Over - As Wave 5 BeginsToday it looks like we finished an ABC correction to complete Wave 4 of Bitcoin. The graph shows the the ABC retraced between the .618 and .786 fibonacci zone. We may still touch the .786 fib.
The new Wave 5 target looks to project toward 1400-1500 area. The Wave 5 for December may be extended due to talks of CME group and NASDAQ launching futures platform for Bitcoin.

Bitcoin Cash (BCH) Short Term Bullish Trend to Complete Wave 3This Chart shows BCH on its way up to complete Prime Wave 3 after a ABC correction. Fibonnaci extensions have been done from Sub Wave 1 of 5h wave showing target of about $2,000 to complete Wave 5.
I believe we are in a short term buy zone now with entry of 1550 and exit of 1900-2000.
After Prime Wave 3 completes, we will see Wave 4 ABC correction probablty around the .386 zone.

usdchf londit is on MA200 and c of B correction is completed
thats an idea no anything else
and 38.2 retrascemen
