Elliottwavecorrection

BTCUSD extended flatBitcoin is showing bearish divergence on several timeframes. The daily looks like a dead cat bounce due to the low volume, accompanied by high CMF divergence on 4h.
The 1.236 extension falls at 8426, which also is the present channel top. If and when the trendline is rejected, i expect a drop below 5k, breaking the parabolic support and completing cycle wave 3.


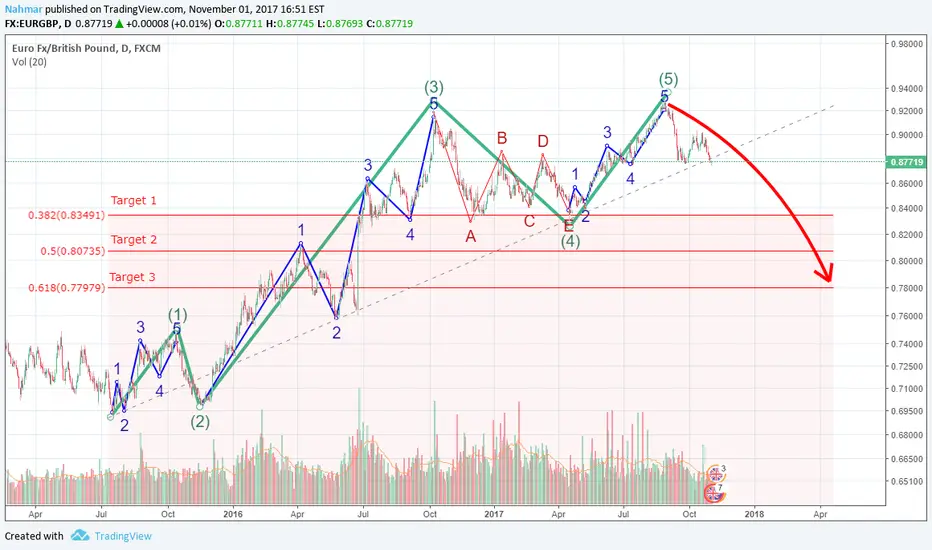
EURGBP Its a good time :) First wave finish , now price make a correction maybe until (081-0.79) But this could take many time.... Now we gonna trade a short wave ...

Elliot Waves on BCH correctionCryptocurrencies as a commodities ... very "emotional" behaviours. Elliot seems obvious here but please let me know what you think of it ;)

LTCUSD - "See What I Cee"Since we have broken down to 50.23 from the bearish triangle, and a nice 5 wave impulse up to 56.4 hitting 76.4 of A, we are seeing C coming. But more importantly, we are seeing all the C's line up .
IF AB=CD then we have
External AB=BC at 61.8% AND..
Another larger external AB=BC at 61.8%.
If we go higher than 56.4 we lose all the C's from lining up!
Remember that when cycles within cycles are lining up in fib. retracement, they become more powerful predictors.

$BTC may be in Elliott's correction wave... Next target $10KWe may need to talk about how Elliott's correction wave will look like?
Which one do you think likely to happen?
By the way, it think with this correction, we can see $10K in 2018.

EURGBP Short. Daily, Elliott Analyse It looks like we are seeing an uptrend and a downtrend or a correctional wave in the EURO.
To determine precisely the targets, we have to wait until the wave A ends its move.
But the deal can be done at this point.
EUR/USD - Short Call (21d)wave cycle appears to have completed, correction a/b appear to be forming in a downward channel, Weekly stoch has entered a bearish phase. 'C target' has confluence with 50% fib, bottom support of correction channel, and falls in the termination zone of the directional action.

Short ethusd observedHello Trader,
Short opportunity observed for ethusd
R:R approx 1 to 2.5
Trade with care.
Thank you.

Short then Long ObservationHello Trader,
Short for wave C as correction then Long for Bullish Gartley.
R:R approx 1 to 2
Trade with care.

GBP/CAD Targets 1.7400Based on the Elliott wave analysis, I'm expecting to see a nice correction towards the C wave lvl - 1.7400 78.6 fib.

AUD/USD Elliott Wave Correction ABCFX:AUDUSD Awaiting Correctional Wave ABC
Potential correction on Elliott Wave
Rules for Elliot Wave
Wave 3 can never be the shortest impulse wave
Wave 2 can never go beyond the start of Wave 1
Wave 4 can never cross in the same price area as Wave 1
Support Level: 0.7750
Stop Loss: 0.7740
Target: 0.7928
Risk to Reward: 1:5

Bulls Waking Up SoonLTCUSDT has seen a very healthy correction thus far (along with all other top crypto). Lets see if this is the bottom or not. I've since changed my position from a 5-3-5 zig zag correction to a 3-3-5 regular flat. A few weeks ago I missed the top estimate, but nailed the severity of the correction (I think). This seems to confirm to me that LTCUSDT and LTCUSD has seen a complete overall cycle wave 1. This correction end point will mark the end of wave 2.
First indication: The current price is jostling directly on the overall cycle .5 re-trace. Very popular reversal for wave 2.
Second indication: It is riding its lifetime uptrend. While I expect a breach of this uptrend before beginning wave 3 to create a new uptrend, I still think this is a very good indication for at least an end to correction wave A as it presents a psychological border.
Third indication: 1HR RSI shows large bullish divergence while 4HR RSI shows oversold breach.
Fourth indication: Take a look at the -/+ volume in this triangle forming as compared to the last week. Traders are getting restless.
I see three possibilities from this point:
1) Optimistic in Green - Begin overall cycle impulse wave 3 to 120s.
2) Realistic in blue - Begin correction wave B of overall cycle wave 2 to 70-85 region before beginning wave C down. I see this as the most likely due to the short time this correction has been running if it is truly a correction to overall cycle impulse wave 1.
3) Pessimistic in red - Charlie Lee is the devil and wants to watch the world burn with extensions of current down.
Stop set to 40.5 in the event of scenario 3.
Keep an eye on BTC as it's the one that seems to drive the crypto world.
Let me know if you agree or not. I welcome your constructive criticism.

E-ABCD Gartley - River of BloodBTCUSD Tales of the Heroes..
Role Play: Rectangle A
The Bulls- Failed on 1st, 2nd Attempt.
The Bears - Passed on 1st, 2nd Attempt.
EPL SC 2 - 2 MU


BTCUSDPart 3 BITCOIN
The third part did'nt take long to wait
TR3 is set - 3400-3500.
Elliott correction ABC has already worked.

Sugar - Wave 4 should complete in the 15.54 - 16.03 area Since my last update on June 23 - 2017, we saw wave 3 bottom at 12.53, which was just below the expected 12.67 target. Since this low wave 4 has been unfolding as a flat correction. I'm looking for wave 4 to complete in the 15.54 - 16.03 area for the next impulsive decline in wave 5 towards 9.98.
Stay tuned for a top and new impulsive decline soon.

possible BTC correction wave This might be a sideways (flat) 3-3-5 correction wave of higher level correction.
Theoretically Wave C should land somewhere between 3200 and 4000. I think it will be around the major support level of 3625.
After reaching C, we must look for signs of retrace, which would convert the ABC correction wave to bearish impulse wave
(targeting a lower point around 3000).
What do you think?
Don't take this as a financial advice. I've little experience.

Correction Over or More Drop?This morning BTCUSDT entered my projected buy zone. If I counted right, BTCUSDT just completed an Elliott ABC 5-3-5 Zig-Zag style correction. I feel like It's pretty close to being done as it appears to have finished directly on the overall uptrend line. This point also terminates wave ((C)) directly in the middle of FIB 0.618 and 1.0 of wave ((A)) which are two common and reliable distances for projecting zig-zag corrections.
However, In light of China's ICOs trials: immediate customer payback has been ordered and ICOs have been outlawed. The way I see it, this could either cause more drop in the crypto market overall as money is syphoned out to cover paybacks or the money has already been syphoned out in preparation for paybacks meaning room to grow as customers re-invest into existing crypto. I have since changed my position from long to neutral and set buy/sell stops.
BTC still seems to dictate the market for the majority of alt-coins. This correction ending or extending should spark similar reaction in most crypto. I'm keeping an eye on BTC to decide what to do with my alts.
Please let me know if you see anything different or know something I did not account for.
Stop buy will be set to 4600 with a stop loss set to 4100. Hopefully this covers either scenario.

XVG current wave and market predictionThere is a volatility within the current market strength/movement of XVG supported by the current BTC up-trending price. Keep your eyes on BTC price. Trade safely, good luck.
For more info, Verge (XVG) website: vergecurrency.com
Disclaimer: The market predictions and ideas I post are of my point of view and depends on what I see (according to the market strength and prices movements), it's subject to human error/price manipulation. Trade carefully, do your own homework.
My twitter: twitter.com

Verge (XVG) market prediction - End of E.Wave Correction Wave(C)- Here we can see an ongoing accumulation in progress after the end of Elliot Wave Correction Wave (C).
- Price has reached the bottom and retracing up is the next move for the market (depends on the points mentioned on the chart).
For more info, Verge (XVG) website: vergecurrency.com
Disclaimer: The market predictions and ideas I post are of my point of view and depends on what I see (according to the market strength and prices movements), it's subject to human error/price manipulation. Trade carefully, do your own homework.
My twitter: twitter.com
