USDCHF Quick Trade - LongLooking at the hourly chart on the USDCHF, the pair is in the last leg of a 5-wave decline, with decreasing momentum, as evidenced by the negative divergence. This should be followed by a three-wave correction. While we do not rule out one more down move, we prefer to go long at market with a stop at 0.9575 and a take profit at 0.9770.
Elliottwavecorrection

Brent oil on correction wave loading for next moveBrent oil waiting for launching new target still on correction wave area will be move soon

GBPUSDGBPUSD Looks like we have completed the complex correction i mean a double correction which is wxy ! i feel we will move towards the upside and bottomed out too :) as long as hold above my stop loss looking for a buy !

WAVE STRUCTURE FOR MORE DOWNSIDE ON GBPJPY ?As we can see that we are having a nice corrective structure on GBPJPY for more downside. If you are in the trade from top great if not then wait for lower time frame confirmations and sell setups before getting into the trade.

AUDUSDWow it looks like we have completed the 4th wave and it should move towards the 5thwave for the downside to my target levels ! let's wait and see how it plays out , tight stop loss

AUDUSD bullish scenario :: 7100 ?China's approach to the end of the closure helped increase the demand for commodities with an improvement in risk sentiment, with which the demand for the dollar declined, and supported the Australian from its last bottom at 0.6829, up for the third day in a row
technically
The expected waveform arrangement puts an end to the first impulse descending wave, entering a correction that we may be in its first wave
For monitoring 7100 next period

Gold trading in weekly time and correction my past ideaIf we look at the weekly gold chart, we see exactly the pattern of regular flat correction, where each wave is marked as a microwave.
In flat correction , C wave will be in the form of a 5 wave, as we see, is doing 3 wave , and after the end of 3 wave , we will have a correction as 4 wave , and then the final 5 wave, which targets can be as same size of an A wave or slightly larger
Of course, in the last box, the goals of 3 Wave are shown as Fibo OANDA:XAUUSD FOREXCOM:XAUUSD

USDRUB EXPANDING ENDING DIAGONALUSDRUB Complete the Monthly Wave 5 with Expanding Ending Diagonal.
Now we have correction ABC or Downtrend with 5 Waves


Bitcoin - What if I told you something like this is possible?There is an expanding symmetrical triangle (megaphone pattern) in Elliott Wave Theory. I'm not saying this is definitely happening, but if we see an impulsive reversal after dropping a bit lower, below wave ((a)) support, then it becomes a possibility.
This is the same fourth wave pattern we saw in the Dow where the March 2020 drop was wave E of the triangle. It's always good to know and understand the possibilities.
As I have mentioned numerous times before, it's also possible that wave 5 ended at the ATH. It's also possible that the ATH is only wave 3 and the current three wave pullback is wave 4. This is just one possible pattern that could play out. There are often multiple possibilities when price prints a range.


Btc can go to 24k and lower thanHi
According to previous analysis 3 days ago, bit fall to 30 k. This decrease can reach to 24 k at the first stage.
Have good trade

New primary countWith this most recent drop, everything clicked into place. Eureka!
Triangle is off the table, huge 1-2 as well. The only real alternative is long term top in or that this whole thing is not an abc, but a wxy -> same target, just different internal structure.
We'll see how this progresses, but this has a very high probability of playing out.

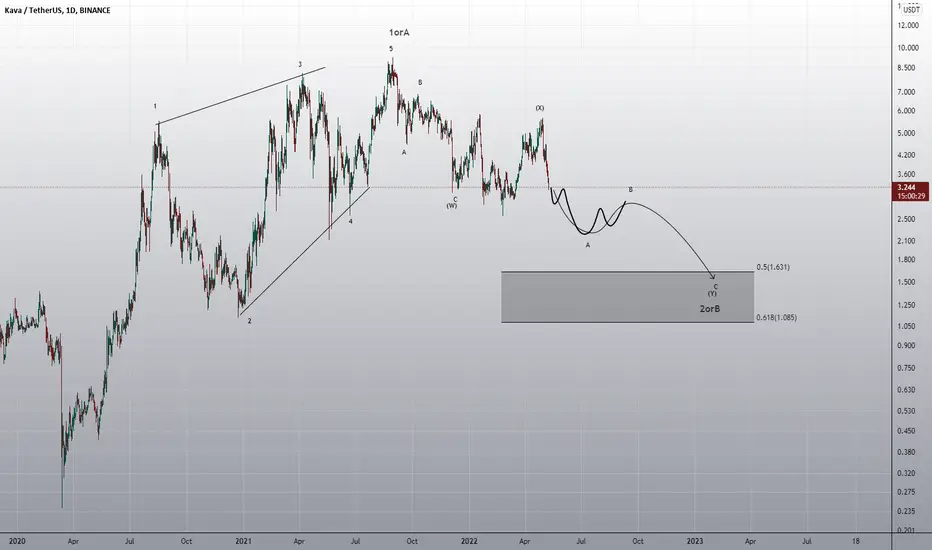
KAVAUSDTWave A of Y is completing. After completing the 2orB correction The wave, the price starts to rise.
Double zigzag correction in Dax, sell signalHi
A correction of Dax is not completed and we are in double zigzag correction.
By the Elliot wave analysis, the entering point of sell opportunity, stop loss and take profit is shown on the curve.
Have good trade
Yours

Huge fall in Bitcoin is started, sell sell sellHi
In btc, we are lower than 37500 and means that the powerful wave 3 of c wave of correction is began. Bit can fall to 19k-20k
Have good trade
Bye

Vanguard Russell 2000 | Huge ABC correction inbound | $VTWOA five wave primary Elliot wave cycle has ended. A primary ABC correction will now take place before another primary downtrend begins. After two bear cycles there will be consolidation and reversal. Bull trend will follow consolidation.
1.) We have a right angled broadening bottom in progress
2.) We have an Adam and Eve double bottom on 1 hour and 5 minute charts
3.) The market is at exhaustion as the price cannot go lower than the mornings dump
4.) The daily chart show that the 5 elliot wave has stopped exactly at Fibonacci extension 1.236 of the 4th wave

SCALPING ETHGood day traders,
**FEEL FREE TO UNZOOM THE CHART THE GET EVERYTHING and LOWER OBJECTIVES**
Today we keep looking at the ETH movement finishing its second X of the WXYXZ.
1/ It has reached its FIRST objectives at 2633
///-----> 123% of the C of the white ABC
But it is supposed to hit lower, where you have stronger objectives, and it is the same for the BTC and for the NAS100.
2/ Therefore the SECOND objective is at 2543
///-----> 161,8% of the C of the white ABC
////------>113% of the C of the red ABC
3/ Moreover, the THIRD and strongest objectives is at 2510-2473 minimum
///-----> 123%/127% of the red ABC
////------> 127% of the C of the orange ABC
/////-------> 85,4% retracement of the Y

Larger WXY correction is in play???
WXY or Double Three One of most time consuming correction and also known as good accumulation process if this prediction is correct we might see lower levels as deep as 33-32K

here is my 2nd scenario for WXY correction
now we have to think about B wave already completed and we are making some form of Diagonal in C wave
Diagonal often hint the final push of bear or bull market !!!

BTCUSD Elliot Wave Count - Primary DegreeBitcoin is currently in Cycle Wave III and Primary Wave 4
This is my Intermediate count on BTCUSD:
Forecast for 2022 is mostly bearish as BTC is in a complex WXYXZ correction. There might yet still be more bullish oppertunities on the Minor degree as BTC is still within an Intermediate triangle formation.
I am not a financial adviser, that job sucks balls!

BTCUSD longterm path ?Just a idea based on a possible elliot waves / fibonacci chart.
If we take the big move up weve had as a impulse wave, and after that see the second high as a wave B in a irregular flat elliot correction wave. which has a C of 1.236/1.618 from wave AB. this would be te outcome. aligning with fibbonaci levels, horizontal and diagonal support/resistance levels.
Give me your feedback!

GBPAUD LONG - DEMAND, RSI, ELLIOTT, LIQUIDITYHello friends,
We are at a demand zone which caused a break of structure above. There is RSI continuation as well as reversal divergence. In addition, triangle correction wave is completed as well. We are seeking trendline liquidity above.
