Potential Reversal Ahead: Elliott Wave AnalysisHello friends,
Welcome to RK_Chaarts,
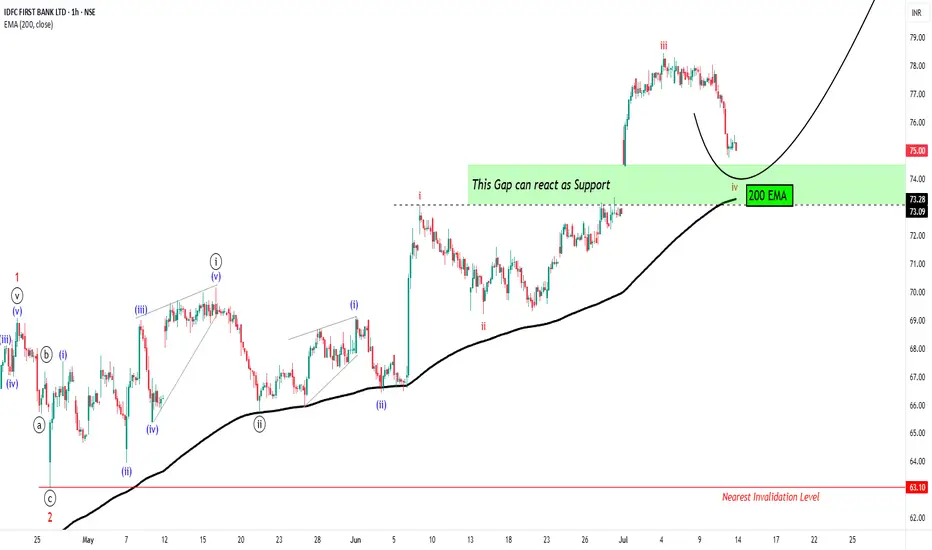
Today we're going to analyze chart of stock named IDFC First Bank, based on Elliott wave theory.
Today, we're analyzing the chart of IDFC First Bank using Elliott Wave theory. On the chart, we've marked the Elliott Waves, indicating that:
- Red wave 1 and 2 (Minor degree) have ended
- Price is unfolding into red wave 3 (Minor degree)
- Black wave ((i)) and ((ii)) (Minute degree) have completed
- Black wave ((iii)) (Minute degree) is ongoing
- Blue wave (i) and (ii) (Minuette degree) have finished
- Blue wave (iii) (Minuette degree) is in progress
- Red wave i, ii, and iii (Subminuette degree) have completed
- Possibly in the correction phase of red wave iv (Subminuette degree)
We observe that the price gapped up, retraced to correct wave iv, and is now supported by the gap zone. Along with 200Exponential Moving Average is also at Gap level which can also provide a good Support to same view.
Our estimate suggests a high probability of a price reversal. However, market uncertainties exist.
Potential price targets: 81, 93, and 100+
Nearest invalidation level: 73.09 (wave iv should not overlap wave i)
Please note that this analysis is for educational purposes only. I'm not a SEBI-registered analyst, and you should consult your financial advisor before trading or investing.
Let's see how the market unfolds. This entire study is shared solely for educational purposes. Thank you so much.
I am not Sebi registered analyst.
My studies are for educational purpose only.
Please Consult your financial advisor before trading or investing.
I am not responsible for any kinds of your profits and your losses.
Most investors treat trading as a hobby because they have a full-time job doing something else.
However, If you treat trading like a business, it will pay you like a business.
If you treat like a hobby, hobbies don't pay, they cost you...!
Hope this post is helpful to community
Thanks
RK💕
Disclaimer and Risk Warning.
The analysis and discussion provided on in.tradingview.com is intended for educational purposes only and should not be relied upon for trading decisions. RK_Chaarts is not an investment adviser and the information provided here should not be taken as professional investment advice. Before buying or selling any investments, securities, or precious metals, it is recommended that you conduct your own due diligence. RK_Chaarts does not share in your profits and will not take responsibility for any losses you may incur. So Please Consult your financial advisor before trading or investing.
Elliottwavecount
DXY Monthly Analysis | Smart Money Concept + CHoCH BreakdownPair: US Dollar Index (DXY)
Timeframe: 1M (Monthly)
Strategy: Smart Money Concept (SMC) + Market Structure + Demand/Supply Zones
Bias: Bearish (Mid to Long-Term)
Breakdown:
Price reacted strongly from the monthly supply zone (110–104), showing signs of exhaustion.
Clear CHoCH (Change of Character) visible at the top structure, confirming loss of bullish intent.
Internal structure printed a liquidity sweep + FVG (Fair Value Gap) ➝ BOS ➝ lower low.
Current PA (price action) is targeting the first demand zone near 92–94, but major interest lies at the macro demand zone (85.100–84.900).
This level aligns with unmitigated historical demand and potential long-term accumulation range.
---
📅 Projection:
Expecting a continuation to the downside after retesting minor imbalance zones.
Potential multi-year bearish leg forming Wave 3 (macro view).
Ideal accumulation/buy zone: 85.100–84.900 – if structure supports.
---
📌 Key Levels to Watch:
Supply Zone: 110.800 – 104.600
CHoCH Level: ~102.300
Short-Term Demand: 92.000 – 94.000
Long-Term Demand (Institutional Interest): 85.100 – 84.900
---
💡 Conclusion: Smart Money has exited from premium pricing, and the macro structure aligns with a bearish transition. As long as price respects current lower highs, we may see a deeper correction or possible trend reversal near 85 levels.
---
🧠 #DXY #SmartMoney #CHoCH #ForexAnalysis #SupplyAndDemand #PriceAction #Forex #Month

GOLD - Buy the dips toward the 50% / 61% retracement...the decline from the 22nd of April is in a very clear 3 waves with a perfect 100% retracement. the subsequent rally from the 15th of May is in a clear motive sequence. negative RSI divergence signals that some sort of 5th wave is complete.
the characteristics of this motive rally seems like a wave (i) of V is complete and we are now looking for a drop to complete wave (ii) of V.
buying dips toward the 50% / 61% retracement is my preferred strategy for now.
a rally and daily close above 3400 would invalidate this analysis. keep in mind possible volatility due to upcoming event risk.

Technical Analysis with Elliott Waves: A Combined ApproachHello friends, Welcome to RK Charts!
This Educational Post is based on technical analysis, specifically how to initiate analysis on a chart, and what points to consider. This is purely for Educational purposes.
This is not a trading or investing tip or advisory. Rather, it's a comprehensive guide on how to easily analyze a chart, intended for educational purposes. I hope that by reading and understanding this post, you'll gain valuable knowledge and insights. Your focused effort to understand this will surely provide you with something valuable and easy to grasp.
Let's dive in, During technical analysis, what we had observed certain points in this chart, I'm highlighting them here:
1. Resistance line breakout, where the price has closed above it.
2. The volume within that breakout.
3. The price closing above Weekly Exponential Moving Averages.
4. Elliott Wave Counts.
5. Projected Target along with Invalidation level as per Elliott Wave theory.
6. Projected Duration for Projected Targets.
Breakout of Resistance zone with Good Volume intensity:
So, friends, here we can clearly see on the chart that this is a weekly time frame chart of Shipping Corporation of India Limited. Over the last eleven months, from July 2024, the price has been falling, remaining largely bearish, but has now broken out of Curved Resistance Trendline for the first time with a bullish candle on Weekly (Closing basis), accompanied by good volume intensity.
Alongside this, the price has sustained and closed above Major EMAs:
- 50-Weekly Exponential moving average (red line plotted on the chart)
- 100-Weekly Exponential moving average (blue line plotted on the chart)
- 200-Weekly Exponential moving average (black line plotted on the chart)
on the weekly time frame.
Elliott Wave Theory:
Considering the Elliott Wave structure, if we look at it theoretically, the top it made on July 2024, was the completion of Wave III. After that, it completed Wave IV in 7 swings (WXY) and is now possibly moving higher, making higher lows. It has closed above the moving averages, broken out of the Curved Trendline, and has strong volume. So, possibly, we are unfolding an impulse Wave V.
In Elliott Wave Theory, the invalidation level means that the price should not go below that level, which in this case is the low of Wave IV at ₹130. If the price goes below that level for any reason, even by a single point, our wave counts will be invalidated, and we'll have to re-analyze the chart.
That's why we call it the invalidation level. Analysts and traders also refer to it as a stop-loss level. So, in Elliott Wave Theory, our wave counts remain valid as long as the price stays above the invalidation level and doesn't trigger it.
Now, regarding the target, if we take the measurement of Wave IV and calculate its 1.236 level, the target for Wave V should be above the high of Wave III. According to Elliott Wave Theory, the projected target for Wave V is near ₹440, which is the 1.236 Fibonacci level.
Projected Duration for Projected Targets:
In the chart analysis we conducted, where we prospectively projected a target, if everything goes right and the invalidation level is not triggered, what could be the duration of this target? It will definitely take more than a medium-term duration, maybe even a long-term duration.
This is because each candle represents a week, and we're currently looking at the weekly time frame. Since the fourth wave has just ended and the fifth wave is upcoming, it will take a long-term duration
I am not Sebi registered analyst.
My studies are for educational purpose only.
Please Consult your financial advisor before trading or investing.
I am not responsible for any kinds of your profits and your losses.
Most investors treat trading as a hobby because they have a full-time job doing something else.
However, If you treat trading like a business, it will pay you like a business.
If you treat like a hobby, hobbies don't pay, they cost you...!
Hope this post is helpful to community
Thanks
RK💕
Disclaimer and Risk Warning.
The analysis and discussion provided on in.tradingview.com is intended for educational purposes only and should not be relied upon for trading decisions. RK_Chaarts is not an investment adviser and the information provided here should not be taken as professional investment advice. Before buying or selling any investments, securities, or precious metals, it is recommended that you conduct your own due diligence. RK_Chaarts does not share in your profits and will not take responsibility for any losses you may incur. So Please Consult your financial advisor before trading or investing.

DXY Has More To The UpsideDXY is right now in what I believe to be a 4th wave correction, which has turned into a wxy, and probably also will turn into a WXYXZ.
It has plenty of room to develop.
Since 4th wave corrections has a tendency to enter the area of the 4th wave of previous impulse, it will most likely go up to the area of the green rectangle above.
This will be between 103.2 - 104,7.
If it will go further up before heading down is to early to say.
But my previous forecast about it will go down below 96 is still in play and intact.

Gold Is Doing What Ever Gold Wants To DoPreviously I posted a reading where I said gold was to go a bit down before is went up. But Gold didn't go down, and went straight up.
But it did go up right :D
Right now I strongly believe gold is in a wxy correction.
And I think will finish the y-wave i the green box area somewhere between 3,147 and 3,077, which is the 100-123% fib-level of the w-wave.
The reason I believe this, is at that timewise the y-wave will here have taken as long as the w-wave, and I the price is heading for that cyan median line. And normally price will also go to the bottom and a bit below of the Kennedy line.
Multiple factors are pointing to that level.
When price hits that level, I believe we will see a 5th level to the upside where 4,000 definitely is in play.
I will include a link to a higher degree reading, where you can see I believe gold has finished a third wave, so we still need a 5th wave to the upside.

BTC is Still A Correction.BTC is in good rally these days, but my believe is that it is still in a correction.
I am not 100% confident in wavecount, but I am confident that BTC is not done correcting until it has gone down to somewhere between 62.500 - 52.500.
If the rally BTC is currently in, I believe we are seeing a flat, and I will correct my count accordingly.. But right now I'm seeing a W-X-Y-X-Z correction.
Be careful, and do not bet on BTC is rallying to a million just yet ;)
For now I believe there will be good odds for following the white line I've drawn on the chart.

COTI WAVE 3 is coming COTI has completed its initial phases, Wave 1, 2 of Elliot waves and is preparing for Wave 3📈.
Also COTI V2, released recently, aims to revolutionize web3 privacy.
COTI’s market capitalization is $96 million, suggesting substantial potential gains during the upcoming bull market🚀.
This information is not financial advice. Conduct thorough research before making investment decisions.

Russell 2000 - Sell till late May & Buy in Early June?
Wave (ii) is still in progress. Slight update to the primary wave count from the previous one below.
200 & 100 SMA's are sloping firmly to the downside therefore I will continue to keep selling at technical levels. Late May or early June would be a good time to go long...
Support levels are shown in green.

Binance Coin BNB is Likely to go down, until at least end of MayBNB has been in a correction since the start of December '24. And as time went by, it developed into an combo correction.
I believe we are at the end of the purple B-wave of the green (Y) wave.
We are right now finithing the white ((c)) wave of purple B wave, so we are going to see a small wave up until around the 630-640 level. And after this the purple C wave is going to take on downwards.
And since very rarely the c wave has a shorter timespan than the a wave, we are not going to see this correction end until the end of may/ start of june.
I believe the purple C wave are going to take us down to the 382 level in that yellow box.
The 383 level is the 61.8% retracement of the primary white ((1)) wave. And this level is also roughly around the 100% Fib level of the purple A wave.
If price comes to the green box I've drawn out. I belive that would be a good time to start looking for a confirmation to short.

A Zoom of the Weekly DXY into a Daily viewI kept the colored rectangels from my weekly analysis, to keep the focus and knowledge where we are on the chart.
DXY is doing a long A-B-C before it's is going into the last impulse og the C of Y of x of the larger degree.
It's quite a lot of corrections to manage, but if you swipe from the daily to the weekly timeframe, it makes good sense. For me at least :D.
The purple B wave took some time to figure out, but this was what made most sense to me. I was trying to look at it as a triangle, but that wouldn't have a good shape, so I ended out with this white ((w))-((x))-((y)) correction.
DXY is right now performing, what I see as, a extended 5th wave in the white ((iii) wave, before it goes into the white ((iv)) correction.
The white ((iv) wave correction could be become a long shallow drawn out correction for two reasons.
We had a steep and swift white (ii) followed by an extended white ((iii) wave. This usually means we are going to spend some time correcting that white (iii) wave and the rule of alternation tells us, if we have a quick 2nd wave, we are usually going to see a slow fourth wave.
I don't believe we have completed the white (iii) yet, so we have a long time to go still until that white (iv) wave is done.
When the white (iv) wave is done, the white (v) wave is probaly going to take us down to that green box.
So relax for the next 6 months and grab yourself a cup of coffee.

DXY In Difficult Circumstances Since the Start 80's I decided to give a go at the Dollar Index given the circumstances around the world. And to be honest, I tried to put on the positive glasses.
I believe the dollar has been in a complex correction since the mid 80's. Starting out with a large dump in '85 with the a-wave, the correction slowed down and only grew more and more complex.
Thought about current wave: What I believe we are going through now is, that we are finishing up the purple C-wave in a green (C)-wave. This wave can end at any time now, since it's now at the 61.8% fib level of the purple A-wave. But it might go down to the 95 level (The green box) to complete at the 100% fiblevel of the purple A-Wave.
But first we will have the fourth wave meaning the DXY is gonna struggle for some weeks. Because we had a swift two week wave 2, which means we are probably going have a slow fourth wave according to the rule of alternation. This mean the purple C-wave could drag out into the end of '25 into early '26.
This is also with that in mind that a C-wave most likely will take longer than an A-wave. These are the Purple boxes.
BUT, after this, DXY is gonna experience some happy years again, going back up to the yellow box somewhere between 110 and 120 to finish the WXY of x of the larger degree. This will take DXY into a couple of years bull-run as long as the green (C) wave runs and completes no earlier than late '27, depending when the purple C-wave prior to the green (C) wave ends. But I believe the green (C)-wave will take about two years to complete.
But after this, DXY could again go into some dark ages and considering the high degree purple w-wave took 23 years to complete (blue giant box), there is no reason to believe this high degree purple y-wave will be a swift matter and actually don't complete before the year 2050. And it will take the DXY all the down to start 60's or lower.
The reason I said I tried to put on the positive glasses, is that I tried seeing the white channel as a leading diagonal for a new bull run, but I just don't see it as such.
I also tried seeing it as a C-wave of a flat diagonal, but this would result in another C-wave afterwards, and also take us down to the 60's level. So that didn't do us any good.
For the sake of DXY, I hope I'm wrong, but this is how I see it.

Russell 2000 - one more drop to complete the correction?Looking for the double zig zag correction to complete (Y) leg in the blue zone. Will be looking for five waves to the downside for the target.
Updated the wave count from my previous chart below...
This drop from the 25th November 2024 to the expected target zone would be more or less similar to the Covid drop in terms of percentage.

Russell 2000 - 5th wave of Y leg may already be in progress... The rejection at 2100 price level also happens to be the 38.2% Fib of the decline from the 14th of February 2025. The decline from 6th of February 2025 counts beautifully as waves 1, 2, 3 & 4. If this wave count is correct, then the Russell is currently in wave 1 of 5 of Y of (ii).
This is my primary wave count as long as the 2100 resistance is not breached.
This changes my initial wave count from a complex WXYXZ to a simple WXY.
Click on the link to see the previous wave count which is still valid and is now an alternate wave count if the 2100 resistance is breached:
Only updating the wave count. My bias and direction remain the same.
Wave Y is possibly in progress. Looks like we are going to have a bearish April & possibly May as well. Selling corrective rally is still the way to trade for now. Take profit at 1905/1900, which is where technically, the Russell 2000 will possibly turn up for wave (iii).
Stop Loss can be placed above wave 4, well out of the way in case of any wild swing on this PCE Friday.

BITCOIN Final update !!! We're about to BOOM!!!According to bigger picture, we're still in bull market, 5th of macro and ending 4th of micro elliott wave.
Good news is, that we're about to get back into bullish mega green candles soon!!
BTC's major CME gap has been filled and this was also the region where FVG is also available and also corrective pattern (double three) Y ends in this region in combining with expanded flat's C. we may most probably by will of GOD almighty will see green days in coming weeks. Targets of wave 5 are up to 120-130K region.

BITCOIN TO 140K CONFIRMED !!! 🚀 On shorter time frame #BTC is forming ending diagonal in wave c of minor wave 2 correction, which indicates that correction may end up here and we may see shift from correction to minor wave 3 impulse move🚀
🚀 In that case major wave count of wave 3 and minor v ends up to 130k 🚀
🚀 If major wave 3 extends upto 130k, then we may see last 5th major to end up near 140k 🚀

How Far BNB Would Make In This BullRun??
As Per Harmonic crab Pattern, #BNB first target aligns at 975$, the 1.618 fib level, where crab's D leg is likely to end.
As for elliott wave macro count, we're currently running in 5th macro wave which ends near about 1100-1250$ region.
In going for micro wave count of macro wave 5, we've completed 4th corrective wave & now heading for 5th micro of 5th macro wave, that also aligns with macro wave 5.

Deeper Lows Ahead Before Reversal in SILVER ? Elliott WavesThe chart suggests a potential downward trend for Silver to complete wave (C) Blue of wave ((4)) Black and then wave Uptrend ((5)) Black.
Elliott Wave Structure:
The chart appears to be in a corrective wave structure, likely a Zigzag.
The current position seems to be within a corrective wave ((4)) Black in which wave (A) & (B) are completed and now we are unfolding wave (C) Blue of ((4)) Black.
Inside wave (C) we had completed wave 1 & 2 and now we are unfolding wave 3 Red in wave (C), post wave 3, we have to unfold wave 4 & 5 Red to finish wave (C) Blue of wave ((4)) Black.
Potential Scenarios:
Downside: If the downward trend continues, the price may reach Fib extension level where wave (C) equals with wave (A) and some times may goes towards 1.236 Fibonacci extension level.
Post completion wave ((4)) Black, we may see Reversal towards new Highs to finish wave ((5)) which generally goes beyond wave ((3)) High.
I am not Sebi registered analyst.
My studies are for educational purpose only.
Please Consult your financial advisor before trading or investing.
I am not responsible for any kinds of your profits and your losses.
Most investors treat trading as a hobby because they have a full-time job doing something else.
However, If you treat trading like a business, it will pay you like a business.
If you treat like a hobby, hobbies don't pay, they cost you...!
Hope this post is helpful to community
Thanks
RK💕
Disclaimer and Risk Warning.
The analysis and discussion provided on in.tradingview.com is intended for educational purposes only and should not be relied upon for trading decisions. RK_Charts is not an investment adviser and the information provided here should not be taken as professional investment advice. Before buying or selling any investments, securities, or precious metals, it is recommended that you conduct your own due diligence. RK_Charts does not share in your profits and will not take responsibility for any losses you may incur. So Please Consult your financial advisor before trading or investing.

US10Y ELLIOTT WAVE ANALYSIS: 19 DEC, 2024©Master of Elliott Wave: Hua (Shane) Cuong, CEWA-M.
The entire ((2))-navy most recent completed as an (A)(B)(C)-orange Zigzag, and the ((3))-navy is now retracing to push higher.
It is subdividing into a (1)(2)-orange, and they have completed, since the high of 4.126%, the (3)-orange is unfolding to push lower, targeting the high of 5.163%

USDJPY Wave AnalysisIt seems that the downtrend has ended in this timeframe and we should wait for the start of an uptrend
Trade entry: 150.000 range
Stop loss: 145.700
Take profit: 158.376
This offer has a risk/reward ratio of around 2
Make sure to involve less than 2-3% of your total capital and adhere to the principles of money management
This is just a suggestion for consideration

ASX:WES - ELLIOTT WAVE ANALYSIS: 22 NOV, 2024 - BULLISH©Master of Elliott Wave: Hua (Shane) Cuong, CEWA-M.
1D Details: Wave 4-grey ended at the low of 66.27 and wave 5-grey is unfolding to push much higher, targeting around 77.17 - 80.00.
Invalidation point: 69.14

NYSE:MU - ELLIOTT WAVE ANALYSIS: 22 NOV, 2024 - BULLISH©Master of Elliott Wave: Hua (Shane) Cuong, CEWA-M.
I see that an ABC-grey probably just completed recently at the 84.12 low, and the corrective waves are followed by motive waves, so I expect a much higher push in this stock.
Looking closer, I see that the 1-grey and 2-grey waves just completed at 95.53 and it looks like the 3-grey wave is unfolding. It is subdividing into ((i)),((ii))-navy. And after the ((ii))-navy wave is over, we can go long towards the ((iii))-navy wave.
While price must remain above 95.53 to maintain this view.
Key point: Wave B of wave ((ii))-navy.

Elliott Wave Outlook for RELIANCETechnical Analysis of Reliance Industries (RELIANCE) based on Elliott Waves
This analysis is based on Elliott Wave Theory and is for educational purposes only. It does not constitute financial advice. Investing involves risk, and past performance is not indicative of future results. Always consult with a financial advisor before making any investment decisions.
Elliott Wave Analysis
The provided chart of Reliance Industries (RELIANCE) outlines a potential Elliott Wave pattern within a 1-hour timeframe. Elliott Wave Theory suggests that financial markets move in predictable and repeatedly patterns based on investor psychology.
Key Observations:
1. Impulse Wave: The primary uptrend appears to be an impulse wave, a five-wave structure.
Wave 1: The initial uptrend from the low point.
Wave 2: A minor correction or pullback.
Wave 3: A strong extension of the uptrend.
Wave 4: A smaller correction.
Wave 5: The final wave of the impulse, often ending with a climactic price movement.
2. Corrective Wave: The current downward movement was a zigzag corrective pattern.
Wave A: The initial decline.
Wave B: A minor retracement.
Wave C: The expected continuation of the downward trend.
Potential Scenario:
If the current corrective pattern zigzag finishes here or near, then further wave ((3)) is to start post completion of wave (C) of ((2)), and it would not go sudden upside, because any impulse wave unfolds in five subdivisions, so wave (1) of wave ((3)) can start any time post completion of wave (C) of wave ((2)).
Note: This analysis is based on a specific interpretation of the Elliott Wave pattern. Other analysts might have different interpretations. It's crucial to use multiple tools and indicators to confirm your analysis.
Additional Considerations:
Fundamental Analysis: Consider factors like company earnings, industry trends, and economic indicators to support your technical analysis.
Risk Management: Always use stop-loss orders to limit your potential losses.
Diversification: Don't put all your eggs in one basket. Diversify your investments across different assets.
Remember: Elliott Wave analysis is a complex tool that requires practice and experience. It's essential to approach it with caution and always consider the potential risks involved in trading.
I am not Sebi registered analyst.
My studies are for educational purpose only.
Please Consult your financial advisor before trading or investing.
I am not responsible for any kinds of your profits and your losses.
Most investors treat trading as a hobby because they have a full-time job doing something else.
However, If you treat trading like a business, it will pay you like a business.
If you treat like a hobby, hobbies don't pay, they cost you...!
Hope this post is helpful to community
Thanks
RK💕
Disclaimer and Risk Warning.
The analysis and discussion provided on in.tradingview.com is intended for educational purposes only and should not be relied upon for trading decisions. RK_Charts is not an investment adviser and the information provided here should not be taken as professional investment advice. Before buying or selling any investments, securities, or precious metals, it is recommended that you conduct your own due diligence. RK_Charts does not share in your profits and will not take responsibility for any losses you may incur. So Please Consult your financial advisor before trading or investing.
