COIN Technical Analysis: Wave (4) Correction Nearing CompletionTechnical analysis chart of the cryptocurrency "COIN" using Elliott Wave Theory. Elliott Wave Theory is a technical analysis method that suggests that financial markets move in predictable patterns based on a series of five waves.
The information provided in this post is for educational purposes only and should not be considered as financial advice. There is a risk of being completely wrong, and users are warned not to trade or invest solely based on this study. The content is not an advisory and does not guarantee profits. We are not responsible for any kind of profits and losses; individuals should consult a financial advisor before making any trading or investment decisions.
Based on the chart, we had identified a potential impulse wave pattern from January 2023 to the present. An impulse wave pattern consists of five waves, with each wave labeled (1), (2), (3), (4), and (5).
Wave (1): This is the first wave in the impulse pattern and is typically a strong upward trend. In this case, wave (1) appears to have run from the low near 31-32 to a high near 114.
Wave (2): This is a corrective wave that moves in the opposite direction of wave (1). It is typically a retracement of wave (1), but it can also extend beyond the starting point of wave (1). Wave (2) appears to have run from the high near 114 to a low near 69.
Wave (3): This is the second wave in the impulse pattern and is typically a strongest upward trend that extends most of times. Wave (3) given move from 69 to 283
Wave (4): This is a corrective wave that moves in the opposite direction of wave (3). It is typically a retracement of wave (3). Wave (4) is currently in progress, but at verge of completion now any time.
Wave (5): This is the final wave in the impulse pattern and is typically a strong upward trend that completes the pattern. Wave (5) is expected to start soon and could potentially reach the levels of 300 plus.
I am not Sebi registered analyst.
My studies are for educational purpose only.
Please Consult your financial advisor before trading or investing.
I am not responsible for any kinds of your profits and your losses.
Most investors treat trading as a hobby because they have a full-time job doing something else.
However, If you treat trading like a business, it will pay you like a business.
If you treat like a hobby, hobbies don't pay, they cost you...!
Hope this post is helpful to community
Thanks
RK💕
Disclaimer and Risk Warning.
The analysis and discussion provided on in.tradingview.com is intended for educational purposes only and should not be relied upon for trading decisions. RK_Charts is not an investment adviser and the information provided here should not be taken as professional investment advice. Before buying or selling any investments, securities, or precious metals, it is recommended that you conduct your own due diligence. RK_Charts does not share in your profits and will not take responsibility for any losses you may incur. So Please Consult your financial advisor before trading or investing.
Elliottwavecount

XLE: Rising Wave PatternTechnical analysis chart of the Energy Select Sector SPDR Fund (XLE), with Elliott wave analysis overlaid. Let's break down the analysis based on the chart and labels:
Overall Analysis:
The chart suggests a bullish trend for XLE, based on the Elliott wave structure. It indicates that we have completed wave ((4)) of wave V and are now in the unfolding wave ((5)). Within wave ((5)), we have started wave (1), and are currently in wave (3) of (1).
Wave Counts and Labels:
V Red: This represents the fifth and final wave of a larger Elliott wave pattern.
((4)) Black: The fourth corrective wave within V.
((5)) Black: The fifth and final impulsive wave within V.
(1) Blue: The first impulsive wave within ((5)).
1 Red: The first wave within (1).
2 Red: The second corrective wave within (1).
3 Red: The third impulsive wave within (1) (currently unfolding).
Price Projection and Invalidation as per Waves:
Bullish Projection: The chart suggests a potential target of 105 for wave ((5)).
Invalidation Level: A break below 83.02 would invalidate the current bullish analysis.
Educational Notes:
Elliott wave theory is a technical analysis tool that identifies patterns in price movements based on a series of five waves.
Impulsive waves (1, 3, 5) move in the direction of the overall trend, while corrective waves (2, 4) move in the opposite direction.
Wave labels use brackets to indicate different levels of analysis. For example, ((5)) is a larger wave than (1).
Colors are often used to visually differentiate between different waves and patterns.
I am not Sebi registered analyst.
My studies are for educational purpose only.
Please Consult your financial advisor before trading or investing.
I am not responsible for any kinds of your profits and your losses.
Most investors treat trading as a hobby because they have a full-time job doing something else.
However, If you treat trading like a business, it will pay you like a business.
If you treat like a hobby, hobbies don't pay, they cost you...!
Hope this post is helpful to community
Thanks
RK💕
Disclaimer and Risk Warning.
The analysis and discussion provided on in.tradingview.com is intended for educational purposes only and should not be relied upon for trading decisions. RK_Charts is not an investment adviser and the information provided here should not be taken as professional investment advice. Before buying or selling any investments, securities, or precious metals, it is recommended that you conduct your own due diligence. RK_Charts does not share in your profits and will not take responsibility for any losses you may incur. So Please Consult your financial advisor before trading or investing.

From Correction to Impulse: Elliott Waves in Jindal Steel power Technical Analysis of JINDAL STEEL & POWER LTD. based on Elliott Wave Principles
This analysis uses Elliott Wave Theory and structures, offering one potential market scenario among multiple possibilities. The information is for Educational purposes only and should not be taken as trading advice . There is always a risk of being incorrect, and users should not make trading or investment decisions based solely on this analysis. The content does not guarantee profits, and we are not responsible for any financial outcomes. It is recommended to consult a financial advisor before making any trading or investment decisions.
Introduction to Elliott Wave Theory:
Elliott Wave Theory, developed by Ralph Nelson Elliott, identifies repetitive price patterns in financial markets, driven by investor psychology and crowd behavior. Here are some key Elliott Wave rules:
1. Wave 2 cannot retrace more than 100% of Wave 1.
2. Wave 3 is often the most powerful and cannot be the shortest of the impulse waves.
3. Wave 4 should not overlap with the price territory of Wave 1 (except in diagonal patterns).
4. Impulse waves move in five smaller waves (1-2-3-4-5), while corrective waves move in three waves (A-B-C).
Wave Counts and Analysis:
On the 2-hour chart of JINDAL STEEL & POWER LTD., the completion of Wave (4) in blue is likely at the 896 low. This corrective phase may have concluded, signaling the start of a new bullish impulse wave.
Current Structure: Wave (5) in Blue Unfolding
We may now be at the start of Wave (5) in blue, which suggests further upward momentum. Within this wave, the internal structure shows:
- Wave 1 in red of Wave (5) has been completed.
- Wave 2 in red of Wave (5) also seems to have finished, a typical pullback phase.
- Wave 3 in red of Wave (5) appears to be starting, signaling a potential strong upward move.
Characteristics of Wave 3:
Wave 3 is typically the most extended and powerful part of an impulse wave. It often accelerates rapidly, fueled by market sentiment, and can deliver outsized price gains. This wave is expected to push the stock price higher with more conviction.
Based on Fibonacci levels, potential targets for Wave 3 are:
- The first target could be 1020 (100% Fibonacci extension).
- A further target lies at 1076, the 1.618 Fibonacci extension, a common level for extended third waves.
- An extended target is 1111 at the 2.0 Fibonacci extension.
Moving Averages Confirmation:
Adding to the bullish outlook, JINDAL STEEL & POWER LTD. is currently trading above both the 200-period EMA and the 50-period EMA on the 2-hour, daily, and weekly timeframes, which signals strong strength to show upward momentum across multiple timeframes. The alignment of these exponential moving averages (EMAs) indicates that the stock is maintaining long-term support, which provides additional strength to the current bullish wave count.
Critical Level to Watch: 988
Once the price closes above the 988 level, we can expect further confirmation of strength. This price level is crucial as it would signal a breakout, paving the way for additional bullish momentum and targeting higher Fibonacci levels, such as 1020, 1076, and 1111.
Invalidation Level:
The wave count remains valid as long as the price stays above 896, the low of Wave (4) in blue. A break below this level would invalidate the current wave structure, implying that the bullish trend may be in jeopardy.
Summary:
In conclusion, JINDAL STEEL & POWER LTD. appears to have completed its corrective Wave (4) in blue, with the price now starting to unfold into Wave (5) in blue. With Wave 1 and Wave 2 in red complete, the stock is likely entering Wave 3 in red, which typically exhibits strong price advances. The stock’s upward trajectory is supported by its position above the 200-period EMA and 50-period EMA across multiple timeframes (2-hour, daily, weekly), further strengthening the bullish case. Key levels to watch include 1020, 1076, and 1111, while 988 acts as a near-term breakout level. The invalidation point for this wave count remains at 896.
I am not Sebi registered analyst.
My studies are for educational purpose only.
Please Consult your financial advisor before trading or investing.
I am not responsible for any kinds of your profits and your losses.
Most investors treat trading as a hobby because they have a full-time job doing something else.
However, If you treat trading like a business, it will pay you like a business.
If you treat like a hobby, hobbies don't pay, they cost you...!
Hope this post is helpful to community
Thanks
RK💕
Disclaimer and Risk Warning.
The analysis and discussion provided on in.tradingview.com is intended for educational purposes only and should not be relied upon for trading decisions. RK_Charts is not an investment adviser and the information provided here should not be taken as professional investment advice. Before buying or selling any investments, securities, or precious metals, it is recommended that you conduct your own due diligence. RK_Charts does not share in your profits and will not take responsibility for any losses you may incur. So Please Consult your financial advisor before trading or investing.

ULTRACEMCO: Wave ((iv)) Correction and Future ProjectionsTechnical Analysis on Exampled chart of Ultracemco Using Elliott Wave Theory
As always, this analysis is provided for educational purposes only and should not be taken as financial advice. Proper risk management and consultation with a financial advisor are recommended before making any trading decisions.
Understanding Elliott Wave Principles
Elliott Wave Theory is a robust tool used by traders to analyze market cycles and forecast future price movements by identifying repetitive wave patterns. One of the core principles of Elliott Wave Theory is that markets move in five waves in the direction of the main trend (Impulse Waves) followed by three corrective waves (Corrective Waves). These waves are labeled numerically as 1, 2, 3, 4, 5 for impulse waves and alphabetically as A, B, C for corrective waves.
A few key rules and guidelines include:
Wave 2 cannot retrace more than 100% of Wave 1.
Wave 3 is usually the longest and never the shortest among waves 1, 3, and 5.
Wave 4 should not enter the price territory of Wave 1 (in a standard impulse wave).
Additionally, corrective waves come in various forms like Zigzags, Flats, and Triangles, and these patterns provide insight into the market’s corrective phases.
Current Wave Count and Analysis
On the daily time frame of Ultracemco, the price action has been unfolding within an Elliott Wave structure, and as of the latest data, the market appears to be in the process of completing wave ((iv)) in black.
The chart shows that the recent price action likely represents a corrective wave ((iv)), unfolding as an (a)-(b)-(c) structure, where wave (a) has been completed, wave (b) has bounced as a corrective upward swing, and wave (c) is currently progressing downward.
Key Observations for Wave ((iv)):
Depth of Correction: The retracement level of wave ((iv)) typically spans between 38.2% to 50% of wave ((iii)). The current retracement indicates that wave ((iv)) could find support around these levels, aligning with typical Elliott Wave corrective behavior.
Equality of Waves (a) & (c): One common characteristic within a Zigzag pattern is that wave (c) often equals wave (a) in terms of length. This potential equality provides a target zone for the completion of wave ((iv)).
Retracement of Wave ((iii)): The analysis of wave ((iv)) should also consider the Fibonacci retracement levels of wave ((iii)). A significant support area is found near the 50% retracement level of the prior wave ((iii)), which could act as a pivot point for the next upward move.
Potential Outlook for Wave ((v))
Once wave ((iv)) finds its completion, the next expected move is an upward swing as wave ((v)), which should unfold in an impulsive manner. Wave ((v)) often represents the final thrust in the direction of the trend and is typically characterized by strong momentum and breadth.
Characteristics of Wave ((v)):
Extension: Wave ((v)) may extend, particularly if wave ((iii)) was relatively short. In such cases, wave ((v)) could push the price higher than expected, sometimes exceeding the previous high established by wave ((iii)).
Fibonacci Projections: A common target for wave ((v)) can be projected using Fibonacci extension levels of waves ((i)) through ((iii)). The 61.8%, 100%, and 161.8% extension levels serve as potential price targets.
Volume and Momentum: Increased volume and momentum usually accompany wave ((v)) as it represents the final push in the direction of the prevailing trend. Traders should watch for any divergences in momentum indicators, as they often signal the end of the impulse wave and the start of a corrective phase.
Conclusion
In summary, the analysis suggests that Exampled chart of Ultracemco is likely completing wave ((iv)), with potential support zones emerging as the market corrects. Following the completion of wave ((iv)), the price is expected to rise in an impulsive wave ((v)), targeting new highs. However, it's crucial to remember that Elliott Wave analysis involves multiple possibilities, and traders should consider these insights as part of a broader trading strategy rather than standalone advice.
I am not Sebi registered analyst.
My studies are for educational purpose only.
Please Consult your financial advisor before trading or investing.
I am not responsible for any kinds of your profits and your losses.
Most investors treat trading as a hobby because they have a full-time job doing something else.
However, If you treat trading like a business, it will pay you like a business.
If you treat like a hobby, hobbies don't pay, they cost you...!
Hope this post is helpful to community
Thanks
RK💕
Disclaimer and Risk Warning.
The analysis and discussion provided on in.tradingview.com is intended for educational purposes only and should not be relied upon for trading decisions. RK_Charts is not an investment adviser and the information provided here should not be taken as professional investment advice. Before buying or selling any investments, securities, or precious metals, it is recommended that you conduct your own due diligence. RK_Charts does not share in your profits and will not take responsibility for any losses you may incur. So Please Consult your financial advisor before trading or investing.

Wave Theory in Motion: Understanding Key PatternsElliott Wave Analysis:
Example used chart of Eicher Motors (NSE: EICHERMOTORS)
This analysis is provided for educational purposes only and does not constitute trading or investment advice. All wave counts are subject to change as the market evolves. Always consult with a qualified financial advisor before making any trading decisions.
Overview:
In this analysis, we will delve into the current market structure of Eicher Motors through the lens of Elliott Wave Theory. The focus will be on identifying the wave count, potential price targets, and critical invalidation levels.
Wave Count:
Starting from the low at 4253, we have a clear impulsive structure labeled as wave (i). This wave consists of five smaller sub-waves, denoted by i, ii, iii, iv, v. The subsequent correction, wave (ii), retraced part of this impulsive move, unfolding in a typical corrective pattern, which then led to wave (iii). This wave extended higher, reflecting strong bullish momentum, followed by waves (iv) and (v) completing the impulsive sequence near 4976 where we had labelled as wave 3 completed.
From there, an Expanded Flat corrective structure began, identified as a ((a))-((b))-((c)) pattern, which seems to have completed near ₹4,548. This marks the end of wave 4, a corrective wave within a larger impulsive sequence. Currently, the stock appears to be in the early stages of a new impulsive wave, labeled as wave (i) of a higher-degree wave ((i)) of one more higher degree wave 5.
Elliott waves Theory based Target Assumptions:
Given that wave 3 of the previous impulsive move ended around 4976, we anticipate that wave 5 should extend beyond this level. The first target for wave 5 would be around 5000, If momentum is strong, we could see further extensions.
Invalidation Levels:
Critical to any Elliott Wave analysis is understanding where the wave count might be invalidated:
Nearest Invalidation Level: A break below 4548 would invalidate the assumption that wave (v) of wave C has completed. This would suggest that the corrective wave 4 is still ongoing or that a different corrective structure is forming.
Main Invalidation Level: Should the price fall below 4253.85, it would invalidate the entire bullish wave count, implying that a much larger corrective pattern is unfolding, or a change in the trend direction is occurring.
Conclusion:
Eicher Motors is showing signs of a potential new impulsive move to the upside, However, traders should keep a close eye on the invalidation levels at 4548 and 4253.85. Breaching these levels would require a reevaluation of the current wave structure and could signal a deeper correction.
I am not Sebi registered analyst.
My studies are for educational purpose only.
Please Consult your financial advisor before trading or investing.
I am not responsible for any kinds of your profits and your losses.
Most investors treat trading as a hobby because they have a full-time job doing something else.
However, If you treat trading like a business, it will pay you like a business.
If you treat like a hobby, hobbies don't pay, they cost you...!
Hope this post is helpful to community
Thanks
RK💕
Disclaimer and Risk Warning.
The analysis and discussion provided on in.tradingview.com is intended for educational purposes only and should not be relied upon for trading decisions. RK_Charts is not an investment adviser and the information provided here should not be taken as professional investment advice. Before buying or selling any investments, securities, or precious metals, it is recommended that you conduct your own due diligence. RK_Charts does not share in your profits and will not take responsibility for any losses you may incur. So Please Consult your financial advisor before trading or investing.

PLTR - Earnings pop incoming?I've put a lot of thought into this one. This chart is in log mode as the wide range of prices covered are smoothed and reveal the potential true picture. I give a primary bullish scenario but caveat with multiple different potential outcomes given certain price actions. Trade at your own risk.
As you can see, PLTR put in a significant top near the 61.8% retracement of the major move down from January 2021 to January 2023. In linear mode, it's also a 61.8% retracement (not shown on chart) of the September 2021 top from the January 2023 bottom, further confirming how much of a massive resistance level it is.
Elliot Wave indicates that this was a 3rd wave in a 5-wave upward impulse. For that to be true, PLTR will need to hold the $12 area if it is going to continue down leading into earnings. Should it hold there, the potential for an earnings pop is at our fingertips. If you look at the 2nd wave of the current 5-wave move up, the same thing happened with earnings there leading to a massive move upward into our very explosive 3rd wave.
This leads to our buying opportunity. Should we see PLTR dip below $15 today through Wednesday, October 27th, it would be in the accumulation zone. Set your stop at $12.00 with a GTC-EXT order. This should limit your losses should earnings kickstart a further downward move that breaks support.
Assuming the 5th wave does engage, the potential targets are outlined on the chart. I must caveat though that 5th waves are unpredictable. They can terminate before, at, or higher than the general expected levels. In Elliott Wave, usually only one of the 3 impulse waves (1,3, and 5) will see an extension. With 3rd waves usually targeting the 161.8% fib extension level, the 5th wave target is generally expected to be the 200% level. With every 3rd wave extension level, you can usually expect the 5th wave level to rise the same number of extension levels. In this case, the 3rd wave extended and surpassed the 176.4% level, one extension level above the standard, and came shy of the 200% level. So the general minimum expectation for our 5th wave target should be a minimum of the 223.6% level, which comes in at around $25. Given that the 3rd wave already extended, it should not be expected that the 5th wave will also extend. If it somehow does, the upper target is a gap fill from February on 2021 at $31.34. Profit is generally taken at the minimum level with some runners left for potential upside.
Should PLTR start rising and form an upward pattern prior to hitting my ideal 4th wave target in the mid $12's, it is possible the 4th wave is already in (or maybe it touches the mid $13's one more time). I will add that the shape and structure of a 4th wave that terminates in the $13's holds a far more likely chance of becoming a a descending triangle where the bottom holds flat and the tops terminate lower until the pattern ends. If this were a triangle, it would be most likely that the next touch of the mid $13's would be the c wave with an e wave to come in the $17 range and the e wave to again target the $13's. Due to the nature of the current structure, I only favor a significant earnings pop should PLTR fall to $13 or lower.
Should you see PLTR dip below $12, then the expectation shifts to a major top being in and downward pressure taking this to $10 and potentially lower. Therefore, below $12 range and I recommend getting out and waiting for further clarity. If you hold at a basis higher than the previous top and don't want to sell, consider selling calls to lower your basis or selling $10 puts.
The alternate count not shown on this chart would have the May 2021 low as an A wave, the September 2021 top as a B wave, and the January 2023 bottom as the C wave in a larger degree (A)(B)(C) long term corrective pattern. The recent top at the 61.8% level would be the 3-wave (B) wave of this larger degree, with the bottom (C) wave coming in at new lows over the next 1-2 years. This is why the stop is so important.
Readers should always remember that markets are their own creature made up of millions of individuals and institutions each following some combo of inherent bullishness, inherent bearishness, fundamentals, technicals, stupidity, and pure emotion. Elliott Wave, and specifically Fibonacci Pinball (developed by Avi Gilburt at elliottwavetrader.net and prominent Seeking Alpha author), merely provide a framework based on the observed price action to date. I know that while my wave outline is based on years and years of data and application from not only me, but some of the best in the game, I also know that markets do not follow a set path and that sentiment can remain irrational far longer than I can remain rational. That is why you MUST consider the altneratives and manage risk appropriately. Know the pivot zones that could lead to the primary path failing. In this case, it's the low $12.00 range.
I warrant that the information created and published by me on TradingView is not prohibited, doesn't constitute investment advice, and isn't created solely for qualified investors. My analysis is not a recommendation for a specific trade. My analysis outlines a potential scenario and provides risk assessments for multiple alternate scenarios.
-mazag08 - TastyWavez 2023

Ttrak (Türk Traktör) Flat CorrectionThis could be one of the strong possibilities out there...
Don't know what could be the factor or news but after comleting last up move to finish wave B of a flat we can expect strong impulsive C wave to complete Wave 4.

XAUUSD | Expanded Flat W2 CorrectionMy thesis regarding gold is simple—an Expanded Flat correction for Wave 2.
The primary rationale for this determination lies within the retracement on completion of the initial 5-Wave move up on completion of WA. From my perspective, this retracement exhibited insufficient depth to be counted as a W2. Reverting to what I call the Elliott Wave Theory paradox, if it is not a W2, it must be a WB.
Therefore, the following move completed WC of WB, with PA now residing in W1 of WC of an Expanded Flat which is forming as W2.
I expect PA to push to the 1.618 FIB to confirm that the bottom is in before launch.
Safe Trading.

ETH MacroI have enjoyed my Macro BNB post, occasionally checking it and pressing play on the chart to see how PA is behaving IAW my expectations.
So here is one for ETH...
I am not a bear, I am the Honey Badger, I chart what I see and surf the waves.
This count is Valid, if you disagree, I invite a healthy debate to enable all of us a more holistic understanding of the market!
Trade Safe.

NAS | Wave B?Are we already in a Bear Market?
I don't know... The chart seems to be suggesting it...
What do you think?

UPDATE: DOW JONES INDUSTRIAL (US30)Last time i expected 1 more high at 34000-34400 (as Ending Diagonal on C) to start downtrend, it failed.
This is my new perspective on Dow Jones (US30), i strongly believe there will be a bearish to come.
Kindly remember, Elliott Wave is highly subjective, i will post if there's a new update on my perspective.
Trade safe, Everyone!
Cheers.

BTC Week 2 Analysis—October 2023Disclaimer:
Please be aware that the information provided in this article is for educational and informational purposes only. It should not be considered financial advice. Trading and investing in financial markets carry inherent risk, always conduct your own research and, if necessary, consult a qualified financial adviser prior to making any investment decisions.
Introduction:
Welcome to our BTC Weekly Analysis for October, Week 2, 2023. This analysis offers continued insight into BTC price action, committed to providing an unbiased Elliott Wave Theory (EWT) analysis for the greater trading community. Our objective is to offer valuable insights that complement your own analysis, empowering you to make well informed trading decisions.
Primary Assumption:
Our October, Week 2, analysis builds upon the data presented in our Week 1 Analysis. During the correction, which we initially assumed to be Minutte Wave 4, we identified three significant errors in our count, subsequently confirming that the correction was Minute Wave 4. To get a detailed account of this correction, click the chart bellow.
Consequently, we maintain that the count established during the Minute Wave 4 correction remains valid. Therefore, we have established a second count invalidation point at which we believe to be the beginning of Minute Wave 5.
Weekly Analysis:
Our weekly analysis takes place on a compressed 15 Minute time frame. In our previous weekly analysis, we anticipated a complex correction after an Extended Wave 3 and Wave 5, ultimately leading to Wave 5 forming as an Expanding Ending Diagonal.
To summarize from the completion of Minute Wave 3, Minutte Wave W unfolded as a Zig Zag correction, with an Expanding Triangle for Micro Wave B. Following this, an Impulse pattern emerged but failed to establish a new trend, signifying the commencement of the first Minutte Wave X. Price action then shaped a second Zig Zag, with an Expanding Triangle forming as Micro Wave B, and Sub Micro Wave E. Following the conclusion of this second Zig Zag, price action Impulsed once again but failed to initiate a new trend. Instead, it formed a Contracting Triangle, marking the end of the second Minutte Wave X. As market fear intensified, price action Impulsed down, effectively concluding Minutte Wave Z, marking the completion of Minute Wave 4, with price now residing in Minute Wave 5.
Minute Wave 5 commenced as an Impulse with an Expanded Wave 3 for form Minutte Wave 1. Minutte Wave 2 revealed market uncertainty as it evolved into a complex correction, with Micro Wave W forming a Zig Zag. Price action Impulsed upon completion failing to establish a new trend, instead, forming as an Expanding Triangle, completing the first Micro Wave X. Micro Wave Y assumed the form of a Zig Zag correction, with price action subsequently experiencing two impulses in opposite directions, completing the second Micro Wave X and Micro Wave Z of the correction, concluding Minutte Wave 2.
Minutte Wave 3 began with a 1-2, 1-2, 1-2 pattern, resulting in an Expanded Wave 3 within an Expanded Wave 3, of Sub Minutte Wave 1. The correction that took place upon the completion of Micro Wave 3 became an Expanded Flat, with Wave B extending beyond the endpoint of Micro Wave 3. On completion of the the Expanded Flat price action Impulsed into the completion of Sub Minutte Wave 1, with price action now residing in Sub Minutte Wave B of Minutte Wave 2.
Forecast:
While predicting future price action is an ambitious endeavor, adhering to EWT rules and guidelines allows us to make informed assumptions about what price action may do. Currently, we assume that price action resides in Micro Wave B of Sub Minutte Wave 2.
Our hypothesis suggests that price action is in the process of forming a Triangle, with Wave D yet to complete, indicating the ongoing development of Sub Minutte Wave 2. Once the Triangle is fully formed, it will signal the conclusion of Micro Wave B, leading to an Impulse to finalise Micro Wave C and Sub Minutte Wave 2. Employing standard Contracting Triangle measurements, we can anticipate the price action target to align with the typical measurements for Wave 2, with a projected bottom approximately around the Yellow 0.707 level indicated on the chart.
Upon completing Sub Minutte Wave 2, price action will Impulsie into Micro Wave 1 of Sub Minutte Wave 3. Following a five-wave impulse, which may coincide with the Weekly candle high, price action will form a Zig Zag correction, guided by the Law of Alteration. This correction is expected to carry us through to the end of October Week 3.
Conclusion:
In conclusion, our EWT analysis for Week 2 has illuminated the evolving structure of BTC price action, building on the previous weeks observations. While predicting future market movements is inherently uncertain, our analysis points to a potential path for BTC price action.
Stay vigilant and use this analysis as a valuable tool to complement your trading decisions.

The Wave 4 Correction is over...No need to sweat, the bears have ran out of steam, the correction is over.
If you followed my count of the Wave 4 correction, you would have known I have called the bottom.
Here is a quick rundown of how I see the next two weeks playing out.
Let me know what you think...

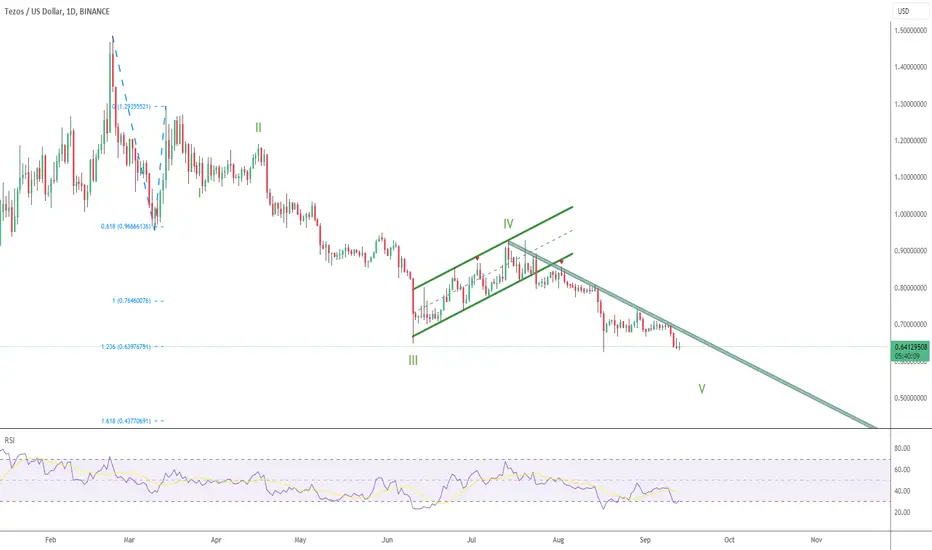
XTZ Wave 5
The broken flag from my previous post led to new lows as expected.
In my primary count, we are already on green wave V, which would soon lead us to bullish price action.
But soon doesn´t mean now... I´m waiting for further price action to see if bulls step in, beginning with a break of the green descending trendline.
XAUUSD DAILY TIMEFRAMELower timeframe perspective attached down below.
Elliott Wave is high subjective, i will post if there's a new update on my perspective.
Trade safe, Everyone!
Cheers.

BNBUSDT Bearish ImpulseBearish Impulse wave in development. Technical analysis up-to-date. After the fake-out from the major contract triangle, we can see clearly the direction of an inexorable leg downward. New levels for watch. Price action is currently retracing to the micro supply @ 239 region.

Nifty Elliottwave update 04/07/2023Hello everyone,
Here is our update on NIFTY in ELLIOTT WAVE perspective.
Nifty is about to complete 5th wave.
Note: we have shared this info for education purpose only, not a recommendation, we are not responsible for your profits or losses, always trade with your own risk.

How to Count Waves Using Chart Patterns?We can count waves using traditional patterns like Head and shoulders, Double Top and Bottom,
Triangle, cup & handle, etc. This article is about how you can count waves by identifying chart patterns.
I have covered Three chart patterns in this article,
1) Triangles
2) Head and shoulders
3) Double Top and Bottom
1) Head and shoulders:
In addition, the two lows formed when the price failed to rise and fell back down were basically at the same level. The horizontal line is often referred to as the "neckline" When the price fails to fall back for the third time neckline will break. So "head and shoulders" was officially established.
Changes in volume with head and shoulders:
During the formation of "head and shoulders", the left shoulder has the largest volume, the Head has a slightly smaller volume, and the right shoulder has the smallest volume. The phenomenon of diminishing trading volume shows that when the stock price rises, the chasing force is getting weaker and weaker, and the price has the meaning of rising to the end.
Operation plan after the Head and shoulders appear:
When the head and shoulders formed, you can decisively follow up the short order. The formation of the head and shoulders indicates the beginning of a new round of decline in the market, and the minimum drop is the distance from the head to the neckline. The profit is very substantial. Therefore, studying the formation of the Head and Shoulders is also a necessary analysis process for band enthusiasts.
Wave Count:
The left shoulder: wave 3/A.
The first touch on the neckline: wave 4/B
Head: wave 5/C
The second touch on the neckline: wave A/1
The right shoulder: wave B/2
The ending point of the right shoulder: wave C/3
2) Triangles:
These are the most commonly used triangle patterns. In this motion, we are going to understand the triangle in terms of the Elliot wave. We'll be talking about the classical triangle pattern in an upcoming educational series.
Wave Count:
A triangle forms in corrective waves. There are Four corrective waves in Elliott wave theory. The corrective waves are 2,4, B, and X.
There are four waves in a triangle which are A, B, C, D, E.
The starting point of wave A of the triangle is the ending point of impulsive wave 1/3/A/W. After the completion of wave E of wave 1/3/A/W, the Impulsive wave will initiate.
3) Double Tops and Bottom:
In the chart, you can sometimes see the stock price fluctuations. The stock price fell back after reaching the highest price. After some sorting, it rose again to near the previous stock price level and then fell back. Two "normally highs" The high point is formed on the circuit diagram and will not be seen again in the short term.
Wave Count:
In a Bull market, The first Top of the pattern represents the completion of the impulsive wave. The ending point of the Impulsive wave is the starting point of the corrective wave.
I started the wave count from the first Top and labeled it as A, B, and C waves.
In a Bear Market, The first Bottom of the pattern represents the completion of the impulsive wave. The ending point of the Impulsive wave is the starting point of the corrective wave.
I started the wave count from the first Bottom and labeled it as A, B, and C waves. After wave C is complete, we can ride the impulsive waves.

XAUUSD 4-H TIMEFRAMEElliott Wave is highly subjective, i will post if there's a new update on my perspective.
Trade safe, Everyone!
Cheers

Equinor (EQNR) Roadmap 2023Equinor is showing clear signs of Elliott Wave structure from it's ATH.
Tracking this as wave 4 still in progress, and will be looking for a correction of this downtrend upon completion of the fifth wave.
All in all, a simple roadmap on what to expect for the rest of the year.

Predicting the bottom of AvalancheAVAX/USDT.P on BYBIT
Looks like the W-X-Y pattern is coming to an end and we will try to predict the bottom as best we can to catch a swing trade of wave C or even a 3 and a new rally.
If the count is right and the weekly support level at 13.910 does not hold, a one to one (of the W-X-Y) price target will be next. We could speculate the weekly level then will serve as a SR flip to confirm the start of the last wave 5.
Watch out for the weekly bar ending as a spinning top or doji for a bullish reversal up to wave 4 of 3 of C of Y in the last zig zag.
Risk
For me the stop level would be either right under weekly level at 12.180 or at the low of 10.535 also giving a double bottom setup. If we se it go all the wave to the high of wave A we could se a Risk/Reward ratio at a proximally 6.
Targets
First target for locking in profit would be the weekly level at 13.910 then we have the point of control for the whole correction at 17.285 and the high of A or 1 at 22.795.
Avalanche Market Cap
Avalanche market cap is now ricing to $4,741,712,576 and as of writing the trading volume (24h) is $132,773,075.
Conclusion
I will continue watching the price action on Avalanche and if it will continue to decline and unfold in way similar to the predicted pattern. It could be an interesting swing trade to the upside for a low risk.

Nifty50 Day end analysis: 2023.05.17Elliott Wave Analysis for Nifty50
Nifty 50 has probably completed Wave a today for ABC corrective pattern today and is midway into Wave B.
View for 2023.05.18 is bullish for first half and bearish for second half.

💸U.S.Dollar Index, 1792 to date●● Preferred count
◉ U.S. Dollar Currency Index (DXY), 🕐TF: 1M
Fig.1
The counting of long-term waves has not changed. I still think that there is still a possibility of a correction to the area of the previous wave (IV) . On the other hand, of course, it should be understood that the fourth waves in most cases form lateral corrections with an overlap and do not always reach the area of the previous fourth. And is it a wave ((IV)) at all? I am sure that as the structure develops at lower time intervals, hints will appear and the least likely scenarios will be cut off.
_______________________________________
◉ TVC:DXY , 🕐TF: 1W
Fig.2
In the meantime, we can make an assumption that the wave structure of wave c becomes more complicated to a double zigzag with a triangle in the sub-wave Ⓧ , but the combination and the flat are also not excluded.
On the six-hour chart, the sub-wave Ⓧ in the form of a flat will be marked in black .
_______________________________________
◉ TVC:DXY , 🕐TF: 1D
Fig.3
We were able to predict the completion of wave (B) and the subsequent reversal in wave (C) with high accuracy.
Wave (C) is expected to take the form of a single zigzag subdividing into diagonal A and impulse C . The target may be the lower boundary of the ascending channel.
_______________________________________
◉ TVC:DXY ,🕐TF: 6h
Fig.4
For you, my dear readers, I can suggest a few trading setups that will appear in the near future:
The completion of diagonal A is a signal in favor of fixing a short position. Aggressive trading setup for opening a long position with a protective stop loss at the level ((v)) > ((iii)) .
The completion of the subsequent wave B (preferably in the form of a triangle) is a trading setup for opening a short position.
_______________________________________
_______________________________________
●● Alternative count
◉ TVC:DXY ,🕐TF: 1W
Fig.5
The option of counting wave Ⓧ in the form of a flat ( color marking) we have already discussed earlier. On this chart, it would be more correct to focus on an alternative marking, which suggests considering wave (b) of the supercycle degree from the position of the completed running flat a-b-c , in which wave c is an impulse ①-②-③-④-⑤ . A confident breakdown of the upward channel down can serve as a good signal in favor of this hypothesis.
______________________________________________
📚 Elliott Wave Guide & Ellott Wave Archive ⬇️⬇️⬇️⬇️
