BTC 10-year rough estimate EW & FibAnything's possible when you're working with a finite asset in a world where:
Inflation is constantly rising and multiple fiat currencies continue to fail.
New sources for rare earth elements and precious metals are constantly being discovered.
The overall output of society continues to rise.
This is a (very) rough estimate based on Elliot Wave Principle and Fibonacci (price & time) retracements/extensions.
Elliottwaveforecasts

TIA - Celestia Incoming Rejection - Buy Opportunity Inbound!I believe Celestia sweeping the ATH (all time highs) will result in a rejection from the famous expanded B pocket at 21.5 USD. This in the macro scale is very bullish type of pattern so the C wave would be seen as a good buying opportunity for the start of the 3rd macro wave, the most bullish wave of an impulse.
Lots of money to be made in that wave, and the C wave pullback is the last buying opportunity for it.
How do you plan on navigating this? Will you buy more on the pullback or do you not have any TIA? Let me know in the comments.
-NewWave Traders

If crude oil breaks down then USD can stop at resistanceHey guys,
Crude oil came down recently, which can help inflation to come down as well if energy market will continue to decline. In fact I see nice bearish pattern, so my assumption is that US yeilds and USD can be trading at resistance.
In this video I will also look at the chart of the 10 year US yeilds where I see greater chance for a drop to 3% rather than rally back to 5%.
Hope you will enjoy the content.
Grega

$PLTR ELLIOT WAVE ANALYSIS This analysis reflects my perspective on NYSE:PLTR through the lens of Elliott Wave theory. I acknowledge the potential for error and welcome any feedback or alternative viewpoints.
After thorough analysis, it seems that NYSE:PLTR has concluded its impulsive phase and is now set for a significant downward movement. Currently navigating through sub wave C of wave 2 correction, it's anticipated to retrace to approximately the 0.618 retracement level, marked by the green rectangle, which serves as a pivotal point due to robust support. Although this projection isn't definitive and relies on typical wave 2 correction patterns, it provides a useful estimate for potential price movement.

Part 1 - EUR/USD: Monthly Examination Utilizing Varied Approach
Price action Breakdown Analysis:
It is the EURUSD monthly timeframe, and it shows a downtrend for more than 15 years. The price has settled in a downward value area.
Elements of price action Breakdown:
Excess:
There are nine price excesses, four on the upper band and five on the lower band. It shows that the sellers were too aggressive when the price touched the upper band of the channel in comparison with the lower band at buyers. Buyers/Bulls tries makes the initiative to breakout the structure but end up when another party finds the price convenient for them.
Control line:
The control line represents the gravitational force to the price. The price can’t stay away until it breaks the range. There are twelve touches on the control line, and few are mentioned on the chart.
No Trading Activity Zone:
No trading activity is the zone where one party, either bull or bear, takes control and outnumbers the other. There are a total of 14 no-trading activities zone. Both of the participants have seen each other.
Sub-value area:
A rectangle sub-value area has taken place from March 2015 till now. An excess became a great place to buy the move, yet the upper band of the sub-value area provides strong resistance. The control line of this value area at 1.1480 is sharp enough to act as a pivot level. It could be a resistance to the current price.
Trend Justification:
Justification for the current market trend and the behavior of bulls and bears can be derived from four prominent lines on the chart.
Line 1, the lengthiest on the chart, connects the points from 1.5760 to the latest high at 1.2555 . This line also intersects with the second line, indicating that a breakout in one line would likely trigger a simultaneous breakout in both lines.
Line 2 stands out as the most robust resistance line, evidenced by the price experiencing significant declines on more than three occasions upon reaching this line. Therefore, the continuation of the uptrend appears contingent upon a successful breakout above resistance line 2.
Line 3 , marked at 1.23427 , serves as a horizontal resistance line. This line has played a crucial role, offering three supports and encountering two resistances. A substantial upward movement could potentially alter the overall trend post-breakout, given that it represents a lower high in the downward trend.
Line 4 represents a support level in close proximity to the current price, suggesting a potential stabilizing factor for the market at its current position.
Elliott Wave Projection:
According to Elliott wave analysis, the price has been undergoing a W-X-Y-X-Z formation, specifically identified as a triple zigzag, over a span of 15 years. The sequence involves the completion of wave (X) and the initiation of a downward impulsive wave denoted as (Z).
The Wave Formation unfolds as follows:
Wave (W): A flat correction pattern characterizes the formation of Wave (W).
Wave (X-1): Wave (X) takes shape in a standard zigzag formation, retracing 78.6% of Wave (W).
Wave (Y): This phase sees the construction of a zigzag pattern within Wave (Y), extended 1.618% of Wave (W)
Wave (X-2): Wave (X) materializes as an expanding triangle, retracing 50% of Wave (Y).
Wave (Z): The ongoing Wave (Z) is currently in progress, appearing to form sub-wave C. Notably, Wave (Z) has extended to 78.6% of Wave (Y).
For Bulls traders, a prudent entry point is identified as the breakout of Wave (X) at the level of 1.2349 . No risky trader should initiate Long position until it breaks out Line 1 & Line 2. Wave (Y) = Wave (Z) at 0.8838. So, After the accomplishment of sub-wave B of wave (Z), traders can sell for final wave C of wave (Z).
Different pattern Formation:
Traders can see the following patterns on the monthly charts:
1. Wamine pattern
2. Contracting Triangle
3. Wave Diagonal
4. Expanding Triangle
5. ABCD Pattern
6. Moolahs pattern
We will Update Further information on weekly & Daily time frame soon.

Regular Flat : Elliott Wave Correction Regular Flat : Elliott Wave Correction
Identified By student which shows the complete formation of Elliott wave flat correction
which is following basic the rule of subdivision of wave as 335 .
Although Find the basic rule for flat correction for your prectice :
REGULAR FLAT :
1- A Corrective 3 waves move labelled as ABC
2- Subdivision of wave A and B is in 3 waves
3- Subdivision of wave C is in 5 waves impulse / diagonal
4- Wave B Terminates about the beginning of Wave A
5- Wave C Can Terminate Till End Point of Wave A
6- Subdivision of wave A and B can be in any corrective 3 waves structure including zigzag, flat, double three, triple three

$W ELLIOT WAVE ANALYSIS This analysis reflects my perspective on NYSE:W through the lens of Elliott Wave theory. I acknowledge the potential for error and welcome any feedback or alternative viewpoints.
Based on my analysis, it appears that NYSE:W has completed its corrective phase and is now poised for a robust bullish trajectory, forming a leading diagonal pattern. Both wave 4 and its sub wave B seem to have concluded, leaving only sub wave C and wave 5 remaining for completion. I anticipate wave 5 reaching approximately the 0.764 extension before undergoing a corrective phase in line with wave 3.

$DAL ELLIOT WAVE ANALYSIS This analysis reflects my perspective on NYSE:DAL through the lens of Elliott Wave theory. I acknowledge the potential for error and welcome any feedback or alternative viewpoints.
Please note that the unfulfilled waves are provided for contextual reference and do not indicate precise targets. Based on my assessment, it appears that NYSE:DAL is currently in wave 3, suggesting strong bullish sentiment for the foreseeable future.

$BABA COORECTED ELLIOT WAVE ANALYSIS In my Elliott Wave analysis of BABA, I've observed a corrective pattern since its inception, with the peak occurring during the 2020 bull market. The correction seemed to have ended when BABA hit bottom in 2022. Following this, it appeared to start a new upward wave (wave 1), followed by a corrective phase (wave 2), which now seems to be complete. It's important to note that the placement of the other waves is solely for identification purposes and does not indicate any specific targets. This suggests that BABA could be gearing up for a bullish wave 3, making it quite promising for the long term.

$BABA COMPLETE ELLIOT WAVE ANALYSIS Based on my Elliot Wave analysis of NYSE:BABA , it appears that the stock has been following a corrective pattern since its inception, with the peak occurring during the 2020 bull run. Since then, it has been in wave B, currently progressing into subwave C of wave B. The trend is strongly bearish, indicating a downtrend.
I anticipate wave B to conclude around $18.90, although this is an estimation derived from Fibonacci ratios and could potentially fluctuate between $58.01 and $18.90. However, considering the length of sub wave A, the likelihood leans towards the $18.90 mark.

CHAINLINK ELLIOT WAVE ANALYSIS Navigating this chart poses quite a challenge given the intricacies of the candlestick formations. Despite this complexity, I've endeavored to apply my understanding of Elliott Wave Theory to analyze and potentially forecast future movements. However, I acknowledge the possibility of error, whether it's due to miscounting waves or other factors. I welcome alternative perspectives and suggestions.
Upon studying the chart, it appears that CHAINLINK has been undergoing a corrective ABC wave pattern since its inception, reaching a peak in 2021 before embarking on a corrective phase. The analysis becomes particularly nuanced due to nearly a year of consolidation, forming a triangle pattern likely indicative of the final wave C within its correction. If my interpretation is accurate, CHAINLINK has recently completed wave 1 and is poised for a correction with wave 2. This correction may target the 0.764 extension level or potentially fall below it. At present, the short-term trend appears bearish while the long-term outlook leans bullish.

BTC ELLIOT WAVE ANALYSISIn my evaluation of BTC using Elliott Wave analysis, I've observed that following its peak in 2021, BTC underwent a significant correction on a larger timeframe. This correction could manifest as either a flat corrective pattern or an extended wave B. Presently, we find ourselves within sub wave C of the overarching wave B, specifically in wave 4 of sub wave C.
While I remain uncertain whether wave 4 has concluded, I anticipate its completion by the next week. If the market exhibits an upward movement during this period, it will signify the conclusion of wave 4, paving the way for the initiation of wave 5 targeting the ATH (All-Time High). I welcome and am open to any opinions or suggestions for refining this analysis.

$TSLA COMPLETE ELLIOT WAVE ANALYSIS According to the Elliott Wave theory, NASDAQ:TSLA has been following a corrective wave pattern (ABC) since its inception, reaching its peak during the 2021 bull run. Currently, NASDAQ:TSLA has completed both wave 1 and wave 2, entering the critical and highly impulsive wave 3 towards the downside of the Elliott Wave sequence. The fundamental outlook for NASDAQ:TSLA appears weakened due to intense competition in the market. In the long term, NASDAQ:TSLA is displaying a heavy bearish trend.
While specific targets for the remaining waves are uncertain at this time, one thing is clear – NASDAQ:TSLA is not expected to surpass wave 2, which is positioned at $299.

Navigating ABCAPITAL's Elliott Wave JourneyWeekly Time Frame:
Elliott Wave Analysis: ABCAPITAL has completed wave (4) in Blue on the weekly time frame and is possibly unfolding wave (5) in Blue.
Current Stage: A closer look at the daily time frame reveals the completion of wave 1 in Red, and a potential near-completion of wave 2 in Red.
Invalidation Level: Strict invalidation set at the low of wave 1 in Red, pegged at 155.
Daily Time Frame:
Next Phases: Anticipating the commencement of wave 3, followed by wave 4 and wave 5 in Red, completing wave (5) in Blue on the weekly.
What if Scenario:
Break Below 155: If the price breaks below 155, the low of wave 1 in Red, we might assume a more complex correction with the possibility of double corrections within wave (4) on the weekly.
Risk Management:
Traders are advised to incorporate risk management strategies, including setting stop-loss levels to mitigate potential losses.
I am not Sebi registered analyst.
My studies are for educational purpose only.
Please Consult your financial advisor before trading or investing.
I am not responsible for any kinds of your profits and your losses.
Most investors treat trading as a hobby because they have a full-time job doing something else.
However, If you treat trading like a business, it will pay you like a business.
If you treat like a hobby, hobbies don't pay, they cost you...!
Hope this post is helpful to community
Thanks
RK💕
Disclaimer and Risk Warning.
The analysis and discussion provided on in.tradingview.com is intended for educational purposes only and should not be relied upon for trading decisions. RK_Charts is not an investment adviser and the information provided here should not be taken as professional investment advice. Before buying or selling any investments, securities, or precious metals, it is recommended that you conduct your own due diligence. RK_Charts does not share in your profits and will not take responsibility for any losses you may incur. So Please Consult your financial advisor before trading or investing.

VIP INDUSTRIES CHARTTechnical Analysis of VIP Industries Chart: Wave Sequence and Current Outlook
This research provides a concise overview of the wave sequence observed in the chart of VIP Industries. The analysis covers four waves, detailing their completion points and current status, with a focus on the ongoing Wave 4. The possibility of an "abcde" pattern formation within Wave 4 is highlighted, indicating potential reversal points around the 480-490 level, corresponding to 38.2% of the Wave 3 upward movement. It is crucial to note that the author is not a SEBI registered analyst, and readers are advised to consult their financial advisors for investment-related inquiries.
Key Points:
Wave Sequence Overview:
Wave 1 completed at 36 on 19 Sep 2005.
Wave 2 completed around 7/- in Mar 2009.
Wave 3 completed around 775 in Apr 2022.
Current Status - Wave 4:
Wave 4 is currently in progress.
The possibility of an abcde pattern is suggested.
Anticipated reversal level: 480-490, representing 38.2% of the Wave 3 upward movement.
Important Disclaimer:
The author is not a SEBI registered analyst.
Readers are advised to consult their financial advisors for investment-related
Warm regards

$NVDA COMPLETE ELLIOT WAVE ANALYSISI have identified all the wave counts visible on the weekly chart, and while they make sense to me, I acknowledge the possibility of errors, given my relatively new exposure to Elliott Wave analysis. It's evident that we are currently within wave B in the overarching wave count. Anticipating an elongated wave B due to various sub waves, my expectation is for wave B to reach the designated green pivot area before completing wave C well below the 2022 low.

S&P 500: The Straightforward Path to the Red BoxBulls can keep pushing S&P higher in a subwave ( c ) of wave ( iii ) up targeting the next resistance at 5,209.
However, I prefer a more complex and tricky Scenario 2 that first shakes off weak hands and only then starts a rally to 5,200
see the Scenario II:

S&P: Scenario 2: the Running FlatThis push higher off the Oct'23 low lacked a micro i up, ii down at the start and therefore I think that most likely its a false start of the accelerated part of the subwave ( c ) of wave ( iii ) up. Then we should be dealing with the subwave -b- up to be followed by a subwave -c- down (unfolding very bullish the Running Flat corrective a-b-c down structure)
I prefer this scenario more than the straightforward very bullish direct path leading to the Red Target box.

USDT.DVideo analysis showing a clear channel of 6 years on a possible break down. Elliot wave analysis suggests an impulsive 5 waves to break the channel. Enjoy and comment

Very interesting Elliott Wave structure...Luna 2.0 or Terra 2.0 is the new token that emerged from the hard fork of the Terra blockchain network. LUNA2 aimed to rescue the Terra Luna ecosystem following the collapse of the UST stablecoin in May 2022. Most of Terra's dApps and features migrated to the new chain.
@threads #love #ınstagood #art #photooftheday #photography #crypto #bitcoin #cryptocurrency #blockchain #ethereum #btc #forex #trading #money #cryptonews #cryptotrading #bitcoinmining #cryptocurrencies #investing #eth #investment #bitcoinnews #bitcoins #nft #business #invest

5th wave elliott wave pattern 12 months sector 1 wave level my rules as below long term average cost to dollar investment ratio following the Elliott wave pattern.
sector 1 wave level value = 12 months
sector 2 wave level value = 6 months
sector 3 wave level value = 3 months
ralph Elliott nelson rules as below normal rules via Elliott wave principle Robert Precter & ralph Elliott nelson.
grand master super cycle = monthly
super cycle = weekly
normal cycle = daily
swing cycle = 4 hours
day trading = 1 hours
inter scalping = 15 mins
minute = 1 min
sub min = 30 secs

Hellena | GOLD (1H): Long to resistance area of 2062.47.Dear colleagues, I suppose that the price has not formed wave c in the corrective movement. Therefore, I suppose that the price will either continue its formation or will reach 50% Fibonacci level, form a full-fledged wave b and then start an upward movement. Wave c should be higher than wave a, but we will set the nearest target at the resistance area of 2062.47.
Manage your capital correctly and competently! Only enter trades based on reliable patterns!

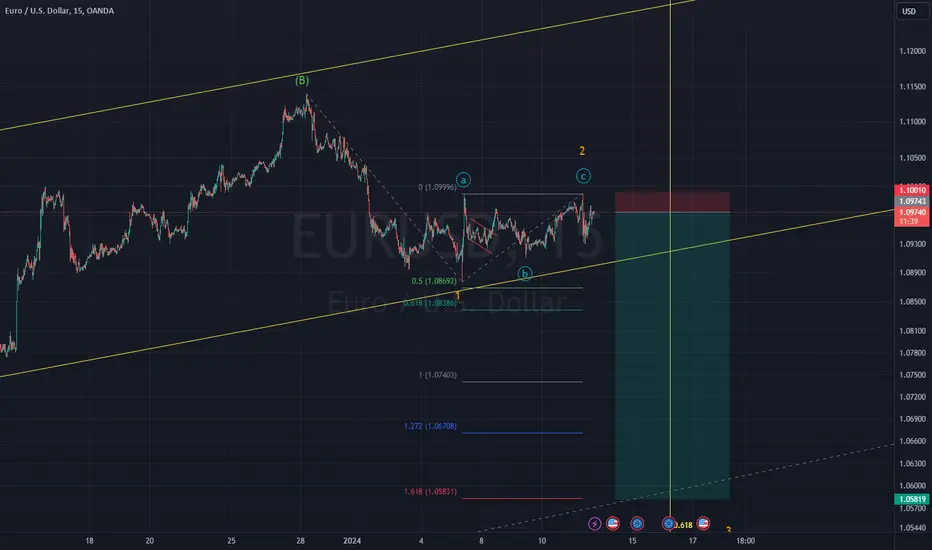
Short on the EURUSD I think wave 1 and 2 has already completed for the down trend so I'm taking a 14RR gamble to short from here.