Elliottwaveforecasts

Idea for EURUSD @ 1st Nov. 2023We're within the correct pattern of ABC, when the impluse is completed, we usually catch the wave 3, because it's the biggest trend from the elliott wave theory, if you guys don't catch it at the top, then we can wait for breakout the red line.

Oil to Continue LowerMoving exactly as forecasted in the previous update(see attached post)
Looking for further downside into wave 3.
As always feel free to let me know in the comments what you're thoughts for Oil are!
Trade Safe!

ALGOlooks like a massive ABC bullish correction. For now I think a correction to the box shaded area is likely. But into late 2024 early 2025 I think we see many strong impulsive wave counts taking ALGO over $7

Is This It?We have been bullish on Bitcoin for quite some time, as my previous posts can witness.
Looking for a potential upside resumption in place as we could now expect a series of wave threes and fours.
As always feel free to let me know in the comments what your thoughts on BTC are, if you enjoy the content, please leave a like.
Trade safe!

EURGBP: Riding the Bullish WaveEURGBP appears to be on a medium-term uptrend that began on August 23rd at 0.84922. Here's how it's been progressing from Elliott wave perspective:
First, there was a move up to 0.86105 (Wave 1) .
Then, an ABC correction in wave 2 brought it down to 0.85239.
The uptrend continued in wave 3, reaching 0.87094.
After that, a corrective wave 4 formed a triangle pattern and finished around 0.86328 .
Currently, we're anticipating the start of Wave 5, which should break out of the triangle pattern, indicating an upward move. The best approach is to wait for the price to pass 0.86550 and possibly retest it on a shorter time frame before considering a long position.
Our target for this uptrend is 0.87405 . This outlook becomes invalidated if price breach the 0.86103 price level.

BTCUSD: Road to 50k?The BTCUSD price has just completed wave 2 and is on course for a fine wave 3 (broken down into 5 orange sub-waves here), supported by a bullish divergence and the break above the weekly Ichimoku cloud.
Wave i could continue its ascent before hitting resistance at 32k.
Wave ii would then retrace 50% of wave i to bounce off the 2021 double-top support.
Wave iii (= 161.8% of wave i) would end at the 40k resistance, before bouncing back to this ascending trendline in blue as a wave iv, retracing 38.2% of wave iii.
Finally, wave v is still the most complicated to anticipate, but the 123.6% retracement of wave iv seems to be in line with the assumption that wave 3 will extend wave 1 by a ratio of 1.618:1.
Fundamentally, the current tense macroeconomic environment remains a danger for the BTC price. Not to mention the dollar rate, which could continue to rise in the event of a further rate hike at the next Fed meetings, particularly those on December 13th and January 31st.
To be continued...
Don't hesitate to comment. I'm open to new ideas, especially as the fractal plan always offers many different scenarios.

Hellena | GBP/USD (4H): Short to minimum of wave 3 at 1.20410.I assume that wave 4 is completed, but it is possible to update the local maximum in the area of 1.23023. In any case, I consider only short positions with the aim to complete the 5 wave structure. The nearest target is the minimum of wave 3 at 1.20410.
Manage your capital correctly and competently! Only enter trades based on reliable patterns!

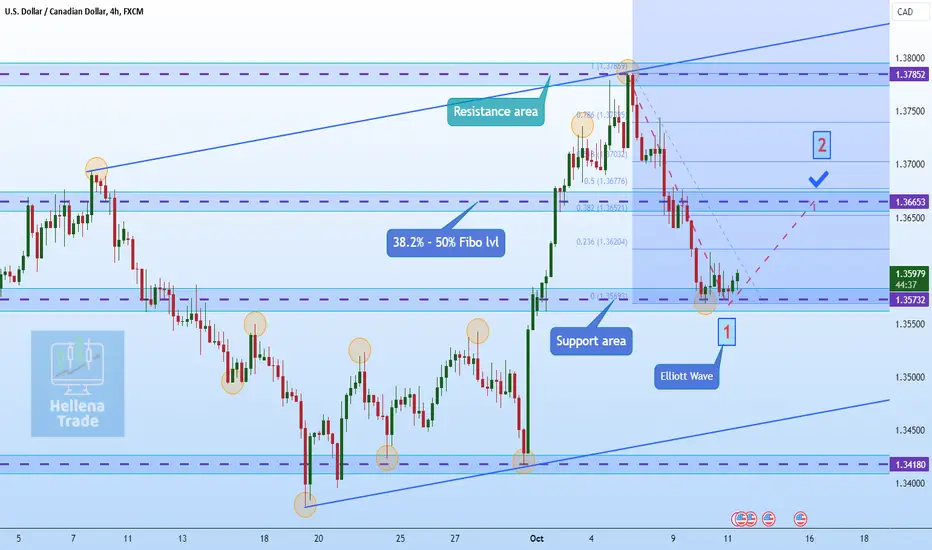
Hellena | USDCAD (4H): Long to 38.2% - 50% Fibo levels 1.36646.Dear Colleagues, I assume that the price will make a correction of wave 2 to the area of 38.2% - 50% Fibonacci levels 1.36646. In general, I assume that the price will fall after the correction.
Manage your capital correctly and competently! Only enter trades based on reliable patterns!
Hellena | GOLD (4H): Short to 38.2%-50% Fibonacci lvl 1840.Dear colleagues, I assume that the price will make a small correction to the 38.2%-50% Fibonacci level area of 1840. Once the target is reached, I will scrutinize the situation. It is quite possible that after that the price will renew the high of 1865. 1865 is the level of zeroing and in this case we will have to redraw the waves.
Manage your capital correctly and competently! Only enter trades based on reliable patterns!

Coca-Cola: Opportunity of a Lifetime?A quick word on what is going on with Coca-Cola.
It seems like we are seeing the largest correction from the Covid lows in March 2020.
Looking for another leg lower into wave (C) before we could expect some upside.
As always feel free to as questions and leave a like if you enjoy the content!
Trade safe!

Hellena | Oil (4H): Long to resistance area 87.89.Dear Colleagues, The price continued downward further than I thought it would. I believe that wave C may reach the support area of 81.94, then I expect the price to rise. The nearest target is the resistance area at 87.89.
Manage your capital correctly and competently! Only enter trades based on reliable patterns!

Hellena | USDCAD (4H): Short to support area at 1.36293.Dear Colleagues, I assume that the price has completed wave 3 and is starting the correction in wave 4. The nearest target is the support area at 1.36293. The price may update the maximum, then the target will not change.
Manage your capital correctly and competently! Only enter trades based on reliable patterns!

OIL: where are you going to?This is my preferred count for OIL as the most recent downmove was so violent that it seems to be the beginning of a new trend.
Looking for continuation lower into a three wave move to compose higher degree wave Y.
As always questions and comments are more than welcome,
if you enjoy the content please leave a like and as always,
Trade Safe!

Hellena | GOLD (4H): Long to 38.2%-50% Fibonacci levels 1840.Dear colleagues, I analyzed gold for a long time and realized that the price has updated wave 3. This means that I am waiting for a correction of wave 4, after which I assume that there will be an update of the low of wave 3.
At the moment I expect correction of wave 4 with the aim to reach the area of 38.2%-50% Fibonacci levels 1840.
Manage your capital correctly and competently! Only enter trades based on reliable patterns!

Hellena | DJI (4H): Long to sresistance area 33587.Dear colleagues, the price continued its downward movement. This means that wave 4 is stretching further than I thought. At the moment I assume that the price may reach the support area 32613.28. Then I expect growth and the beginning of the formation of wave 5. The nearest target is the resistance area 33587.94.
Manage your capital correctly and competently! Only enter trades based on reliable patterns!

Hellena | EUR/USD (4H): Long to resistance area 1.06130.at the moment the price is completing wave 5. It is possible to update the low, so I am marking a wide area for a set of long positions. The nearest target is the resistance area at 1.06130.
Manage your capital correctly and competently! Only enter trades based on reliable patterns!

Hellena | GBP/USD (4H): Long to resistance area at 1.22656. Dear Colleagues, at the moment the price is completing wave 5. It is possible to update the low, so I am marking a wide area for a set of long positions. The nearest target is the resistance area at 1.22656.
Manage your capital correctly and competently! Only enter trades based on reliable patterns!

GBPUSD Intraday: Anticipating a bullish reboundThis is a brief intraday analysis of GBPUSD. Following a recent downward trend, I anticipate a corrective movement in three waves to the upside. It appears that the first phase of this correction has either occurred or is close to completion.
From a Wyckoff perspective, a trading range has been identified within this correction, along with a spring action. I anticipate a bullish rally in the market, aiming to reach yesterday's high at 1.21764 before the drop.

Nasdaq to Find SupportLooking for continuation higher in the Nasdaq once we reach wave {c} target of equality with wave {a}.
Looking for one more leg lower before resuming higher. Feel free to ask question and leave a like if you enjoy the content.
Trade safe!

Hellena | Oil (4H): Long to resistance area 92.57.Dear Colleagues, the price is in the area of long positions set. Renewal of the minimum is possible. Be careful! The nearest target is the resistance area, the maximum of wave 3 - 92.57.
Manage your capital correctly and competently! Only enter trades based on reliable patterns!

TNote (US10Y) entering target area, expecting a pullbackThe TNote (US 10 year yield) has entered its target area for this up movement from the bottom.
Resistance area is between 4.65% to 5%.
We are expecting a pullback below 4% for the next months.
Then the uptrend should resume towards 7%, possibly higher.
A break above 5% would invalidate this view.

Tesla Going Up or Down?Looking for potential further upside into wave {iii} of 3. Invalidation level stands where the horizontal red line is.
Looking forward to finding out of the move will develop.
Feel free to ask questions and leave a comment.
Trade safe!
