Copper - 26/04/2022the push higher than 5.04 will let us expect that wave 3 of (5) is in play, on the other side the move lower than 4.28 will let us expect that the larger flat correction in wave ((2)) started
Elliottwaveforecasts

Wheat update - 26/04/2022upside focus remains, expecting a strong move higher near 1400 to complete wave (5), critical support at 967.2

Natural Gas update - 26/04/2022no clue that the larger correction in wave ((2)) started, continue the downside next week lower than 6 will let us expect that wave ((2)) is in play.

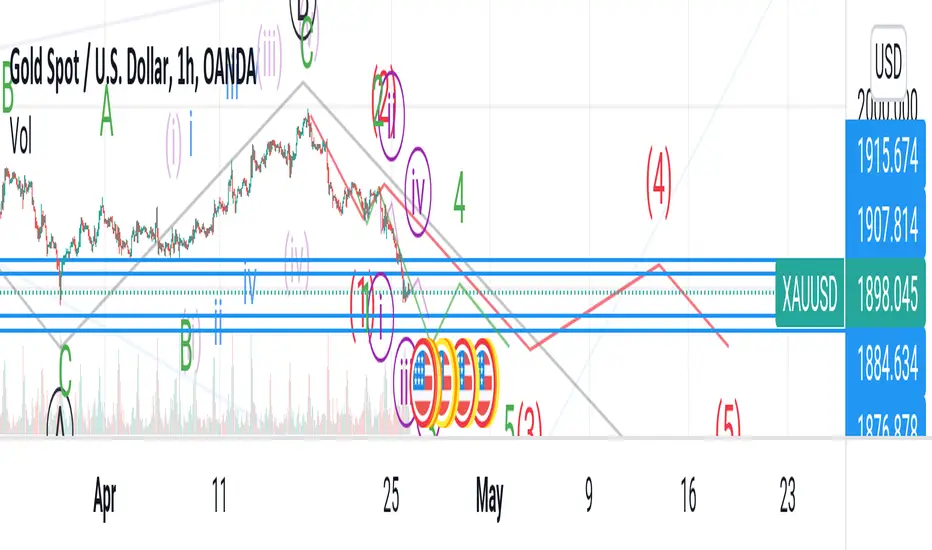
One year prediction for goldHi
According to my elliott analysis, gold can raise to 2200 and over. In this time, gold will touch below 1880 and will be increased
Thank you for your attention
Bye

APE 3 NEXT MOVES PREDICTION BASED ON ELLIOT WAVEIf there is one thing I love about APE it is the way it respond to Elliot Wave analysis.
Wave 1 ending at $17.298, wave 2 respected the Fibonacci retracement level of 0.786% at $9.505 then consolidated forming the a,b,c,d,e corrective Elliot wave 2.
After breakout we see the 1.00% Fibonacci Extension perfectly at $19.580. (now this is where the trap occurs most time this level are not perfectly respected they tend to poke out a bit) and that is why I have set a tight stop loss above $19.580 but I am confident based on how APE has been respecting these levels perfectly.
And yes this is what I love about APE!
Furthermore the next retracement downward (you can take a short position at set target at ($17.150 - .120). If APE continue to behave nicely as it has been doing then we will see upward movement from ($17.150 - .120).

According to previous analysis, Gold is bearish in short periodHi
According to previous analysis, Gold is bearish in short period. In this analysis, I predicted the details of elliott projection. Please wait to reach 1880 and lower than it. The big bullish impulse wave must be started at the end of this bearish wave.
Thanks for attention.
USDCAD update - 25/04/2022looking for a strong move higher in wave 3 of (A) of ((Y)), key level at 1.24, Critical Support at 1.20068

TSLA update - 25/04/2022Upside focus remains, expecting a strong move higher in wave 5 which target higher than 1592

Bitcoin update - 25/04/2022wave ((c)) of E is in play, expecting wave ((c)) to be end at 36500, triangle invalidation level at 33076.95

Platinum update - 25/4/2022the bounce higher than 975 will let us expect that the bottom is placed and wave ((iii)) in it's early stage.

Corn update -25/04/2022expecting a move higher to complete wave ((v)) of 5, key levels to note ( 753 - 813.6 ).


USDCHF update - 24/04/2022Upside focus remains, expecting a more upside near 0.97 to complete wave 3 of (C),

DJI update -24/04/2022expecting a decline to the 0.382 - 0.50 Fibonacci retracement of wave ((iii)) then a reversal to a new high in wave ((v)).

ETHUSD update - 24/04/2022wave ((c)) of E is in play, expecting wave ((c)) to be end at 2500 - 2700, triangle invalidation level at 2167

Cocoa update -24/04/2022upside focus remains, looking for a strong move higher in wave ((iii)) of 1 of (3), key level at 2453, critical support at 2333.

Crude oil update - 24/04/2022expecting oil to remain sideway to complete a triangle wave (B) before move down in wave (C) of ((2)).

LICHSGFIN : READY FOR THE NEXT WAVE : ELLIOTT WAVE 3LICHSGFIN : After giving a breakout from a wedge pattern, It has completed it's first waves 1 & 2. Now ready for it's next move wave 3.
-Definitely not SEBI - Registered. So, this is only for educational purpose.

AARTIDRUGS ON HIGH! : ELLIOT WAVE FIVE - UPTREND AARTIDRUGS, after giving a breakout from wedge, looking for a breakout for the a,b,c, correction. One may enter after breakout and retest by following strict stoploss.
-Definitely not SEBI - Registered. So, this is only for educational purpose.

Gold in next weekHi
In this situation, we are in abc correction with flat structure. The impulse bearish wave predicted by Elliot wave analysis. In this situation, sell gold to 1880 and then wait to see powerful impulse to raise above 2000.
Have good trade

Neutral View for UJLets see how this unfolds. USDYen has been very bullish and it even formed a very familiar Head and Shoulder pattern which price now breaking the "neck".
Timeframe: Weekly
#elliotwaveforecast

A bullish short term and a bearish anticipation afterwards.Here in the chart, currency may experience a short term impulsive completion of 5th wave of larger complex corrective wave Y.
When validated, currency pair may then face sell off to begin an anticipated impulsive wave down.
#USDPHP
#elliotwaveforecast
#PHelection

Nasdaq100 - QQQ due for a rebound ?The QQQ is on support of the line linking the lows. Oversold and 5 waves completed for (1) of C, would be due for a rebound for wave (2) of C. A break below the line linking the lows would probably mean extensions and further downside.
