Eur/Gbp May/12 elliott Wave Hello eveyone...
i was wrong last time..
so 5th wave compelted and we are in C wave so i'm looking for buy in the end of c wave...
Elliottwaveforecasts

Hellena | BITCOIN (4H): LONG to resistance area of 101,000.Dear colleagues, in the coming week I expect price to continue rising in wave “5”. I think that wave “3” is already completed and now we are witnessing a small correction.
Reaching the resistance area of 101,000 will be the end of the big “ABC” correction.
The 91,601 area could be a good support area to complete the correction.
Manage your capital correctly and competently! Only enter trades based on reliable patterns!

Nifty: Correction aheadNifty is likely to correct lower towards 23400-23000 zone before resuming up.

EURUSD: 5th Wave pendingThe pair is rising impulsively and currently about to conclude it's 4th wave (Circle) and break the previous high under wave-5 circle. The confirmation for the same will come above 1.36.

SUI - Leveraging Fibonacci & Elliott for Precision TradesSUI’s movement is rapid, sharp swings—both up and down. In volatile conditions like this, we aim 0.702–0.786 fib retracements (and occasionally 0.886 in harmonic contexts) for high‑probability entries. Below is a clear, Elliott-focused breakdown of the current setup and both long and short trade plans.
Before diving into the charts, let’s cover the basics of Elliott Wave Theory. Elliott Wave Theory provides a roadmap for market psychology by dividing price action into two distinct phases:
1. Impulse Phase (Waves 1–5)
Wave 1: The spark that ignites a new trend as early adopters push prices beyond the prior range.
Wave 2: A corrective pullback that tests the strength of the emerging trend, often retracing 38–61.8%.
Wave 3: The powerhouse wave—typically the longest and most dynamic—driven by broad market participation and often extending to key Fibonacci levels (1.618, 2.618).
Wave 4: A consolidating correction that digests gains and builds the base for the final thrust; it must not overlap Wave 1 territory in a classic impulse.
Wave 5: The final leg of the advance, often fueled by last bursts of optimism and weaker hands.
2. Corrective Phase (Waves A–B–C)
Wave A: Initial counter-trend reaction as profit-taking begins.
Wave B: A deceptive retracement back toward the trend, frequently trapping traders.
Wave C: The concluding leg of the correction, which typically tests or breaks the low of Wave A before the next cycle begins.
Key Points:
Impulse waves showcase momentum and structural clarity, often aligning with Fibonacci extensions.
Corrective waves follow Fibonacci retracements (38.2%, 50%, 61.8%), offering optimal entry points.
Wave 3 is seldom the shortest; Wave 4’s complexity sets the stage for Wave 5’s final push.
In the current SUI structure:
Wave 1 ignited the initial rally.
Wave 2 delivered a healthy retracement, a pullback close to the 0.618 fib, setting the stage for stronger momentum.
Wave 3 roared to a powerful peak topped at the 2.618 extension ($3.875)
Now, we’re deep into Wave 4, likely an ABC corrective pattern. This pause is critical—it gathers energy before the final push of Wave 5. Below is a clear breakdown of each wave, big-picture confluences, and trade setups.
🚀 Elliott Wave Overview
1. Wave 1 & Wave 2
Wave 1: Quick surge from $2.4175 → $2.75, setting initial momentum.
Wave 2: Pulled back close to the 0.618 fib, creating a solid launchpad.
2. Wave 3: The Power Move
Peak: Hit the 2.618 extension of Wave 1→2 and aligned with the –2 extension of Wave 1.
Significance: In strong bull markets, a run to the 2.618 extension often precedes a meaningful pullback. Here, Wave 3’s exhaustion suggests a retrace toward the 38.2% Fib of that advance—our ideal Wave 4 entry zone.
3. Wave 4: The Correction
All eyes on the $3.17 level—the projected 1:1 extension of A→B and 0.382 fib retracement of Wave 3. This confluence zone is yet to be tested and could offer an ideal Wave 4 entry.
ABC Pattern: Currently working on Wave C.
4. Wave 5: The Finale
Target Zone: $4.00–$4.35, with strong focus at $4.31
Extension Levels:
1.133 → $3.9695 aligns with the 0.618 fib retracement.
1.272 → $4.0683 is close to the weekly resistance level.
1.412 → $4.1678 alings with the 0.666 fib retracement.
1.618 → $4.3142 alings with the key swing high.
🔑 Key Confluence Levels
Golden Pocket: $3.9739–$4.1492 (90-day retrace).
Speed Fan 0.618: Support around $3.15.
Fair Value Gap:
Psychological: $3.00 major support.
📈 Long Trade Setup
Entry Ladder: $3.25–$3.111 (stack orders to DCA)
Stop‑Loss: $3.07 (just below the 0.786 Fib low)
Profit Targets:
Fib 1.133 at $3.9795 ($4 psychological & partial take‑profit)
Fib 1.272 at $4.0683
Fib 1.412 at $4.1678
Fib 1.618 at $4.3142
Risk:Reward: ~6:1+ (average entry around $3.20 → SL at $3.07 → TP1 at $3.9795)
📉 Short Trade Setup
Entry Zone: $4.00–$4.35 (sweet spot at weekly level/yearly open)
Confirmation: Bearish reversal candle or volume spike down
Stop‑Loss: Above $4.35
Target: $3.77 (near Wave 3 high turned support)
Risk:Reward: ~2:1 (varies with DCA entry)
⚙️ Summary & Game Plan
Primary Bias: Long in the $3.25–$3.111 zone—stack into the 0.382-0.412 fib retracement entries with tight SL, aiming for the $4.00–$4.30 upside zone.
Alternate Bias: Short on a clear rejection within $4.00–$4.35, targeting $3.77 or lower.
Risk Management: Keep stops tight to maximize R:R.
Patience & Confirmation: Wait for price to reach these zones and show reversal signals (price action, volume, patterns) before committing.
All set—now let SUI’s swings unveil the opportunities. Sit tight, follow your plan, and let patience pay its dividend.
Happy Trading!
____________________________________
If you found this helpful, leave a like and comment below! Got requests for the next technical analysis? Let me know.

A larger corrective pattern is formingIn the previous analysis, a specific range was determined for the price to reverse, after reaching that price range, the price jumped upwards and the price grew by 1700 pips. However, considering that the structure of wave-c is not an impulse, the zigzag was not confirmed and it seems that a larger corrective pattern is forming.
It seems that the reverse contracting triangle pattern is forming, which is currently in wave-d of the triangle. With the completion of wave-d, we can better find the end point of wave-e.

Netflix price correction will continueBased on the 2-month Cash Data chart, it is quite clear that the diametric pattern is completing.
Considering that the diametric wave-(B) has taken a lot of complexity and time, it seems that the wave-(F) is not completed and has little complexity and time, so we considered two scenarios for the wave-(F):
Scenario 1
Considering that after the wave-(E) there was a rapid downward movement, the wave-(F) will become an irregular contracting triangle, then the wave-(G) will start and grow
Scenario 2
The wave-(F) can turn into a flat pattern with a strong wave-b. In this type of flat, usually the wave-c cannot retrace the entire wave-b, as a result, the wave-c of this type of flat pattern can turn into a terminal pattern, and then the diametric wave-(G) of a higher degree will start.

NIFTY: Impulse formationNifty is rising in an impulsive manner of which 4th wave is already concluded at 23847 zone and currently trading under wave-5. This shall take the index towards 24875 zone where wave-5 becomes equal to wave-1.

SPY Green Light to All Time Highs?As VIX is sitting around 25, this is the first Monday in I can't remember how long we aren't gapping down at open! I'll take it! There is a ton on the calendar this week: jobs, first print for Q1 GDP, PCE, ISM mfg, and a ton of consequential earnings! Not to mention will we get a couple deals announced this week. Feels like India, UK and Japan are close. This could spur a market rally to continue! Did a ton of work on Elliott this weekend, but didn't create a video. Essentially, since we closed in the wave 1 of the red C leg (on daily and weekly basis), we have invalidated a chance of a fifth leg lower (thank God!). This means we are in first impulsive intermediate 5 wave that should go to all time highs (next Apr)! Since we already have two minute impulsive waves that were similar in size, we likely will finish the minor wave 3 as pictured and then since 1 & 3 of minor waves will be similar in size the impulsive 5 wave target will be as pictured as well. Remember it is simply the net of waves 1 through 3 times 0.618 and add that to the finish of wave 4 in either case. After wave 3, we will get a pullback, but this will be a buy the dip opportunity finishing the 5th wave around 580ish. After this we will get a deeper corrective wave but if sentiment is positive it may be shallow, only 38% to 50%, so will want to re-evaluate at that point! This is why it is important if you are investing not to FOMO, as there will be many opportunities to buy the dip!

Start of Wave-(b) and Neutral Triangle As I said in the second paragraph of the previous analysis, wave-(a) ended at 3500 and the gold price fell by 7% (over 2000 pips) and now wave-(b) has started.
1M Cash Data Chart
I think that a neutral triangle or a reverse contracting triangle is forming, with the completion of wave(b) we can somewhat understand which pattern is forming.

Gold Uptrend ContinuesThe higher degree diametric wave-(E) is expanding and we can consider the recent price correction that started at $3167 as a small X-wave, as a result, gold can grow as a combination pattern to the range of 3600-3800 and even gold can touch $4000.
The second triangle pattern will probably be a neutral triangle or a reverse contracting triangle, where the wave-(a) triangle can end at 3500 or 3600.
The factor that caused the expansion of the wave-(E) is the US-China trade war, which caused investors to rush to buy gold.

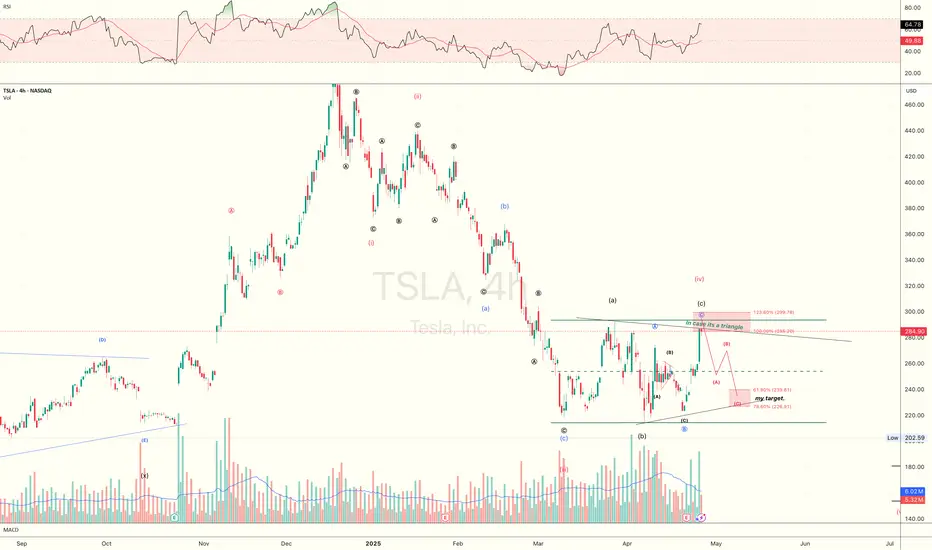
Either a triangle start forming or a flat just completed. $TSLAThe Friday bounce was huge and expected, but be really cautious as its very a typical Tesla move.
At this point, i believe the triangle to be complete in next 2-3weeks(likely), or a flat just complete(also acceptable though i'm leaning less toward this scenario).
And, I bought puts yesterday, let's see what this plays out.
Just sharing my honest thought here, feel free to challenge my view and post opposing counts, always willing to learn new knowledge.
BTC is Still A Correction.BTC is in good rally these days, but my believe is that it is still in a correction.
I am not 100% confident in wavecount, but I am confident that BTC is not done correcting until it has gone down to somewhere between 62.500 - 52.500.
If the rally BTC is currently in, I believe we are seeing a flat, and I will correct my count accordingly.. But right now I'm seeing a W-X-Y-X-Z correction.
Be careful, and do not bet on BTC is rallying to a million just yet ;)
For now I believe there will be good odds for following the white line I've drawn on the chart.

EURJPY: Short Setup with Target Zones in FocusEURJPY outlines a clear W-X-Y corrective pattern. Wave (W) ended at 161.297 , followed by an upward corrective move in Wave (X), which topped at 162.665 with a classic ABC formation.
Currently, the price is hovering around 162.084, likely forming Wave B of the final Y leg. A brief move higher could complete this B wave before the pair resumes its decline toward the 160.922–160.680 area, which marks the projected end of Wave C of (Y).
The broader correction is framed by two descending blue trendlines, providing dynamic resistance and support, while a short-term red ascending trendline is currently holding the price action but may soon give way. If the price stalls or rejects around the 162.3–162.5 zone, it could signal the start of the next leg down, making it a potential setup for short positions. After the reversal from Wave Y, potential upside targets are 161.600, 162.500 , and 163.100 .
We will update it soon!

[BTC/USDT] Wave (4) Completed? Road to $140K Begins HereBitcoin is consolidating just above key support after a textbook correction. The first chart shows a completed Falling Wedge breakout from Wave ④, while the second chart lays out macro Fibonacci targets for Wave (5).
Chart 1 (Daily): Local Breakout Setup
• Falling wedge breakout above 83.9K–84.3K
• Completed structure: Wave ③ → ④ → Potential Wave ⑤
• Invalidation: Below 73.8K or worst-case 69.5K
• Bullish continuation requires break & close above 86K
Chart 2 (Weekly): Macro Target Projections
Using Fibonacci extension from Wave (3), BTC shows:
• 0.618 Target = $114,983
• 1.000 Target = $140,033
• 1.618 Target = $180,560
If current support holds, Bitcoin could be entering a massive Wave (5) cycle with upside potential towards $140K–$180K. Reclaiming levels like $92.5K, $101K, and $106K will confirm the bullish structure.
What’s your Wave 5 target?
#Bitcoin #BTC #BTCUSDT #CryptoAnalysis #ElliottWave #Fibonacci #CryptoTA

Still Need Some Correction For S&P500 / ES Before Going UpAttention: Prices are read on the futures chart, so they might be different if you are reading on cash charts. But directions and realtionships, should be very similar.
I believe S&P is in a very volatile correction and it is a bit hard to read.
To me it looks like price completed a green (a) of the grey ((y)) wave with a failed 5th and started the green (b) wave with a very aggressive purple a wave.
I believe we are now finishing the blue a-b-c correction in a c-wave diagonal and I would like to see it go down to 5110 area in the green box, for the c wave to have room to develop into the yellow box in the 5530 area.
If price is heading above the 5630 area, I would start to look for another count, since this would mean the green (a)-(b)-(c) correction should have been a flat, and since the green (a) wave is not counted in three waves, this can't be correct.
Right now I would like price to go down to the 5110 area, then back up to the 5530, and then we start the last green (c) wave of the grey ((y)) correction.
And this green (c) wave has plenty of room. All the way down to 4176 before it invalidates the count.
After all this correction, happy days are starting again, where the 5th wave could be heading for the 6500 to 7000 area.

DXY In Difficult Circumstances Since the Start 80's I decided to give a go at the Dollar Index given the circumstances around the world. And to be honest, I tried to put on the positive glasses.
I believe the dollar has been in a complex correction since the mid 80's. Starting out with a large dump in '85 with the a-wave, the correction slowed down and only grew more and more complex.
Thought about current wave: What I believe we are going through now is, that we are finishing up the purple C-wave in a green (C)-wave. This wave can end at any time now, since it's now at the 61.8% fib level of the purple A-wave. But it might go down to the 95 level (The green box) to complete at the 100% fiblevel of the purple A-Wave.
But first we will have the fourth wave meaning the DXY is gonna struggle for some weeks. Because we had a swift two week wave 2, which means we are probably going have a slow fourth wave according to the rule of alternation. This mean the purple C-wave could drag out into the end of '25 into early '26.
This is also with that in mind that a C-wave most likely will take longer than an A-wave. These are the Purple boxes.
BUT, after this, DXY is gonna experience some happy years again, going back up to the yellow box somewhere between 110 and 120 to finish the WXY of x of the larger degree. This will take DXY into a couple of years bull-run as long as the green (C) wave runs and completes no earlier than late '27, depending when the purple C-wave prior to the green (C) wave ends. But I believe the green (C)-wave will take about two years to complete.
But after this, DXY could again go into some dark ages and considering the high degree purple w-wave took 23 years to complete (blue giant box), there is no reason to believe this high degree purple y-wave will be a swift matter and actually don't complete before the year 2050. And it will take the DXY all the down to start 60's or lower.
The reason I said I tried to put on the positive glasses, is that I tried seeing the white channel as a leading diagonal for a new bull run, but I just don't see it as such.
I also tried seeing it as a C-wave of a flat diagonal, but this would result in another C-wave afterwards, and also take us down to the 60's level. So that didn't do us any good.
For the sake of DXY, I hope I'm wrong, but this is how I see it.

XAG getting ready for another run down.I believe XAG has finished the blue ((c)) of green (iv) with an ending diagonal, and now doing the first 1-2 of the green (v) wave of gray ((c)).
The price might do a very small retrace to 31.12 before starting a 3rd wave down.
I believe the green (v) is going to the green box area at 28.15 - 27.40 area.
But I actually have a weekly trendline lower down, which the price might want to go won and test, which also fits with the idea that the (v) wave could go all the way to the 100% Fiblevel of (i)+(iii) level.
This would mean the price would probably test the 25.0 level.

Correction has begun in SPXWe can almost say that 4800 has been touched and given that the downward movement was very fast, this wave is most likely the A-wave of a triangle and the upward waves that are forming after the 90-day suspension of the stalls are considered as a corrective wave.
Previous SPX Analysis

My take on Gold. It's a difficult one..This is the read that makes most sense to me. And I have zoomed all the way into 15m, for you to be able to see my thoughts around it all.
For that wave down from April 2nd to April 7th to make any sense to me, I have labeled it as W-X-Y to complete (A). At first I had labeled it as a diagonal, but then price should not have retraced as much as it has since April 7th.
And I also believed Gold has finished a 5th of a 5th wave, so we need to see some more correction before price head to the upside again.
I simply can't read the retracement back up since the April 7th as a A-B-C, and this is why I believe price is just finishing up the A wave (and it might already have) before it goes into the B correction.
The initiated wave down (wave B of (B)) I believe will go down to 3,044 - 3,013 level and then finish of the flat with a wave C of (C).
This wave C should be able to go to the 3,130 - 3200 level.
But as I said, first we spend some days to the downside heading for that 3,044 - 3,013 level.
What is your current take on gold?

Waiting for AUDUSD make a PullBack, and then look for buys.The read I like most now, is we had a Failed 5th on my Elliott Count, and we have now started a new Impulse.
Currently we are finishing the 1st wave, so I will wait for price to come back into that green box, and then I will look for buys.

S&P 500: Historic Crash or Just Another Chance?Let’s be real: What’s happening with the S&P 500 right now is rare. This is only the fourth time in history that the index has dropped more than 10% in two days (technically three, including today’s Monday session). The other times? October 1987, November 2008 during the financial crisis, and March 2020 during the pandemic crash.
And now? We’re seeing a similar drop, this time triggered by a global tariff war , stoked by the U.S. and other governments playing chicken to see who folds first.
Yeah, it sucks. It hurts. But it could also be a hell of an opportunity.
We just tagged the 4,800 level —a place many didn’t expect to see this quickly. Neither did I. But here we are. The untapped VWAP got hit, and this might very well be the start of Wave A. Could we go lower? Absolutely. There’s a monthly Fair Value Gap around $4,500, and a drop to $4,250 isn’t out of the question either.
But here’s the thing: it depends entirely on your perspective.
If you’re trading on the 30-minute chart, this is a full-blown crisis. But zoom out to the daily, weekly, or monthly chart—and it’s just market noise.
Pull up the log chart from 1953 to 2025 in the top left corner. We’ve seen this before. A handful of times. And on that scale? Nobody cares.
If you’re in the game to build long-term wealth, this moment is just another temporary shakeout. If you’re doing dollar-cost averaging, this is exactly where you want to be adding—not panicking.
The market doesn’t care about your plan. It forces you to adapt. You can’t fight it, only flow with it.
And if you’re in it for the long haul? This is just noise. Ignore it, zoom out – and stay the course.

S&P 500 resistance levels#SPX
Upon observing the 6-month cash data of the S&P index, it becomes clear that this index has reached significant resistance levels. However, it is still too early to proclaim the beginning of a major correction in this index. That said, it can be anticipated that a potential price correction might extend to the range of 4800 to 4500.
When comparing the wave count of this index with the Warren Buffett Indicator, both reveal a common message: the S&P is currently situated in sensitive zones.
There are two critical price ranges for this index that could lead to significant price reversals: the first range is between 6085 and 6240, and the second range is between 7900 and 8000.
