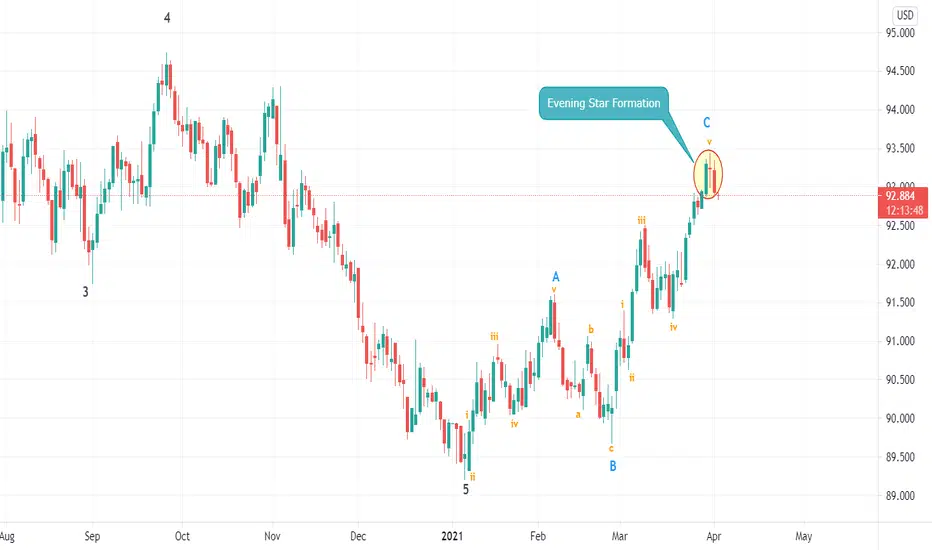
Time for Dollar go Down ??Yesterday DXY close in bearish candle after reaching 93.40 area. It is indicate me that DXY already finished its 5th subwaves for completing ABC retracement. I think it is the time for Dollar to go down as i can see now DXY making evening star pattern in daily timeframe. My analysis will be invalid if DXY can close above 93.45
Happy Easter guys
Elliottwaveforecasts
BTCUSDT going back to 43000 before new high?? ATH of BTC 61800 is not gonna break yet?
Yes, we're still in massive bullish price zone even retrace back to 43000! By applying elliott wave principle to the BTC market, we're currently on point B of the price correction zone.
Anyone may share your thought and tell me if i'm wrong? The chart drew according to the guideline of "Elliott wave principle key to market behavior"

RMR: Elliott impulse wave finishing, correction wave incoming?Hi. I've plotted a resistance zone that's been prevalent since the start of the year. I've also plotted some Elliot waves: some past, some current and some incoming.
The recent Three Drives pattern is over and unfortunately I didn't recognize it in time. But a good question then is what's next?
Well there is a clear impulse wave occurring at the moment. The high price difference between the MA 56 and close price strongly indicates that the impulse wave will continue to finish wave 3 and 4. The exact time when this will happen is uncertain, the price on point 5 is just an example.
But this means a correction wave is incoming when the impulse finishes.
There are two decent position to make if you believe the impending waves are probable:
When the current impulse wave has finished there is a good timing for a short position to profit off of the correction wave.
When that correction wave is complete there will most likely be an impulse wave. A long position when this is apparent or a long position on the B point of that wave could both be decent.
Thank you. Please, if you have any thoughts or comments do leave them below and I would gladly discuss or adjust my interpretations and methods with you.
This does not constitute financial advice. Any projected prices, even if explicitly stated, are made with intent to discuss the symbol and potential interpretations. Any trades shown or mentioned are examples and neither recommendations or mandates.

GBPUSD Daily Timeframe With Elliot WaveHere is my continuation analysis in GBPUSD. In my opinion GBPUSD just completed wave 4. After completed 3 subwave A B C and hit Daily Uptrend and also i see a double bottom in in daily timeframe. Right now im focusing how GBPUSD will make wave 5. My analysis will be invalid if GBPUSD break below 1.3670.

XAUUSD, 4hr tf, sell on completion of wave-4Hello my friends,
If you follow my previous post regarding XAUUSD to buy from 1680, you should be able to booked decent profits.
I myself banked +300 pips which yield 3R.
Based on my Elliott wave analysis, we could see another drop from XAUUSD as price might need to do 1 more impulse to the downside in order to complete wave-5.
Sell XAUUSD 1710-1712
Stop loss 1721
Take profit 1668 (4.8R)
Use only 1-2% risk
Good luck

ETHEREUM to All Time HighHello Traders and Investors,
my EWc suggest further upside to come in ETH. We could be facing an elliott wave triangle in wave 4 of (3). Feel free to ask any question and let me know what you think in the comments.
Trade WISELY and SAFELY!

EURUSD might find a bottom soonHello Traders and Investor,
As my EWC is suggesting we could be seeing a bottom in EU taking place soon. After that I wouldn't be surprise to see EU breaking the 1.23 level.
As always feel free to ask question and trade SAFELY and WISELY!

🛢Investments in the Russian oil sector...●● Mine scenario
🕐 1W
MOEX:LKOH
«Pic.1»
We successfully predicted the growth of the fifth wave after the triangle ((iv)) and the subsequent decline within the wave 4 , which, based on the norm of alternation, is still expected in the form of a triangle.
🕐 1D
MOEX:LKOH
«Pic.2»
Combination "Double Three" SZ-X-CT
🕐 1D
MOEX:LKOH
«Pic.3»
The main purchases are planned under the condition of a fully completed triangle, at the end of the final wave ((e)) in its structure.
🕐 2h
MOEX:LKOH
«Pic.5»
This count has a number of disadvantages. They are: two sideways corrections in waves ii-iv , and a truncation within the assumed diagonal v . In connection with the above, I recommend any speculation in the short only after the breakout of the top iv , the level marked as «confirm.lvl» .
🕐 2h
MOEX:LKOH
«Pic.6»
Along the way, I am considering a variant count with a triangle in (b) of ((b)) , which suggests continued growth within wave (c) . Waiting for the implementation of my count for continued growth, I hold the buy position.
●● Alternative scenario
🕐 1W
MOEX:LKOH
«Pic.8»
As for the alternative count shown in "Pic. 8" , taking into account the probability of its implementation, I do not increase the volume of a long-term long position until we form a triangle as it is schematically depicted in "Pic. 1".
The wave marking in the double circle parenthesis corresponds to the green marking in the circle on the chart.

Elliott Wave Theory RulesHello guys :)
The Elliott wave theory has 3 rules.
Follow me for more tutorial.
Cheers :)

USDCAD: ready to short for a 5th waveAn Elliott Wave "JK Channeling" interpretation of USDCAD, showing a potential 5th wave to the downwards (with a decent RR)

EUR/NZD Quick Elliott Wave Analysis EUR/NZD Quick 10 Seconds Elliott Wave Analysis
We can see a completed Wave 1-5 Down on the Daily Chart
Today we are seeing a Wave C up (Bullish)
Let's find out how

SPX Elliott wave count daily. 101 probable count1/ This new idea is based on the previous idea below, rsi possible extended 1st wave like our spx. Nothing guaranteed
here just an amazing similarities (chart # 1).
2/ The previous idea is coming handy for "Gaps behavior " and how they usually appear in waves 3 & C. Well it kind
of supporting this idea of an extended 1st wave. Here it is below (chart # 2).
3/ Combining these together kind of make the argument for and extended 1st wave is more probable, or not.
4/ So what's next, well Elliott Fibonacci Retracement and Extension Guidelines for an extended wave 1 as follow:
If wave 1 is extended, then the size of wave 3 through to the end of wave 5 is often 61.8% – 78.6% relative to the size of wave 1
If wave 1 is extended, then wave 2 and 4 are very likely to be shallow (i.e. 23.6% – 38.2%)
If wave 1 is extended, then wave 2 will often end at the level of sub-wave 4 of 1 (i.e. the internal wave 4 of wave 1)
4/ That's would put the probable target for this bull's move since March's low between .61-79 fibs with
minimum requirement @ 4122:

SPX's Elliott wave ABCDE grand cycle count. 1970s-2021Since 1957 inception's day we got 2 ABCDE waves we illustrate the similarities here. Nothing stands out, but if we
can rhythm with the past we got our selves a years of bull market.

EUR/USD Complete Elliott Wave Analysis In the past, we have seen EUR/USD complete a bullish wave sequence
We can now see a possible ABC down.
It might be completed it might have more legs to do...
But is there an opportunity for us to take advantage of?
Also, have a look at my previous wave analysis attached below - Which was done in Jan this year.

NASDAQ CRASHING?Hello!
My EWC for the nas100 suggests that we may be recovering form the 10%+ move down and are slowly starting to resume higher. I expect a last move down which can't break the previous low to then resume higher.
Feel free to ask quesitons and let me know what you think in the comment!
AB.

SPX's Elliott wave, "Today's Forecast" Plan. 15 Minutes chart.Two counts out there, both could be invalidated at any time. Daily & 4 hours and hourly
nothing to count just one big bull's straight move.

GOLD LONGThe gold forms a structure that seems to be an Ending diagonal 👀
⠀
Such a pattern suggests that the trend is weakening and a reversal is possible, ❎ but do not rush to buy and risk your money.
⠀
✅ Wait for confirmation and breakout of the channel.

XRP (Ripple) Working on a Riptide Down to .40!Be aware of entering new longs in this area as we seem to be in yet another Leading Diagonal formation. The first 5 Waves are already in, but calculating the current zig zag target doesn’t give price structure the precise drop that it needs. I’m anticipating a double zig zag correction to really shake out early/over leveraged bulls. Big buyers coming in at .40. Word to ya momma.

FURTHER UPSIDE IN ETHEREUM My EWc suggests further upside in ethereum for the following days. the 1290 mark is the first invalidation level, if we break ath we will have further confirmation. Feel free to ask questions-

🥇XAUJPY: Japanese Alchemy of Gold🎌●● Mine scenario
● 1W
It is very likely that, as in the case of XAU/USD , the wave (V) of the " Supercycle " degree forms the Ending Diagonal I- II-III-IV-V .
● 1D
A variant of count of the triangle ((B)) of I .
● 23h
A variant of count of the wave (1) of ((C)) in the form of a single zigzag A - B - C .
● 6h
I expect the wave (3) to resume growth soon. The confirmation in favor of the completed correction (2) of ((C)) in the form of a double zigzag W - X - Y will be: the breakdown of the line 0 - X , plus the formed waves ((i)) - ((ii)) of A , the first of which will break through the top of X — " bull lvl " and gain a foothold over the upper border of the descending channel.
●● Alternative scenario
● 6h
As long as the above conditions are not met, there is still the probability of continuing the decline of the wave Y of (2) with the first targets of 173775 .
The wave marking in the double circle parenthesis corresponds to the green marking in the circle on the chart.

TASI might hit 9000 After a Slight CorrectionTADAWUL:TASI could continue rising and reach 9000+ in few weeks after slight correction which is @ 7865.

SELL OPPORTUNITY ON USDCHFMy EWC suggests we could see a temporary move down of this pair once approached the red area. Be wise if taking this trade yourself and feel free to ask any question.

BTCUSD Wave 4 Drop is done! On to Sub-3 or Super 5!Price broke the corrective channel and has formed an ending Diagonal to finally end the downtrend a week ago! Please follow and comment with your own charts / opinions. Thanks for checking me out!
Not a professional, just learning all of this, do your own due diligence before making any trades!
