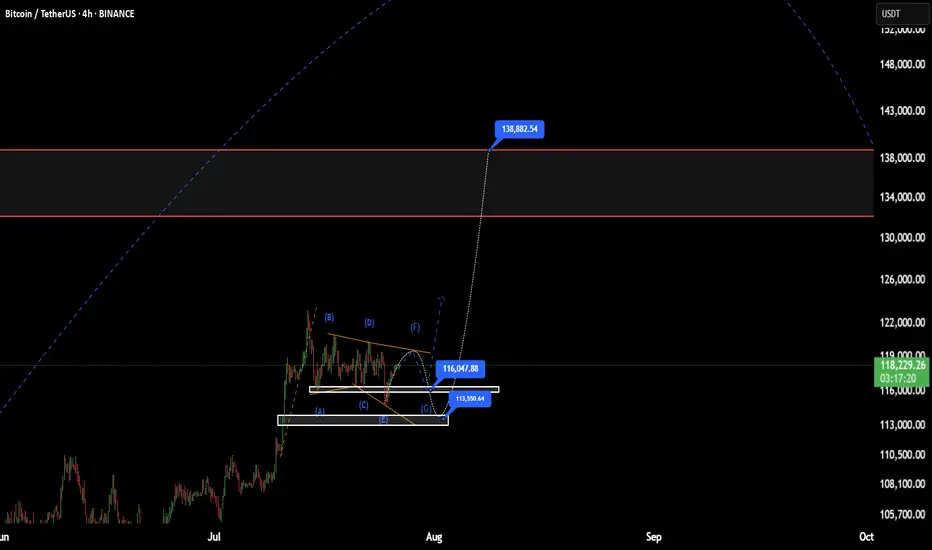
BTC(based on NEo wave)I think wave G is finished and soon it will pump to 138K.
stop loss is 115500.
attention:138K is the first target of these bullish waves.
Elliottwaveprojection
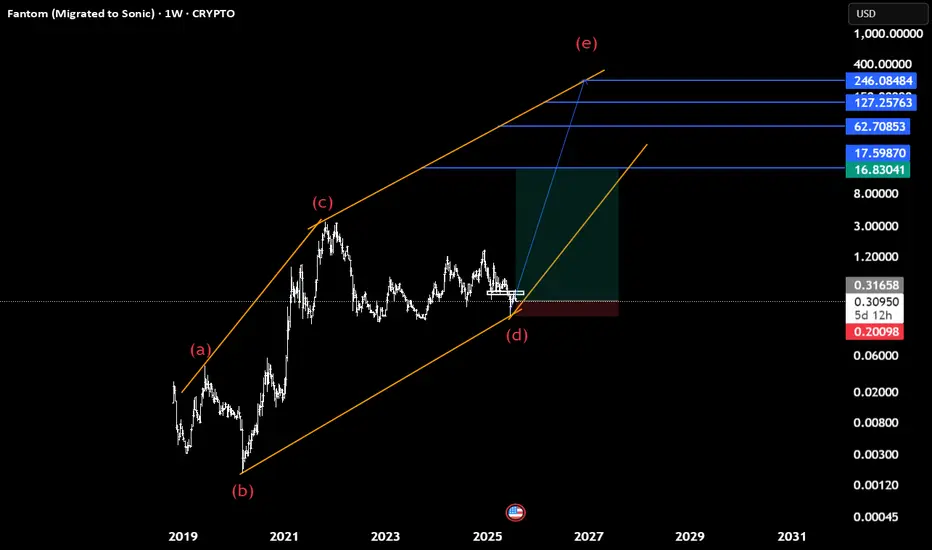
Sonic(based on NEo wave)Soon Sonic will start heavy bullish waves to the targets which shown with blue lines.
95% it is a diamnod diametric and we cant consider this as descending triangle because there is no overlap between wave d and a.
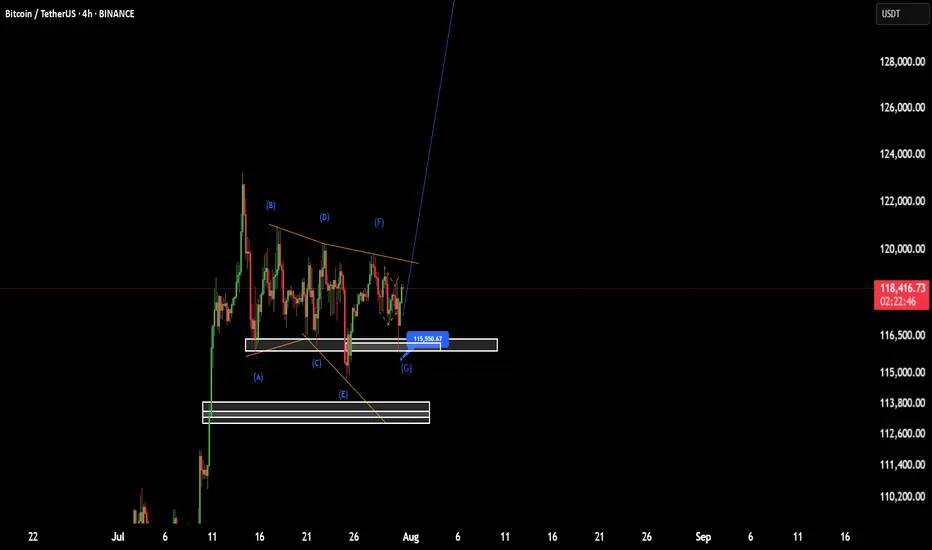
BTC(based on NEo wave)This range price is shown as a bow-tie diametrical.
I think G wave will end at one of those prices, 113 or 116
after this it will start a good bullish wave.
stop loss is 110K and the first target is 138K.
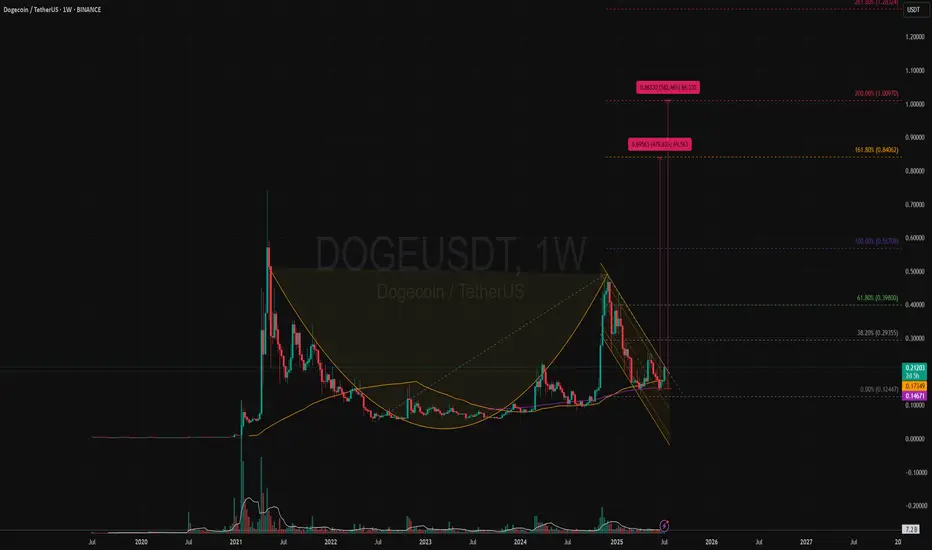
DOGEUSDT | Bullish Cup & Handle Revisiting Target +500% (1 USD)?Price Action and Chart Pattern Analysis:
DOGE cup bottom happened around $0.05 with the rim around $0.48. That gives a depth of roughly $0.42. If the breakout occurs near the rim, the measured move target would be $0.90 zone.
This aligns with several analyst projections suggesting DOGE could reach $0.90 to $1.00 if the breakout confirms.
Another way to project this cup & handle is the fibonacci-based target. These levels suggest that if DOGE breaks above the handle and sustains momentum, $0.85–$1.00 is a realistic zone for profit-taking at 161.8% and 200% extension as 1-2-3 wave pattern.
Reliability of the Cup and Handle Pattern for DOGE
The cup and handle is a classic bullish continuation pattern, but when applied to Dogecoin, its reliability depends on several dynamic factors:
Strengths of the Pattern in DOGE’s Context
Historical Accuracy: DOGE has previously respected technical patterns like rounded bottoms or (THE CUP) and breakout channels (THE HANDLE), especially during alt coin rallies.
Current Setup: a well-formed cup and handle on DOGE’s weekly chart, with price rebounding from $0.14 and testing resistance at $0.2 zone which also the key resistance SMA50W and the downtrend channel (the handle)
WATCH OUT: still a possible throw-under pattern or a final bear trap liquidity below previous low!
Key Action: If breakout confirmed with volume > Follow BUY | if not, wait for retraced SMA20 or breakout support.
Always trade with affordable risk and respect your stop...
EUR/USD – Falling Wedge at Major Fibonacci Zone | Bullish ReversAfter a strong mid-June rally, EUR/USD has pulled back into a key fib cluster, showing early signs of reversal from a classic falling wedge pattern — often a precursor to bullish breakouts.
Technical Breakdown:
📉 Descending Trendline
🔍 Fibonacci Confluence:
Price is reacting from the 0.5-0.618 – 0.705 zone (1.16421-1.15969), aligning perfectly with historical demand and the golden zone of the fib retracement.
Just below sits the 0.79 fib (1.15339), which also marks our invalidity level for this idea — a deep but powerful retracement if tested.
💡 RSI:
While still below 50, it has created a hidden bullish divergence between July 12–17, hinting that momentum is flipping back to bulls.
🧠 Educational Insight:
This setup combines Trendlines, Fibonacci retracement theory, and EMA dynamics to build a multi-layered trade thesis — the type of confluence we look for at Wright Way Investments.
Price doesn’t just reverse because it hits a fib level. But when structure, EMAs, and RSI align — the odds increase significantly.
📈 Trade Setup (Idea-Based, Not Financial Advice):
Long Entry Zone: Current area (1.159–1.161), with confirmation above 1.1626
Invalidation: Clean break & close below 1.15339
Target Zones:
🎯 TP1 – 1.1642 (50 fib & retest zone)
🎯 TP2 – 1.1686 (38.2 fib)
🎯 TP3 – 1.1755 (Weekly Resistance)
📌 Summary:
EUR/USD is forming a textbook reversal setup, supported by fib precision and EMA alignment. Patience is key — but the ingredients are here for a strong bullish continuation.

XAU/USD Elliott Wave Setup : Triangle Ends, Impulse BeginsThe 8-hour XAU/USD chart presents an Elliott Wave structure, currently in the final stages of Wave 4 within a larger impulsive cycle. The complex correction in Wave 4 has unfolded as a WXYXZ (triple-three pattern), forming a contracting triangle (ABCDE) — a classic consolidation phase that typically precedes a sharp impulsive breakout.
Wave E has recently completed near the lower boundary of the triangle, supported by the ascending trendline drawn from the April low. This suggests the correction is mature and Wave 5 is ready to ignite.
Target 1 (T1) : 3434.845
Target 2 (T2) : 3500.535
Stop Loss (SL) : 3309.729
The triangle (Wave 4) breakout structure suggests bullish continuation.
Multiple internal WXY corrective waves have completed, signaling exhaustion.
Volume and candle structure support the possibility of impulsive buying in Wave 5.

USD/JPY – Rising Wedge Meets Major ResistanceChart Overview:
USD/JPY is printing a textbook rising wedge formation, typically a bearish pattern—especially when occurring at the top of a major move.
What makes this setup compelling:
Price is testing the upper wedge resistance near the 148.50–149.00 region, a historically reactive zone.
There’s clear confluence with the 200 SMA, horizontal resistance, and wedge structure—all signaling potential exhaustion.
🔍 Key Technicals:
Resistance Zone: 148.00–149.00 (Highlighted Supply Zone)
Rejection Candle Pattern: Recent upper wick shows rejection and buyer fatigue
Bearish Divergence on RSI (14): Price made higher highs, RSI printed lower highs — a classic warning signal
🧠 Educational Note: Rising Wedge Patterns
A rising wedge is a bearish reversal pattern, especially potent when it forms after an extended rally. The structure narrows as buyers lose steam, leading to a likely breakdown once support is breached.
Pro Tip: Always confirm a wedge breakdown with a close below support + volume spike or bearish engulfing.
🔄 Invalidation:
This idea becomes invalid above 150.467, where the wedge breaks upward and price potentially enters a new bullish phase. Marked clearly as “Idea Invalid” on the chart.
🧠 Final Thoughts:
This chart combines price action, pattern structure, RSI divergence, and SMA confluence — a high-probability scenario favored by elite traders. If you trade based on confirmation rather than prediction, this could be a setup to watch closely.
🗣 Drop your thoughts or questions below!
💬 Let’s learn and grow together.

Dollar Major BottomDollar has just finished a major zigzag correction. I was correct, in my last idea, of calling one more leg lower before this major low. Watch for the dollar to PUMP in 5 waves!

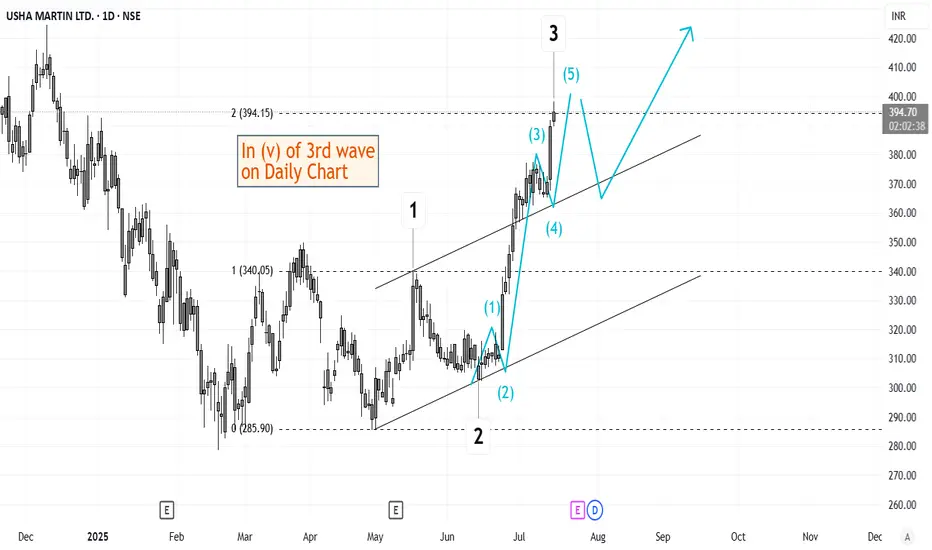
Elliott Wave Analysis of Usha Martin USHAMARTThe script is currently in (v) of 3rd wave on daily time frame. This should be followed by a short retracement and then a 5th wave up. Will keep updating this chart as it progresses.
NSE IONQ - Are we ready for a breakout?The corrective phase is complete and an impulse move appears likely. A strong buy above the A-B-C channel could target levels around 30 - 37 - 45 or higher. Good entry is possible above 26. However, if conditions worsen, further corrections may ensue.
I will update further information soon.

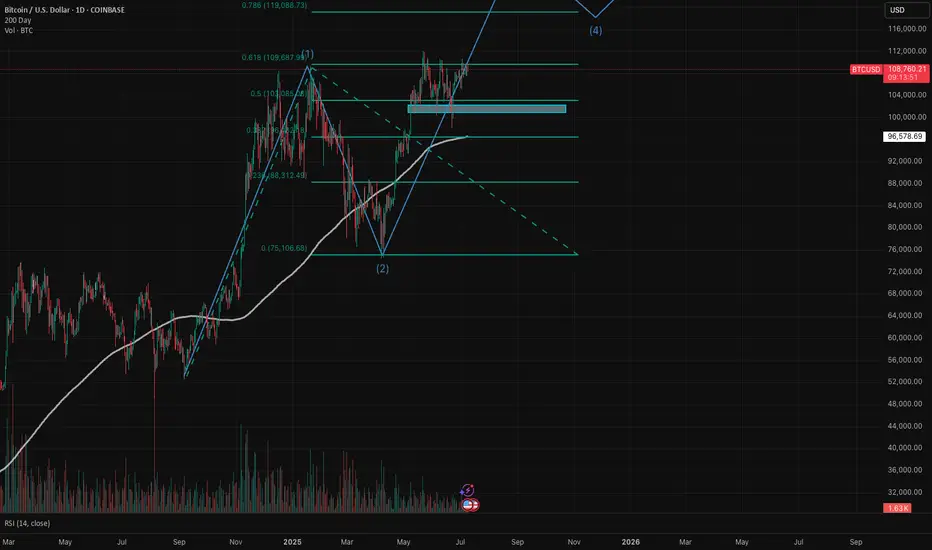
Bitcoin (BTC/USD) is currently in wave 3 of a 5 (Elliott Wave)BTC/USD experienced a halving last year on April 20, 2024. We have been seeing the typical post-halving cycle with exponential upside, followed by deep pullbacks. The price action we've seen to date follow Elliott Wave Cycle quite nicely. I believe we are in wave 3 of a bull cycle that has really been in place since Sep 2024.
- Wave 1: Sep 2024 - Jan 2025 - parabolic upside from $54K to $109K - absolutely explosive!
- Wave 2: Jan 2025 - Apr 2025 - we saw price peak and pull back all the way to the 61.8% Fibonacci level right around $75K. Remember, that in wave 2, a healthy pullback is 50% - 61.8% of the first wave.
- Wave 3: Apr 2025 - we have since rallied to around $109K as of this analysis. We are likely in subwave 3. Subwave 1 was from the low in April to the high in May (around $112K). Subwave 2 was a very nice 3-wave zig zag (reaching low of $98.3K in June). I believe we are currently in the middle of wave 3.
My next price target based on Fibonacci extension is $118K-$120K with the $78.6% level right at $119K. Note current resistance that we need to turn into support ($109.7K level) is the 61.8% Fibonacci extension level. I do expect a meaningful pullback after the peak of wave 3, which would be wave 4. The rest is TBD and I will continue to update this idea.
Remember, Elliott Wave theory is one tool in the toolbox. I do believe there is a larger post-halving cycle narrative that is dominant and most reliable, especially since BTC has largely followed this blueprint that we see every four years, but as of now EWT fits in quite nicely. I also look at the pi cycle top indicator and believe we need to use multiple indicators to understand where we are in the cycle.
Understanding Elliott Wave Theory with BTC/USDIntroduction to Elliott Wave Theory:
Elliott Wave Theory is a popular method of technical analysis that seeks to predict the future price movement of financial markets. Developed by Ralph Nelson Elliott in the 1930s, the theory is based on the idea that market movements follow a repetitive pattern, driven by investor psychology.
At the core of Elliott’s theory is the idea that markets move in a 5-wave pattern in the direction of the trend, followed by a 3-wave corrective pattern. These waves can be seen on all timeframes and help traders identify potential entry and exit points in the market.
Key Concepts of Elliott Wave Theory:
1. Impulse Waves (The Trend)
2. These are the waves that move in the direction of the overall trend. They are labeled 1, 2, 3, 4, 5 and represent the price movement in the main direction of the market.
* Wave 1: The initial move up (or down in a bearish market). I like to mark up the first wave how I do my Fibs, from the point where price showed a major impulse.
* Wave 2: A correction of Wave 1 (it doesn’t go lower than the starting point of Wave 1).
* Wave 3: The longest and most powerful wave in the trend.
* Wave 4: A smaller correction in the direction of the trend.
* Wave 5: The final push in the direction of the trend, which can be shorter and weaker than Wave 3.
3. Corrective Waves (The Pullbacks)
4. After the five-wave impulse, the market enters a corrective phase, moving against the trend. This corrective phase is generally a 3-wave pattern, labeled A, B, C:
* Wave A: The initial correction, typically smaller than Wave 3.
* Wave B: A temporary move against the correction (it often confuses traders who think the trend has resumed).
* Wave C: The final move against the trend, usually the strongest and most aggressive.
How to Implement Elliott Wave on BTC/USD:
Let’s break down how you can apply the Elliott Wave Theory to BTC/USD using a simple example.
1. Identify the Trend
2. Start by identifying the current market trend for BTC/USD. Are we in an uptrend or downtrend? This will determine whether you’re looking for a 5-wave impulse up (bullish) or down (bearish).
3. Locate the Waves
4. Look for the five-wave structure in the trend direction. Once you identify a potential impulse move, label the waves accordingly:
* Wave 1: A new uptrend starts.
* Wave 2: A small pullback (usually less than the size of Wave 1).
* Wave 3: A significant surge in price, often the most volatile.
* Wave 4: A smaller pullback or consolidation.
* Wave 5: The final push higher, which might show signs of exhaustion.
5. Corrective Phase
6. After completing the 5-wave impulse, expect a corrective 3-wave pattern (A, B, C). These corrections typically last longer than expected and can often confuse traders.
* Wave A: Price starts to reverse.
* Wave B: A retracement that may confuse traders into thinking the trend is resuming.
* Wave C: A strong pullback that brings the price even lower.
7. Use Fibonacci Levels as confluence
8. One of the most powerful tools in Elliott Wave analysis is Fibonacci retracement levels. You can use these to predict potential levels where Wave 2 and Wave 4 could end, or where Wave C might complete the correction. Common retracement levels are 38.2%-50% for Wave 4, and 50-61.8% For Waves 2 and B but keep in mind, these wave can retrace up to 100% before the wave analysis becomes invalid. But ideally these points are where you look to make an entry.
Wave 2 Example:
This one hit the golden spot (0.5-0.618) perfectly and continued to push upward.
Wave B and C Example:
This example hit closer to the 0.786 level which is also a key level for retracement.
Wave 4 Example:
This one hit the golden spot (0.382-0.5) for Wave 4 perfectly before continue the bullish momentum.
I try to use the RED levels below (1.1 and 1.2) as my invalidation (Stop Loss) levels and the GREEN levels (-0.27 and -0.618) as my Take Profit levels. Depending on your goals you can also use Fib Levels 0.236 and 0 as partial Take Profit levels.
9. Confirm with Indicators
10. To validate your Elliott Wave counts, use other indicators like the RSI (Relative Strength Index), MACD, or Moving Averages. For example, a Wave 3 might occur when the RSI is above 50, indicating strength in the trend.
In this example you can see the RSI cross the 50 threshold and the 3rd Wave form.
Continuation after the Wave is complete:
Tips for Trading with Elliott Wave Theory:
* Stay Flexible: Elliott Wave Theory is not set in stone. If the market doesn’t follow the expected pattern, adjust your wave counts accordingly.
* Don’t Rely on One Timeframe: A 5-wave structure on one timeframe may be part of a larger wave pattern on a higher timeframe. Always analyze multiple timeframes.
* Wave Personality: Waves don’t always look the same as stated earlier. Wave 2 can retrace up to 100% of Wave 1 and Wave 4 should generally not overlap Wave 1 or this may invalidate the Wave structure.
* Risk Management: Always use proper risk management techniques. No theory is perfect, so make sure you have a stop-loss in place to manage your risk.
Conclusion: Using Elliott Wave Theory on BTC/USD:
The Elliott Wave Theory can be a powerful tool for analyzing and forecasting price movements. By identifying the 5-wave impulse and 3-wave corrective patterns, you can gain insights into potential market direction. Just remember to use it alongside other tools and indicators for confirmation, and don’t forget to manage your risk.
As you apply it to BTC/USD or any other asset, remember that the market doesn’t always follow the "ideal" patterns, and flexibility is key. Practice on different timeframes, refine your skills, and use the theory as a part of your overall trading strategy.
Final Thoughts:
If you're just starting, don't get discouraged if you miss a wave or two. Trading is a journey, and with patience and practice, you'll begin to spot these patterns more naturally. Whether you’re analyzing Bitcoin's price action or any other asset, Elliott Wave Theory can give you a deeper understanding of market psychology.
Good Luck and Happy Trading!

COIN long -- currently in Wave 3 of 5 wave advance I've been using Elliott Wave Theory to look at COIN's price action. We seem to be in the middle of Wave 3.
- Wave 1: April 7, 2025 to May 22, 2025
- Wave 2: May 23, 2025 to June 13, 2025 - we pulled back right below the 23.6% Fibonacci retracement level with ~$244 serving as support.
- Wave 3: June 14, 2025 - now. The third wave usually has 5 distinct sub-waves. As of July 7, 2025 We appear to be in the 3rd sub-wave of wave 3. Using the upper channel line, price target for this wave is around $408-$410. Quite possible if we see BTC move up explosively, which also seems imminent given the highest weekly close on July 6, 2025.
COIN is a very volatile stock that has explosive moves to the up and downside. I think we still have more room to run in this current wave 3--even beyond sub-wave 1 peak at $380.

Elliot WaveOn the 4hr you could see that wave C is in progress. On the daily gold is currently busy with a Wave 5. Once Wave C is finish on 4hr we might get a movement up . Wave ABC on the 4hr is a pullback on the daily.

Riding the Wave: Breakout Trading with Elliott Wave AnalysisHello Friends,
Welcome to RK_Chaarts,
Today we're going Analyze the chart of " HASBRO. " to identify a trend change opportunity.(Educational Post).
Let's get started!
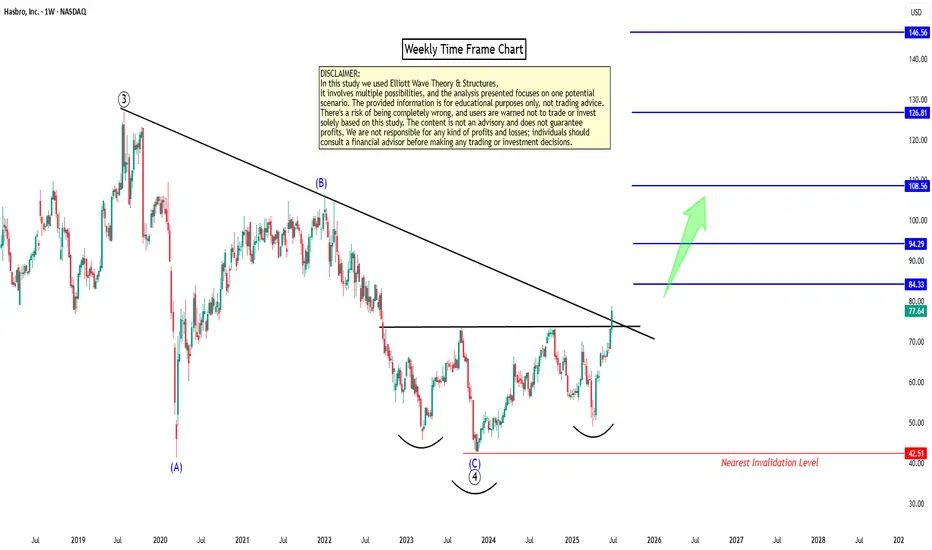
Today, we analyzed the weekly chart of "HASBRO" using Elliott Waves theory and chart patterns. We clearly observed that the July 2019 top, with a high of 126.87, completed a primary degree Wave ((3)) in Black. The recent bottom in November 2023, around 42.69, marked the end of primary degree Wave ((4)) in Black. Since then, the price has formed a higher high and low, indicating a potential reversal.
The recent weekly candle close has broken out of the Resistance trendline and also confirmed an inverted head and shoulders breakout along with good breakout in RSI on weekly-cum-monthly time frames. This suggests that we may be unfolding a primary degree Wave ((5)) in Black, which should consist of five sub-divisions of Intermidiete degree in Blue. Based on the chart, it appears that Intermidiete degree Waves (1) and (2) in Blue are complete, and Wave (3) may have started.
Resistance Trendline Breakout with Inverted Head n Shoulder Breakout
RSI Breakout on Weekly
RSI Breakout on Monthly
Major EMAs Support on Daily, Weekly & Monthly
Both Elliott Wave theory, EMAs support, Trendline Breakout and chart pattern Breakout indicates that the price is likely to move higher from here. However, please note that technical analysis is a game of probabilities, and there's always a chance of being wrong.
To mitigate this risk, we've marked an invalidation level around 42.69. If this level is breached, our analysis would be invalidated.
Projecting the target for Wave ((5)) using the 123.6% of Wave ((4)) measurement, we get a long-term target of around 146.56. This is a possible target, but please keep in mind that this is an educational study and not a trading tip or advice.
Before making any trading decisions, please conduct your own analysis or consult with a technical expert or financial consultant.
I am not Sebi registered analyst.
My studies are for educational purpose only.
Please Consult your financial advisor before trading or investing.
I am not responsible for any kinds of your profits and your losses.
Most investors treat trading as a hobby because they have a full-time job doing something else.
However, If you treat trading like a business, it will pay you like a business.
If you treat like a hobby, hobbies don't pay, they cost you...!
Hope this post is helpful to community
Thanks
RK💕
Disclaimer and Risk Warning.
The analysis and discussion provided on in.tradingview.com is intended for educational purposes only and should not be relied upon for trading decisions. RK_Chaarts is not an investment adviser and the information provided here should not be taken as professional investment advice. Before buying or selling any investments, securities, or precious metals, it is recommended that you conduct your own due diligence. RK_Chaarts does not share in your profits and will not take responsibility for any losses you may incur. So Please Consult your financial advisor before trading or investing.
A Step-by-step Guide to One of the Chart Analysis Method: VOLTASHello Friends,
Welcome to RK_Chaarts,
Today we're going to learn step-by-step guide to one of the chart analysis Method by analyzing a chart of " VOLTAS LTD. " to identify a trend change opportunity.(Educational Post).
Let's get started!
Applying Elliott Wave Theory
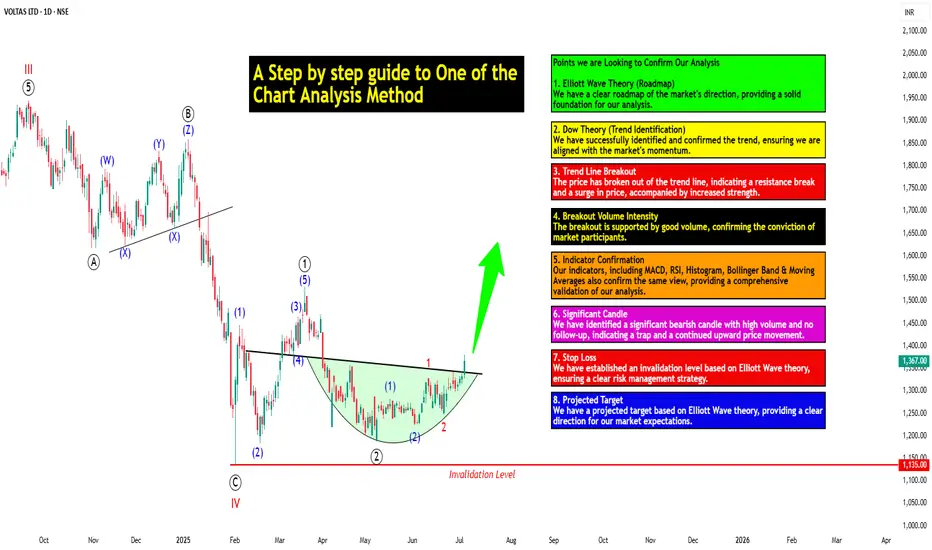
According to Elliott Wave theory, we can see that the high of September 20, 2024, marked the end of the wave III of the cycle degree in Red. After that, a corrective wave unfolded, which reached its low on February 1, 2025. This was the wave IV of the cycle degree in Red, with a low of 1135.
The approximately 6 months correction ended here, and now the wave V of the cycle degree in Red has begun. Within this, there will be five sub-divisions of primary degree in black, which we can label as waves ((1)) to ((5)). Of these, waves ((1)) and ((2)) are complete, and we are possibly now in wave ((3)) of the Primary degree in Black.
Within wave ((3)), there will be five sub-divisions of intermediate degree in blue, of which waves (1) and (2) are complete, and the (3)rd intermediate degree in Blue is underway. Within this, there will be five sub-divisions waves of minor degree in red, of which 1 and 2 are complete, and today we saw the breakout of the 3 of the (3).
Possibly, this is a momentum move according to Elliott Wave theory, which we can call the third of the third of the third.
Now that we have this low of wave IV at ₹1135, it should not go below this level according to Elliott Wave theory. If it does, our current wave count will be invalidated. That's why we have an invalidation level within Elliott Wave, which according to this chart is at ₹1135. This low should not be breached. If it is breached for any reason, we'll have to re-analyze our entire count, and the counts could be different.
However, if this low holds, then the minimum target for wave V, based on the projection of wave theory, would be at least 100% to 123% of the fall from top III to bottom IV, which could take it to around ₹2000 to ₹2100. Shown in chart image below
Possible Elliott Wave Counts on Daily Time Frame Along with Invalidation level & Target levels.
Dow Theory Suggests now Up Trend
After forming the top of wave III, we can see that the price has moved downwards in a pattern of lower highs and lower lows. However, after completing the bottom of wave IV, the price has started forming a pattern of higher highs and higher lows, indicating that an uptrend has begun.
This is a clear signal that supports our wave counts moving upwards, i.e., towards an impulse move, based on Dow theory. The successful completion of wave IV and the initiation of the higher highs and higher lows pattern suggest a strong bullish trend, and we can expect the price to continue moving upwards. Shown in chart image below
Breakout with good intensity of Volumes
In this chart, we've observed a rounding bottom type chart pattern, and today, we've seen a breakout above the upper resistance trend line. Today's candle volume is also significantly higher than the average. Shown in chart images below
Chart Pattern: Rounding Bottom
Resistance Trendline Breakout with Good Intensity of Volumes
Supporting Indicators & Moving Averages
Also we can see that the current price has closed above the 50-day EMA and 100-day EMA. Additionally, indicators like RSI is above 60 and showing momentum, MACD is positive and above the zero line, and the histogram is also showing a breakout. Shown in chart images below
Breakout above 50DEMA & 100DEMA
RSI Breakout above 60+ on Daily Time Frame
Bullish side Breakout in Histogram on Daily Time Frame
MACD running Positive & above zero line on Daily Time Frame
Bollinger Band on Weekly
If we look at the weekly time frame, the current week's candle is above the middle Bollinger Band, indicating that the price is above the 20-period simple moving average on the weekly time frame. which is very good sign. Shown in chart image below
Price Trading above 20 SMA on Weekly Time Frame (Mid.Bollinger Band)
Significant Observation in Price Action & Volumes
Before the breakout, the rounding bottom chart pattern that was forming at the bottom can be interpreted as accumulation, as a red bearish candle with high volume appeared, marking the highest volume. Notably, no candle has closed below the low of that candle since then.
Although a gap-down candle occurred, it opened and closed bullish, indicating no selling pressure below that level. The absence of bearish follow-up and the subsequent breakout today are significant observations, combining price action and volume. This is a positive sign suggesting the price may move upwards. Shown in chart image below
This is how chart analysis is done for investment purposes. We've seen many signs in our favor, and yet we still use a stop loss to prevent significant losses in case the stock or market moves unexpectedly. This is what stop loss is all about - minimizing potential losses.
We've also discussed the target projection based on Wave theory, 123.6% level, which we explained through an image. So, friends, I hope you've understood the entire conclusion and learned how to analyze charts using different methods, one of which we shared with you today.
I am not Sebi registered analyst.
My studies are for educational purpose only.
Please Consult your financial advisor before trading or investing.
I am not responsible for any kinds of your profits and your losses.
Most investors treat trading as a hobby because they have a full-time job doing something else.
However, If you treat trading like a business, it will pay you like a business.
If you treat like a hobby, hobbies don't pay, they cost you...!
Hope this post is helpful to community
Thanks
RK💕
Disclaimer and Risk Warning.
The analysis and discussion provided on in.tradingview.com/u/RK_Chaarts/ is intended for educational purposes only and should not be relied upon for trading decisions. RK_Chaarts is not an investment adviser and the information provided here should not be taken as professional investment advice. Before buying or selling any investments, securities, or precious metals, it is recommended that you conduct your own due diligence. RK_Chaarts does not share in your profits and will not take responsibility for any losses you may incur. So Please Consult your financial advisor before trading or investing.
A Step-by-step Guide to One of the Chart Analysis MethodHello Friends,
Welcome to RK_Chaarts,
Today we're going to learn step-by-step guide to one of the chart analysis Method by analyzing a chart of " Varun Beverages Ltd. (VBL) " to identify a trend change opportunity.(Educational Post).
Let's get started!
Applying Elliott Wave Theory
First, we can see that the bottom formed in March 2025 is likely a Wave ((4)) in Black as a bottom, marked as such on the chart. From there, Wave 5 should move upwards. Looking at the daily timeframe, we can see that price gone up in five sub-divisions of Wave (1) in Blue of Wave ((5)) in Black have completed, marked as Red 1-2-3-4-5, that means blue intermediate Wave (1) has ended, and Wave (2) has begun, which is unfolded in corrective nature marked as WXY in Red of Wave (2) in Blue.
According to the wave principle, Wave (2) should not retrace more than 100% of Wave (1), which started from the 419.65 bottom. Therefore, 419.65 becomes our invalidation level. If the price moves below this level, it would invalidate our Wave (2) principle.
Assuming our wave counts are correct, the upward movement is in the five sub-divisions, and the downward movement is in the three sub-divisions. Definitely, the conviction is increasing that we have correctly identified Waves (1) and (2). Shown in chart image below
Tweezers at Bottom
Now, we can see that Wave 2 has retraced more than 70% and has formed a Tweezer candlestick pattern at the bottom. A bearish candle was followed by a bullish candle, both with a Tweezer-like shape, with the second candle being green. This could indicate a potential reversal. Moreover, the latest candle has also taken out the high of the previous two candles, showing follow-through. The price has also shown follow-through on the upside after that. So, this can be considered as the first sign that Wave 2 might be ending, marked by a significant Tweezer pattern at the bottom with a follow-through candle. Shown in chart image below
Significant Breakout Pending Yet
Secondly, from the top where Wave 1 ended, we've been considering the decline from around 560.50 as a resistance. We drew a resistance trend line, and if the price breaks out above it, we can say that the resistance trend line has been broken, indicating a breakout above the last fall's trend line, Which is not Broken yet. Shown in chart image below
Dow Theory
The Dow Theory states that when the price moves up, it forms a Higher High, Higher Low pattern, and when it moves down, it forms a Lower High, Lower Low pattern. Somehow, the Dow Theory also needs to change, as the last swing was forming a Lower High, Lower Low pattern. The last swing high was at 479, which we marked with a green arrow. If the price crosses above it, we can say that the price is now forming a Higher High pattern. This indicates that the Dow Theory is changing from a falling trend to a rising trend. Shown in chart image below
Stop Loss
Once the Dow Theory also changes, we can use the last swing low at 446.15 as our stop loss. However, this stop loss will only be valid after the Dow Theory changes; otherwise, the invalidation level will remain at 419. Shown in chart image below
Projected Target of Wave (3)
So, friends, we've applied the Elliott Wave principle, and there's been a significant retracement, all within the valid range, without violating any rules or triggering invalidation. There's limited room left on the downside, and then we have the Tweezer candlestick pattern, which is a significant sign. We're expecting a reversal from there, and the price has followed up with an upward move.
What's left now is the breakout above the resistance trend line and a change in the Dow Theory. Once these two conditions are confirmed, all parameters will match, and we can add a position to our portfolio using the last swing low as our stop loss, instead of the invalidation level.
This is how chart analysis is done for investment purposes. We've seen many signs in our favor, and yet we still use a stop loss to prevent significant losses in case the stock or market moves unexpectedly. This is what stop loss is all about - minimizing potential losses.
We've also discussed the target projection based on Wave theory, 161.8% level, which we explained through an image. So, friends, I hope you've understood the entire conclusion and learned how to analyze charts using different methods, one of which we shared with you today.
I am not Sebi registered analyst.
My studies are for educational purpose only.
Please Consult your financial advisor before trading or investing.
I am not responsible for any kinds of your profits and your losses.
Most investors treat trading as a hobby because they have a full-time job doing something else.
However, If you treat trading like a business, it will pay you like a business.
If you treat like a hobby, hobbies don't pay, they cost you...!
Hope this post is helpful to community
Thanks
RK💕
Disclaimer and Risk Warning.
The analysis and discussion provided on in.tradingview.com is intended for educational purposes only and should not be relied upon for trading decisions. RK_Chaarts is not an investment adviser and the information provided here should not be taken as professional investment advice. Before buying or selling any investments, securities, or precious metals, it is recommended that you conduct your own due diligence. RK_Chaarts does not share in your profits and will not take responsibility for any losses you may incur. So Please Consult your financial advisor before trading or investing.

UX2! Uranium Futures OutlookExpecting a continuation higher on COMEX:UX2! uranium futures, looking for a wave 5 in red to unfold.

USDJPY – Triangle Complete? Wave (v) Setup BuildingWave (iv) appears to be ending with an (e) wave tag into the 0.764 retracement.
📉 Price remains capped within the contracting triangle — watching closely for breakdown confirmation.
If this plays out, wave (v) of C could now begin unfolding with initial focus on 140.00 and below.
🧩 Structure: (a)-(b)-(c)-(d)-(e) triangle complete
📏 Final wave (e) aligns with 0.764 retracement and structural resistance
⚠️ RSI divergence + weakening momentum support the bearish scenario

BTC.D(based one NEowave)the Z wave of this branch shown as a triangle and I think its finished but for confirmation breaking the 61.9 is important.
its a green light of Altseason.

SPX6900 - Time to Get Aggressive and Flip SPX🔥 CRYPTO:SPX6USD With a new ATH on the horizon, wave (3) is eyeing $2.4 - $3.1 as the next target. But this is just the start, momentum is building and summer volatility could push prices even higher!

BTCUSD analysis for this cycle TopBTCUSD analysis for this cycle Top
1. According to the Elliot wave it is the 5th wave of elliot theory
2. As per the time cycles Btc should define the top in the last quarter of this year possibility in (oct or nov)
3. And for the projection as always the Btc favourite patthen AB=CB is also in play.
4. Fib extension tool level 1.618
So as we can see if btc will play according to this analysis. As its always follows this same things again & again in all cycle. So we can expect the top somewhere around (165,000).

S&P500: Approaching the 88.70% RetracementThe S&P 500 continued its climb, nearing the 88.70% Fibonacci retracement level. The top of magenta wave (B) has not yet been confirmed, so under the primary scenario, we continue to expect further upside into the magenta Target Zone between 5,880 and 6,166. Once that zone is reached, wave (C) is expected to take over and drive the index into the next Target Zone — the green zone between 4,988 and 4,763. Short positions initiated within the upper zone remain viable and can be protected with a stop 1% above the top of the range. The alternative scenario — assigned a 40% probability — assumes the rally will continue directly into wave alt.(III) in blue, with a breakout above the 6,675 resistance. Over the long term, we continue to expect one final impulsive leg higher in blue wave (III) once the broader green wave correction is complete. This should take the S&P 500 well above the 6,166 mark.
📈 Over 190 precise analyses, clear entry points, and defined Target Zones - that's what we do.
