III | Elliott Wave Projection - Corrective A Possible Breakout?Price action and chart pattern trading
> Elliott Wave projection - a possible breakout of corrective wave A position at 0.618 retracement of previous wave 5.
> Target Wave B zone estimated at 0.618-0.786 of the current wave A uptrend + 15 - 18% upside again
> Stoploss at the lowest wave A position plus ADR average day range -5 - 7% downside
> RRR 2:1 for short term trade
Always trade with affordable risk and respect your stoploss
Elliottwaveprojection

BTC ForecastBitcoin Forecast
Technically the correction (II) in the super cycle degree (red) should have reached the 12,230 level to end the correction and start the new bullish cycle. However, the possibility that this will not happen is high as it seems that in Nov 2022 we ended this long corrective cycle.
Even though another push low is not 100% discarded, we forecast that the new bullish cycle is already in place. Therefore once we have a bullish sequence, we will be interested in buying BTC. This can happen this week. We will keep you updated.
In the alternative scenario where BTC makes another lower low, we would buy it if the price reaches the 12.3 k level.
Please remember to do not to risk more than 2% of your account on each trading idea

JMART | Wave Projection | Target Downtrend Reversal BreakoutPrice action and chart pattern trading setup
> Contracting Wave Channel pattern with downtrend target around the corner.
> Entry @ minor downtrend channel in daily timeframe breakout above SMA200
> TP1 @ wave (3) position
> TP2 @ wave (5) III position for medium term
> Stoploss @ SMA200 downside -9% RRR: 2:1
Indicators signals not shown here:
> Smart money volume support
> Banker chip entry signal

9988|Alibaba Wave Projection | Bullish Divergence - Rebound?Price action and chart pattern trading - Minor downtrend ending diagonal pattern with MACD bullish divergence
> A possible wave 4.3 minor downtrend wave at the lower support 0.786 extension of wave 4.1 and upcoming rebound wave 4.4 to 0.382 - 0.5 fibonacci retraced from wave 4.3.
> Target upside +10 - 12% while downside is -6%, RRR: 1.5:1
> The final downtrend wave 5 could be slightly below Target H&S zone.
Always trade with affordable risk and respect your stoploss, nothing is 100%

SPX clearly is going nowhere for nowTime for me to give my view on SPX for probably the next month.
The EWT in this chart should only be used as a guide. It's very subjective and price action and geometry are what I give more weight, so lets discuss that for now. I'll also focus a bit on the indicators below the chart as well.
First, notice the sell signal in January of 2022 which was the top of SPX. You had a sell signal on both the wave master and the momentum indicator that was stating that we were are the top of the price action.
Next, notice the two times we got buy signals with confluence in both indicators. June 17, 2022 and October 13, 2022. These are both on the daily timeframes. Both times resulted in significant rallies.
Finally, notice the last sell signal that we got. February 8, 2023. That is the first sell signal we've received in over a year (if you are solely looking for confluence across both indicators - which you should be). We've had a decent decline so far.
Ok, now lets move to trendlines.
First, notice the downtrend line (DTL) from the ATH down to the recent price pivot yesterday. This trendline is very important and I do not expect we will break it. Remember, this is an index made up of 500 stocks, so there's 500 different factors that will move this train. Likely, there will be money rotating in these underlying stocks which will keep price action above this DTL.
Second, notice the uptrend line (UTL) from the low in October which is marked in yellow. We broke it. I suspect we will stay below this for quite a while. If we get back above it in the next few trading days, that would be the most bullish thing I've seen in a long time.
Third, the price action between both trendlines is forming somewhat of a chuvashov fork. We'll likely just stay within the bounds of both trendlines until probably at least april before starting another trending move.
Ok. Now how about sentiment.
I'm starting to see more doomsday charts out there. It's not to the craze I'd like to see in order to flip bullish so this chop is probably going to build some kind of formation to feed the bears. I think we need more time to develop and this fork is going to really help define the future, at least short term, a bit.
There's also a LOT of bulls out there that are talking about this DTL. We just successfully retested it. Is this a valid correction from my green wave A to complete wave B (green)? I don't think so. I think more time is needed.
Why?
TIME TIME TIME TIME TIME
Look at the time it took to get from the bottom in October to the top in January. October. January. 4 months. Are you teling me the whole dang thing finished correcting in 3 weeks? Doubtful. We need more time. At least 8 weeks if we go half of the time. We're at the point now that a lot of people are getting 45DTE options OTM for upside plays and people late to the party shorting as well. Let's decay those options and squeeze them out.
Give the market some time and by all means, make everything a short term play for now. We're likely in for a boring month but if the market decides to really get volatile, I'll be ready for that, too.

KBANK | Elliott Wave - Wave 4 Support - Target Bull Pennant +30%Price action and chart pattern trading setup
> Overall wave pattern moving in diagonal uptrend with a possible wave 4 triangle sideway.
> Now making a strong pullback to triangle support could be E- wave of ABCDE pattern at EMA200W zone
> Entry : A false triangle breakdown for a possible long entry between S1 and possible S2
> Target : bullish pennant at major wave 5 diagonal zone +30%.
> Stop: Slightly below S2 -5%
Always trade with affordable risk and respect your stoploss
Good Luck

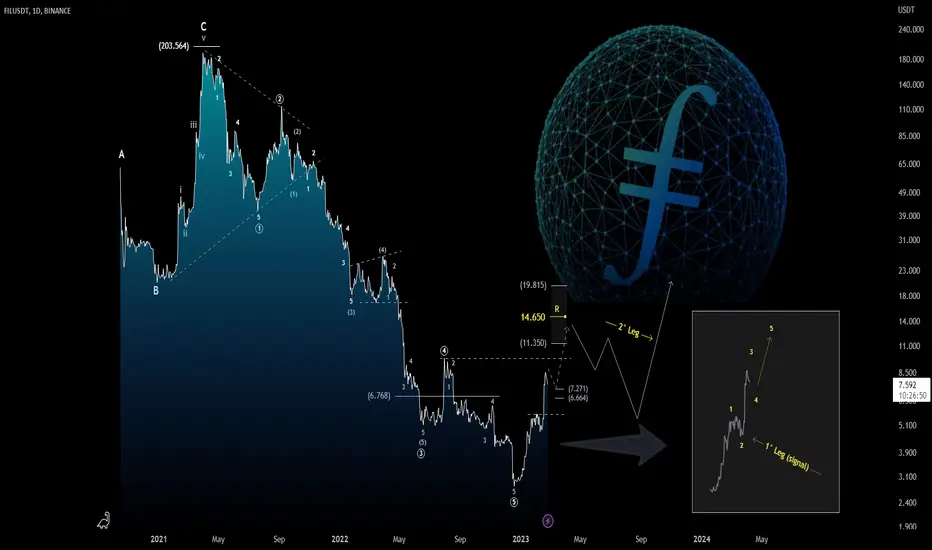
Filecoin ($FIL): Technical Analysis on Daily ChartHi everyone!
From a technical point of view, the trend on the daily chart is absolutely bearish, but at the same time, with the completion of the bearish impulsive structure (12345), I do not exclude the continuation of the corrective structure (bullish) in play. At the moment we do not have a confirmed bullish signal yet, but if in the short term we manage to trigger another bullish leg before the pullback, the trend could turn bullish again in the medium term. Technically speaking, in the short term, we have a support area around 7.26/6.66 and if $FIL is to turn bullish, it should be held.
Trade with care! 👍 ...and if you think that my analysis is useful, please..."Like, Share and Comment" ...thank you! 💖
Cheers!
N.B.: Updates will follow below
Gold ForecastGold Forecast
Gold is in a bullish cycle, and we will look for long opportunities when we see a clear 3 legs-down corrective structure. Unfortunately, the connector (B) of the current (A)(B)(C) is too shallow and it does not retrace enough according to our strategy to allow us to enter when the price reaches the IZ (grey zone). We do expect the price will bounce from the IZ, but it can be only the connector from a deeper (W)(X)(Y), so we are not going to take this trade.
What to do? 2 scenarios:
-The prices resume the bullish cycle ->We should wait for the price to break the 1,960 level before looking for buying opportunities.
-The price makes a deeper correction-> A new IZ will be created, and we will analyze its structure to check whether it is tradable or not.
In any case, we will keep you updated on the TRS community
Please remember to do not to risk more than 2% of your account on each trading idea

EA | Wave Analysis | Short Position - 3.C wave correction -25%Price action and chart pattern trading:
> A possible 3.C wave correction position - pullback entry at EMA20 zone - Target EMA200W / Fibo 0.5 retracement previous major 1 wave zone -25% downside - Stoploss @ wave 3.b position -10-12%
> Fundflow RSI tapping oversold zone but no bullish divergence signal
> BBD below 0 baseline potential lower price trending
> KDJ Stochastic downtrend ribbon continued

GBPUSD500 PIPS INCOMING ON GBPUSD , A healthy correction happened with 0.786 retracement , according to ew looks like impluse going to begin !

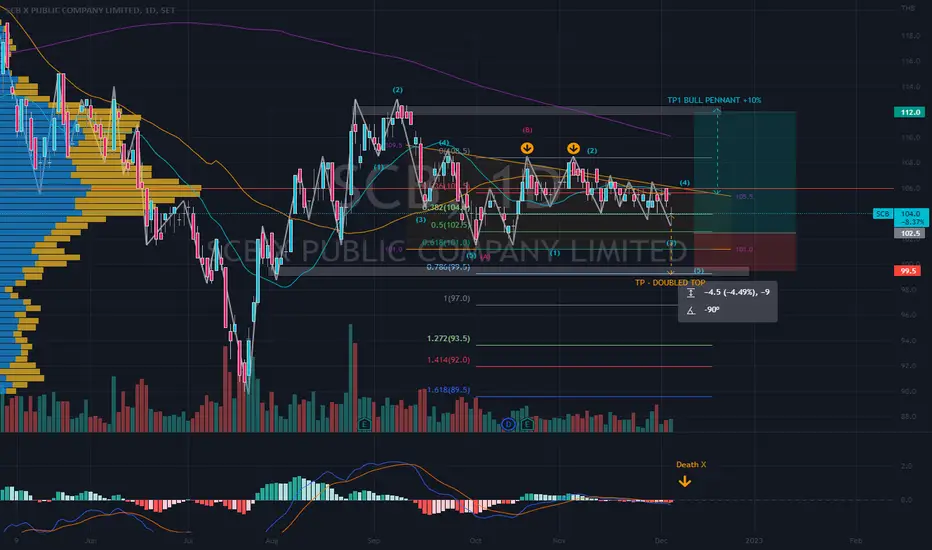
SCB | Wave Projection | Pullback Trade @ Bullish Pennant SupportPrice action and chart pattern trading:
> An possible ABC correction scenario with bullish pennant pattern or descending triangle
> The price currently SMA20 crossing below SMA50 with MACD crossing down bearish support indicator
> PULLBACK TRADE @ bullish pennant support level at a further breakdown with local doubled top pattern targeting -4.5% downside to fibonanci 0.786 extension of previous A-wave support level.
> Risk Reward Ratio 3:1
Always trade with affordable risk and respect your stoploss!
Titan Short (Ending Diagona Pattern & Double Top)with SL 2551Just for Educational Purpose
Close Below Trendline is imp for Short !!!!
Also a Double Top Formation .....
SL can be Put at 2551 lvls.....

Is Hook/USDT headed for a retracement ?It Seems that we are about to see a bounce (leg B in blue - 8h view) then the deep retracement to C (purple, 1d view)

ICICI Bank Triangle Pattern Breakout at Break of B-D Trendline..On Break of B-D Trendline .... Long Can be taken with SL Around ..... 849
And can Expect Targets around 890 levels

AOT | Wave Projection | Rising triangle ABCDE Uptrend TargetPrice action and chart pattern trading setup
> Rising triangle ABCDE pattern @ breakout neckline position
> TP1 estimated @ height of E wave +17% upside 1.618 extension of CDE wave
> Stoploss @ triangle support -8% downside
> RRR: 2:1
Always trade with affordable risk and respect your stop

critical area for Silver (XAGUSD)Traders , Silver retraced 50% fibo retracement from the extended 3rd wave based on elliott count!!
we are looking to long silver now with a 23$ as first target.
for short term scalping kindly wait for a 20cent pullback from here before buying the commodity.
good day!!

Elliot Wave Analysis For EURGBP Today 20 Feb 2023 Daily AnalysisHere on daily time frame EURGBP is like to push up little bit then and move down using the Elliot wave

GOLD: Consolidation in near term?Hello everyone!
From a technical point of view, the major trend is bullish on large time frames, but in short term looking at the intraday chart, a consolidation of retracement around 1.844 area is possible. If we look on the hourly chart, the Price Action should develop a harmonic structure with the same target area. That said, the area around 1.883/1.891 is a strong resistance where the market will try to sell the yellow metal, we'll se....
...trade with care! 👍
Cheers!
N.B.: Updates will follow below
If you think that my analysis is useful, please...
"Like, Share and Comment" ...thank you! 💖

POTENTIAL BEARISH BAT FORMING ON QQQI believe there's another leg down coming the Q'S. I have highlighted where it may reverse. There's a potential bearish harmonic bat completing in the coming days and weeks. Good luck!

GBPJPY Complex CorrectionHello Traders,
Here is an analysis of GBPJPY. It seems that this pair is already completing the WXY structure and thus will move to the downside. Alternation is a break above the trendline and can be a new movement to the upside. I might be wrong but the bias is more to bearish structure

USDCAD SELLI expect USDCAD to drop in the following days, because it is at the resistance zone of the M15 and M30 price channels respectively. Secondly, it overextended price in order to fulfill EW impulsive move evident through the divergence on TDI and Awesome oscillator. As such, the correction of that count is expected. My short term target is resistance zone that was broken during the upside move around 1.34778. If broken, I will expect price to drop further.

ADVANC | Elliott Wave Projection | Complex Inverted H & SPrice action and chart pattern trading
> Elliott Wave projection possible the end of Intermediate 4-wave downtrend
> Complex inverted head & shoulders formation ABC uptrend correction
> Bullish divergence in previous 5-wave downtrend confirmation
> Entry @ neckline breakout - RSI downtrend breakout
> Target @ C-wave uptrend 1.618 extension of A-wave near volume profile POC
> Stoploss @ B-wave right shoulder
> RRR: 2:1
Always trade with affordable risk and respect your stop

NIFTY IN BEAR HANDS'C' Wave started violently from 24th Jan'23 .it formed as 3 wave pattern
An open statement of short position and news may panic investors to offload nifty constituents
it is easy to find out targets for c3,c4,c5 and tgt time also
