EUR/USD Wave Analysis Buy Set UpI am looking for a buy set up, I believe we are in a impulsive wave with a completed 3 wave corrective flat structure.
Elliottwaveretracement

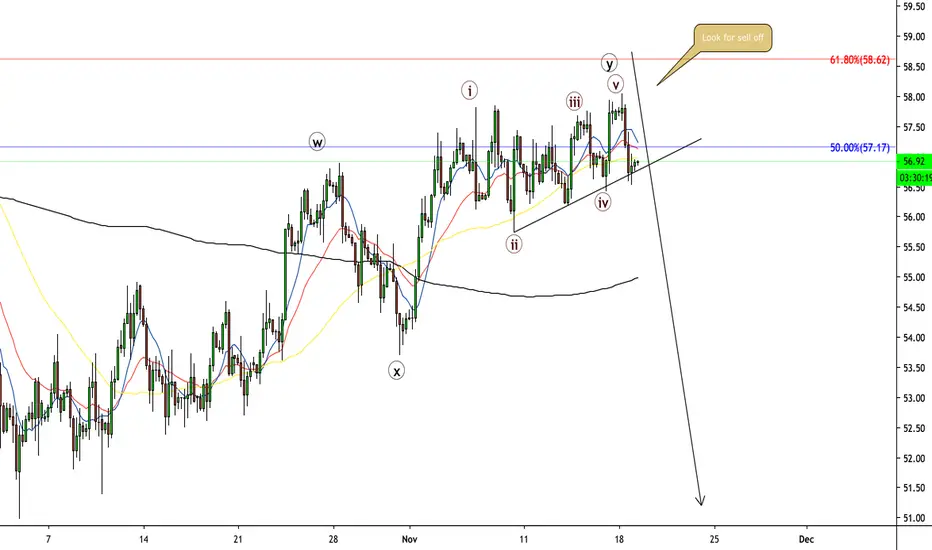
Oil Wave Analysis Potential Sell Set UpI believe Oil is finish a "W-X-Y" corrective structure. It appear that wave Y could be completing a ending diagonal. I am looking for a reveral in price and a swift move to the downside
Gold Wave Analysis 3 Potential Trade Set UpsGold is setting up for some really good trading set ups. Depending on what type of trader you are, Trend following or counter trend, will determine which set up is suitable for your trading plan. The arrows give somewhat of a map of the movement that I am expecting to take place.

GBP/NZDI am looking at the choppy sideways movement in GBP/NZD as a corrective Triangle structure. This week I will be looking for price to break out impulsively pushing higher

Gold Wave Analysis Potential Trade Set UpWatch as I forecast Gold and identify potential trade set ups

US Dollar Wave Analysis Potential Trade Set upsWatch as I forecast potential trade set ups on the US Dollar

Harmonic Elliott Wave Analysis GBPJPYLooks Like we are at the final stages of wave 5 which will be the end of a bigger uptrend wave A and we should begin the correction (wave B ) on the downside.

Elliott Wave View: SP) Looking to Break to All Time HighS&P 500 (SPX) has been sideways since January 2018 and it’s also sideways more recently since July 26 high. After forming peak at January 22, 2018 at 2872, the Index managed to make two more marginal highs. However, each time, the new marginal high lose the momentum and pullback again.
Current short term outlook suggests the rally to 3022 ended wave (1) and the decline to 2855.6 ended wave (2). In this proposed count, the Index should then be in wave (3) as a 5 waves impulse Elliott Wave structure. Up from 2855,64, wave 1 should end soon as 5 waves in lesser degree. Wave ((i)) ended at 2959.75 and wave ((ii)) pullback ended at 2892.66. Index then resumed higher in wave ((iii)) towards 3003.28 and wave ((iv)) pullback ended at 2985.20.
Expect Index to end wave ((v)) of 1 soon, then it should pullback in wave 2 to correct cycle from October 3 low (2855.64) before the rally resumes. The Index still needs to break above wave (1) at 3022 to validate this bullish view. As far as pivot at 2855.64 low stays intact in the dips, expect Index to extend higher.

Elliott Wave View: BAC Starts the Next Leg HigherBank of America (ticker: BAC) shows an Elliott Wave bullish sequence from August 15, 2019 low, favoring further upside. The decline to 27.19 ended wave (2) and the stock has resumed higher in wave (3). The internal of wave (3) is unfolding as a 5 waves impulse Elliott Wave structure where wave 1 of (3) is expected to complete soon.
Up from 27.19 low, wave ((i)) ended at 28.62, wave ((ii)) ended at 27.46, and wave ((iii)) ended at 30.72. Expect the stock to pullback in wave ((iv)) and turns higher 1 more time in wave ((v)). The 5 waves move higher should end wave 1 of (3). The stock should then pullback in wave 2 to correct cycle from October 3 low (27.19) before the rally resumes again.
We don’t like selling the proposed pullback as it’s against the direction of right side tag. As far as pivot at 27.19 low stays intact, expect dips to find support in the sequence of 3, 7, or 11 swing for further upside. Potential target to the upside is 100% Fibonacci extension from August 15, 2019 low towards $31.2 – $32.2.

Elliott Wave View: Nikkei Buyers in ControlNikkei shows Elliott Wave bullish sequence from December 26, 2018 low and August 26, 2019 low. This suggests that buyers are in control and favors further upside in the Index. The pullback to 21079 ended wave ((2)) and the Index has resumed higher in wave ((3)). Internal subdivision of wave ((3)) takes the form of a 5 waves impulse Elliott Wave structure.
Wave (1) of ((3)) is currently in progress as a leading diagonal. Up from 21079, wave 1 ended at 21650, wave 2 ended at 21325, wave 3 ended at 22265, and wave 4 ended at 21905. Expect Index to soon complete wave 5 of (1). Afterwards, Index should pullback in wave (2) to correct the cycle from October 3 low before the rally resumes. We don’t like selling the Index and expect buyers to appear in the sequence of 3, 7, or 11 swing as far as pivot at 21079 low stays intact.

Elliott Wave View: Bullish Sequence in DAXDAX shows Elliott Wave bullish sequence from August 15, 2019 low (11266.48) favoring more upside. The rally from 11266.48 to 12497.28 ended wave (1) as a 5 waves impulse Elliott Wave structure. On the chart below, we can see wave 3 of (1) ended at 12471.83, wave 4 of (1) ended at 12141.82, and wave 5 of (1) ended at 12497.28. Index then pullback in wave (2) and ended the correction at 11877.32.
Index has resumed higher and broken above wave (1) at 12497.28, signalling the next move higher has started. Up from 11877.32, wave ((i)) ended at 12097.43 and wave ((ii)) ended at 11933.02. Expect Index to see a few more highs before ending wave 1 of (3) a 5 waves from 11877.32. Index should then pullback in wave 2 to correct cycle from October 4 low (11877.32) in 3, 7, or 11 swing before the rally resumes. We don't like selling the Index.

Elliott Wave Patterns & Fibonacci Relationships Reference GuideElliott Wave Theory attempts to identify recurring price movements within financial markets and to classify them into a set of meaningful patterns, which can become a reliable tool for future price predictions. The underlying principle is that price-action unfolds via an endless alternation between trending and corrective cycles, while producing this effect on any relative timescale (Fractality) .
Elliott Wave (EW) price patterns are divided into motive waves (i.e. price movements that initiate progress in one direction and therefore create trend) and corrective waves (i.e. price movements that are reactionary in relation to the previous trend-setting move) . Corrective waves essentially attempt to revert or undo the movement that was initiated by the preceding motive wave.
How to use this guide
This EW reference guide provides an idealized drawing for each EW pattern, including a visualization of the most important internal wave size relationships. The images highlight the most common wave retracement and extension targets in red, followed by the next most common targets in orange, followed by the least common targets in grey.
Important Concepts To Remember Before Applying EW Counts
Wave Degrees
Elliott Waves are labeled in different degrees that are nested within each other due to the fractal nature of price movements. Please refer to your Elliott Wave drawing software for the appropriate names and symbols used for each officially defined degree. Alternatively, you may simply label different degrees with different-colored labels on your chart.
Alternation (“expect a difference in the next expression of a similar pattern”) :
EW patterns have the tendency to create alternation within them. This is reflective of nature’s general propensity towards dynamic balance. Following is a list of the main occurrences of alternation:
Alternation of corrective waves:
If wave 2 is sharp (i.e. zigzag or extended zigzag) and deep (i.e. deep in the sense of how much it retraces the preceding wave 1), then wave 4 will most likely going to be sideways (flat, combination, or triangle) and shallow relative to wave 3. The same applies in reverse but is less common. This is because triangles (which only appear during wave 4 inside a motive wave) are considered to be alternating to all other corrective patterns. That means even if wave 2 is a shallow sideways correction, a triangle can still appear in wave 4, but it is less likely.
Alternation also occurs in terms of wave complexity. If a potential bigger complex correction starts out simple at first, then expect complexity to increase during the following parts of the correction (i.e. simple-complex-most complex). The reverse can also apply (i.e. most complex-complex simple) but it is more rare.
Alternation of motive waves :
If wave 1 is short, then wave 3 is likely to be extended, and wave 5 likely to be short again. If wave 1 is extended, then wave 3 and 5 are most likely not extended. If neither wave 1 nor wave 3 is extended, then wave 5 probably will be extended. If wave 3 is extremely long and overstretched, wave is 5 more in danger of being truncated.
Balanced Proportions (“The Right Look”) :
It is important that waves within a 5-wave or 3-wave sequence show reasonably balanced proportions to each other… not just in terms of size/magnitude (which can generally be verified by Fibonacci retracement and extension ratios), but also in terms of time duration . This balancing can occur either via alternation and/or via equality.
Consider the following as an example for ‘balance through alternation’ : an impulse is showing a classic deep and short-lived wave 2, plus a shallow but time-lengthy wave 4. The time-lengthiness of wave 4 is in balance with the depth of wave 2, while the shallowness of wave 4 is in balance with the short-lived nature of wave 2, thereby creating balance through alternation.
The same need for balance applies for any motive waves within a 5-wave sequence (i.e. 1,3, and 5). The exception however will be the potentially extended wave within the sequence. It can/will be much larger in terms of magnitude and time than the other four waves, but the sub-waves (inside the extended wave) must show a balance to each other. The extended wave will also express relatedness to the other waves of the sequence by the angle of the overall price movement (that’s why impulsive motive waves travel quite neatly within parallel channel lines most of the time, even if one of the waves is extended).
Consider the following as an example for ‘balance through equality AND alternation’ . Wave 1 and 5 of an impulse sequence are equal in size and duration (equality), while wave 3 is extended (alternation to waves 1 and 5).
Alarm bells should be going off when a potential wave 4 is starting to grow out of proportion in terms of size and duration relative to the other waves of the same degree.
It is dangerous to disregard the factor of balanced proportions during wave counting. Disproportionate and misshapen patterns should be seriously questioned.
The ‘right look’ may not be evident at all degrees of trend simultaneously, so it is best to focus on the degrees that are the clearest.

Elliott Wave View: Further Downside in NetflixShort term Elliott Wave view suggests the rally to $299.5 in Netflix ($NFLX) ended wave 2. From there, the stock resumed lower and ended wave 3 at $252.03. Internal of wave 3 unfolded as a 5 waves impulse Elliott Wave structure. Down from $299.5, wave ((i)) ended at $287.45 and wave ((ii)) bounce ended at $293.81. The stock extends lower and ended wave ((iii)) at $261.89, wave ((iv)) bounce ended at $266.60, and wave ((v)) of 3 ended at $252.03.
Wave 4 bounce i still in progress. Near term, while bounce stays below 299.54 expect Netflix to extend lower. We don’t like buying the stock.

Bitcoin Correction Ahead Before Big Bullish WaveBitcoin have formed 5 waves up which signal that we have started a new direction in trend which is a bullish one. However I do expect a big correction to the downside to form a wave 2 before the big bullish wave continue. We are approaching a very strong supply/resistance area on the chart between $11,500-$13,500. Once the bearish correction start I can see it going all the way down to $5.800-$8,500 to complete a wave 2. After the completion of wave 2 I will look for Bitcoin to head higher to create new highs above $20,000

Elliott Wave View: Chesapeake Energy should See More DownsideElliott Wave view on Chesapeake Energy Corp (ticker symbol: CHK) suggests the rally to 2.17 ended wave (B). This suggests the stock has turned lower in wave (C) and can break below August 7 low (1.26). The stock however needs to break below 1.26 to confirm the bearish view and avoid a double correction in wave (B).
Down from September 16, 2019 high (2.17), wave ((i)) ended at 1.92 and wave ((ii)) ended at 2.15. The stock then extends lower with separation in wave ((iii)) towards 1.58 and wave ((iv)) bounce ended at 1.68. Internal of wave ((iii)) subdivided into another impulse in lesser degree.
Wave ((v)) is currently in progress and expected to complete soon. The 5 waves impulsive move lower should complete wave 1 in higher degree. The stock should then bounce in wave 2 to correct cycle from Sept 16 high (2.17) before the decline resumes. Bounce should find sellers in the sequence of 3, 7, or 11 swing for further downside as far as pivot at 2.17 high stays intact.

Elliott Wave View: Oil Outlook After Refinery AttackOil gapped up almost 20% early this week after the news that Saudi Arabia’s oil refineries got attacked by drones. It has since retraced after Saudi Arabia said they can restore most of the lost output within days. In the chart below, we label the rally to 63.39 as ending wave C of (X). It’s therefore part of an expanded Flat structure which started from June 5 low. The internal of wave C unfolded as a 5 waves impulse as an Expanded Flat is a 3-3-5 structure.
Wave ((i)) of C ended at 58.76 as a diagonal, and pullback to 54 ended wave ((ii)) of C. It then gapped up higher to 63.34 and ended wave ((iii)) of C after the news. Wave ((iv)) of C pullback ended at 58.77 and wave ((v)) of C ended at 63.38. This rally also completed wave (X) in larger degree. Oil is now currently bouncing in wave ((ii)) to correct the decline from 63.43. Afterwards, as far as pivot at 63.43 high stays intact, it should extend lower at least 1 more leg lower.

ETH could possibly retrace back to 228$ before the big fallCan you smell the blood in the air? I sure can, but that is not enough yet. What we are about to see in the following months is fear and greed gripping the minds of everyone in this crypto world, everyone that has remained oblivious to the true nature of this market that is. ETH could possibly retrace back to 228$ before the big fall. The count gives a technical opportunity that is usually realized by manipulation, but nonetheless the count usually comes true.

Retracement To Form Wave 4Good Day!!! Can the Wave 4 Count Be Forming??? Since Price has tested the weekly support level.

S&P500: the market took the alternate route.Last week I presented two options " The first is that the S&P500 has completed classic symmetrical triangle. It is a continuation pattern, meaning that the move going into the triangle will continue. In this case it was the move from 3029 DOWN to 2822 that was the initiation move. Assuming SPX2939 was the top of the b-wave, then simple symmetry targets: 2939 - (3029-2822) = 2732. Applying triangle "rules", then depending on where exactly price will move below the lower trendline of the triangle -say at 2829- then we're looking for 2622. So we have a SPX2732-2622 target zone, which we can refine once more price data becomes available.
The other options the market still has at this moment is to complete a diagonal pattern (labeled as "alt: 3", alt: 4"). A simple 5=1 then targets SPX2957. This would best count as what is called an ending diagonal in Elliott wave terms as the sub-waves count best as 3s and not 5s. A break and close below SPX2890 will take IMHO this option off the table. Note how price so far pretty much bottomed right there today... keeping us guessing a bit longer... ;-) "
While the 1st option looked best, also because the QQQ's had a nice triangle pattern forming (see here ) up to last Wednesday, on Thursday the markets threw the proverbial curve-ball as it often does and thus kept us guessing longer and yet again. The price pattern in the current rally still looks and counts best as that of a diagonal, albeit it has already (far) exceeded the ideal price target of SPX2957 I was looking for in that case. BUT, with today's price action we're right back at it as price reached the 78.60% retrace of the prior decline in early August ;-)
So what does all this mean? 1) the recent price action continues to morph into other options as the market provides us with its twists and turns. This constant morphing and adjustment of Elliott wave counts keeps me cautiously bullish as price is moving higher, but normally Bull runs are more straight forward and require less re-adjustments as impulse move much more predicable than corrective structures. 2) There's a considerable amount of upside gaps left below current prices, which may need to get filled first. 3) price is currently sitting right at support, which must be respected until broken. 4) not shown here, but the 50d SMA is currently sitting at SPX2948 and price will have to close below it to change trends from up to down.
So as the markets continue to pull all sorts of confusing stunts I am therefore still viewing this as part of a very complex b-wave. Currently, I have no clear immediate downside set up in place, and with price above its rising 20d, 50d and 200d SMA I am therefore cautiously Bullish. IF you wonder if the rally to SPX2800-4200 has started, I must admit I have no high probability count for that yet. Until then, being cautious is probably the best approach for now. Watch the 50d SMA for further clues.

US 30 in Breakout forming Cup & Handle: Possible new ATH soon!Inverted H&S clearly evident, now has broken above TL from consolidation zone; forming the Cup & Handle. EW (not shown, very unreliable to graph out of consolidation) suggests we may be completing Minor Wave 3, so expect some pullback before another burst higher. An extended Fifth Minor Wave could break 27400 for a new ATH.
Trades very near the 0.786 Fibo now up at 26940, might tag it intraday on Monday. We had an indecisive Harami Cross on Friday, so Monday's candle will be a signal; watch how it closes for indication.
Expect another week of consolidation in the higher price zone as the Handle forms. As we approach the FOMC on 17/18 Sep, and China talks in October, expect ferocious rally fueled by little more than greed and hope. SPX will likely retest the 3K zone and we could well see a new ATH this month. GANN: "Most new ATH occur in September."
Probably not a good place to be short IMO. Still too risky to sell puts, as a fourth wave could be quite sharp, retest the TL and consolidation zone, and bring much pain.
As Bearish as October was last year, it could turn out to be quite Bullish this year, as Trump manipulates global politics to prop markets up for re-election bid.
Any concessions, and even a tepid Deal with China would be perceived as a win for the Administration, in whose best interest resolution before 2020 is paramount.
Going Long on any pullback here; now holding both Bull and Bear spreads on QQQ and SPY, small Bear spreads on DIA, IWM, to close on a retest of support and roll into longs.
IMO am taking a real chance on shorting into the expected Handle, as it might not appear yet this week, so keep positions modest, eh?! Hold those long Bull spreads just in case. In event of a sharp pullback, can roll Bull debit spreads into credit spreads, cover the short OTM calls for net gain and sell calendar spread dailies for credit against the long monthly call positions to offset unrealized losses.
So many ways to play this! The Trend is your Friend, until the End of the Bend. GLTA!
This ain't advice, please don't invest based on this addle-pated crackpot notion!
PS As a sidenote, Moon is Waxing Gibbous at 74%; Full Moon on Saturday 14 September might mark Handle formation. Likely Bullish on Friday the 13th! LOL @astrology...

Elliott Wave View: IYR New All-Time-High in SightIYR is the ticker symbol for U.S. Real Estate ETF. Since the financial crash in 2009, the instrument is steadily rising and currently only $1 from breaking the 2007 all-time high. In the short term chart below, we can see the rally is unfolding as an 5 waves impulsive Elliott Wave structure. The impulsive rally started from August 5, 2019 low where wave ((i)) ended at 92.66 and wave ((ii)) ended at 90.75. Wave ((iii)) is in progress and unfolding as another impulse Elliott Wave structure in lesser degree.
A 100% Fibonacci extension measurement from August 5 gives us a possible short term target of 96.45 – 97.8. This can be a possible short term target to the upside. Near term, while pullback stays above 90.76, expect the instrument to extend higher. We do not like selling the instrument. Dips should find buyers in 3, 7, or 11 swing as far as pivot at 90.76 low stays intact. In the larger degree, if IYR makes all-time high by breaking above 2007 high (95), that should create a bullish sequence and open further upside in the larger degree.

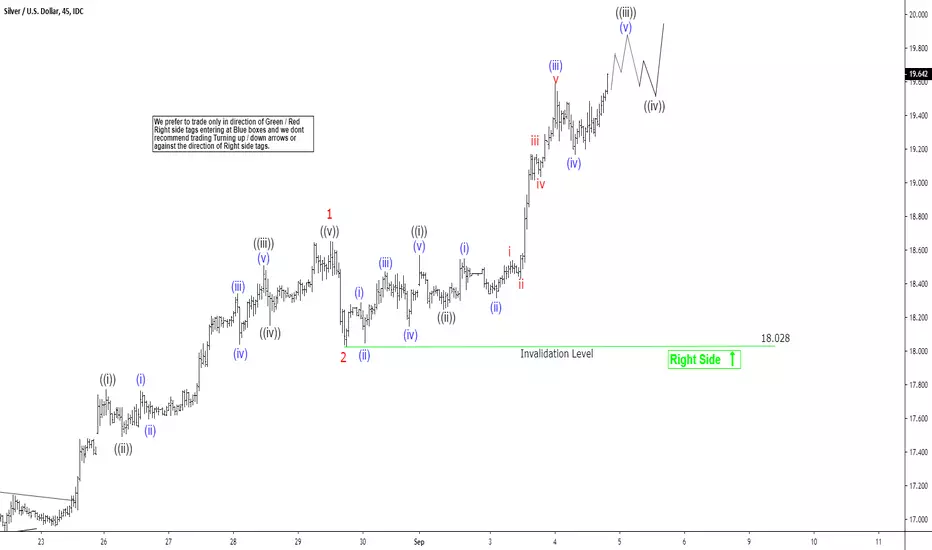
Elliott Wave View: How High Can Silver Go?Since forming the low on November 2018 at $13.9, Silver has rallied 40% to current price of $19.4. The move higher from $13.9 low took the form of a 5 waves impulsive Elliott Wave structure. On the 1 hour chart below, we can see wave (4) pullback ended at $16.92. The metal has since resumed higher in wave (5) with subdivision as another impulse in lesser degree. Up from $16.92, wave 1 ended at $18.65 and wave 2 ended at $18.02.
Near term, while dips stay above $18.02, Silver should continue to see more upside. We don’t like selling Silver and expect buyers to appear to buy the dips in 3, 7, or 11 swing. This view is valid as far as pivot at $18.02 low stays intact in the first degree. Possible target to the upside is 2.618% Fibonacci extension from Nov 2018 low which comes at $20.2 – $20.3 area. This is likely going to end only wave ((3)) in higher degree from Nov 2018 low, so it won’t end the entire rally yet. After it reaches the target of $20.2 – $20.3, Silver has chance to do a larger pullback to around $18 – $19 in wave ((4)) before another leg higher to end 5 waves up from November 2018 low.
Elliott Wave View: EURJPY Remains Under PressureEURJPY shows an impulsive Elliott Wave structure from July 1, 2019 high (123.36). On the chart below, wave ((iii)) of that impulse ended at 116.5 and wave ((iv)) bounce ended at 118.2. The internal of wave (iv) unfolded as a zigzag structure. Wave (a) ended at 117.77, wave (b) ended at 117.18, and wave (c) of ((iv)) ended at 118.19. Pair has resumed lower in wave ((v)) with the internal unfolding as an impulse Elliott Wave structure of lesser degree.
Down from 118.2, wave i ended at 117.05, wave ii bounce ended at 117.94, wave iii ended at 116.35, and wave iv bounce ended at 116.7. Wave v of (i) ended at 115.86 low. Pair now should bounce in wave (ii) to correct cycle from August 26 high (118.2) before the decline resumes. We don’t like buying the proposed bounce and expect bounce to fail in 3, 7, or 11 swing as far as pivot at 118.2 high stays intact.
