NASDAQ Elliott Wave Analysis: Ready To Rally Higher?!Hello Traders,
Today we will have a look at NASDAQ in the 1-hour timeframe.
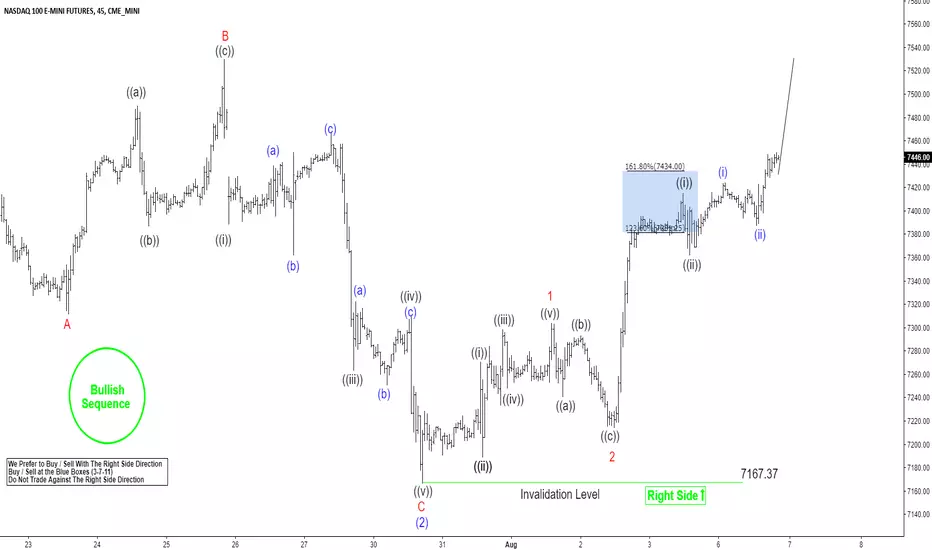
Short-term Elliott wave analysis suggests that the decline to $7167.37 low ended blue wave (2) pullback. The internals of that pullback unfolded as Elliott Wave Flat correction where red wave A ended at $7311.50 low. Above from there, the bounce to $7530 high ended red wave B bounce as Elliott wave Zigzag where black wave ((a)) ended at $7489.75 high, black wave ((b)) pullback ended at $7386.75 low and black wave ((c)) of red B ended at $7530 high.
Down from there, the index declined in 5 waves lower within red wave C. The first leg lower black wave ((i)) ended at $7388.5. Up from there, the bounce to $7467 high ended black wave ((ii)) and then the decline to $7263.50 low ended black wave ((iii)). black wave ((iv)) bounce ended at $7309.25 and the last leg black wave ((v)) of red C ended at $7167.37 low. This last leg also completed blue wave (2) pullback.
Near-term, while dips remain above $7167.37 low, we expect the Index to resume the next leg higher. A break above $7530 (irregular red wave B) however is needed for final confirmation to avoid a double correction lower. As long as the pivot at 7167.37 low in our distribution system stays intact, we expect it move higher. We don’t like selling the index.
Elliottwaveretracement
BTCUSD Wave 4 of 5As per Elliott Wave theory, wave 4 should not retrace lower than wave 1. Also, we are at 61.8 level, so if the bulls are to take charge, this would be the moment.
If you want to get it, wait for some green volume candles to come in and market structure. Risk to new lows.

Dow Retrace: How deep - how low will it go?Many ideas posted about bullish up wave in the flag, but to get to that we need to have a down wave first.
Only q? How low will it go? Three possibles depicted here in chart - Fibo .382, .50, .618 retracements.
I'm confident we will get back to at least 250 support (former resistance) for a .382 pullback in an Elliott A wave.
If investor confidence fails and we get panic-style selling the drop will be sharper. I expect likely to get to at least 0.50 around 24852; S&P would settle ~2740 then.
Frantic selling will produce the 0.618 Fibo at 24680 and a real panic will take us back to 24400 (not charted).
Notice that the deeper the pullback, the stronger and higher the resulting bullish impulse (B waves - looks like a pitchfork) after the selloff.
Fascinating - I wish I knew what the dam thing will do but I went short Friday and looks good today - good luck peeps!


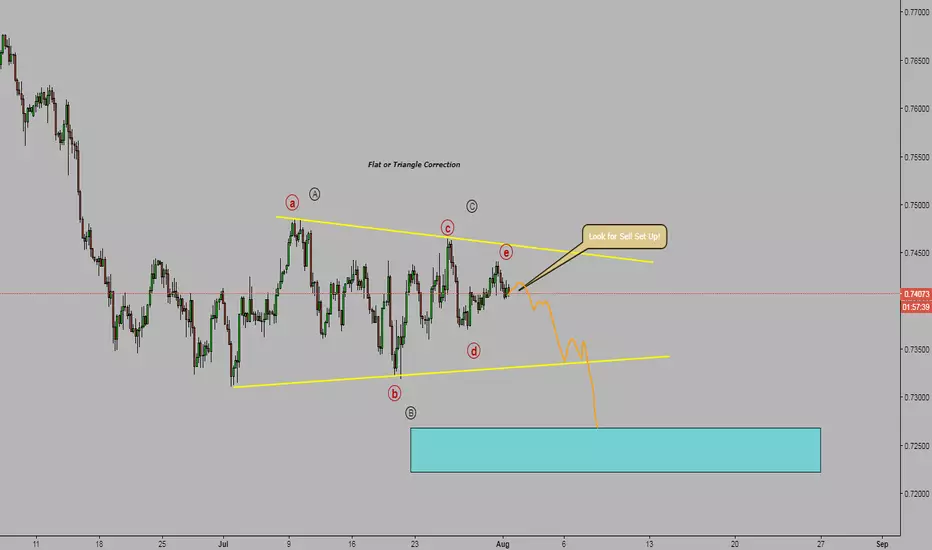
AUD/USD Sell Set Up Corrective Structure Triangle or FlatLook for price to make an impulsive move to the downside then a correction to get short. I believe price is near the end of forming a correction structure that has taken the shape of a Triangle of Flat, Both will point price to move lower
USD/CHF Wave Analysis Buy Set UpWatch for USD/CHF to finish the corrective structure which I believe is a running flat. Look for an impulse then a correction to get long and ride the wave up

EUR/USD Wave Analysis Sell Set UpEUR/USD have been forming a corrective structure. We could be near the end of the scorrection which I believe is a Triangle. Watch for an impulse to the downside then a correction to get short.

Nifty Elliott Wave Analysis: Rallying Higher as ImpulseHello Traders,
In this analysis, we will have a look at the Nifty index from India in the 4-hour timeframe.
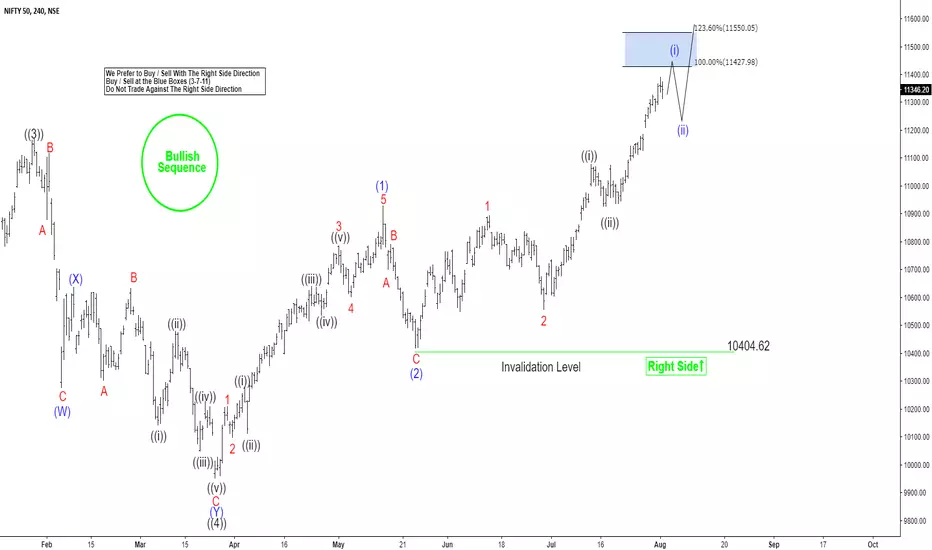
Nifty Elliott wave analysis suggests that the rally to 11171.55 high ended black wave ((3)). Down from there, the decline to 9951.9 low ended black wave ((4)) pullback. The internals of that pullback unfolded as Elliott wave double three structure with sub-division of 3-3-3 corrective swings in each leg. Down from 11171.55 high, the initial decline to 10276.3 low ended blue wave (W) as a Flat. Then the bounce to 10637.8 high ended blue wave (X) bounce. And the decline to 9951.9 low ended blue wave (Y) of black wave ((4)) as Elliott Wave Flat.
Up from 9951.9 low, black wave ((5)) remains in progress as impulse where blue wave (1), (3) & (5) are expected to unfold in 5 waves advance within lesser degree cycles. Whereas blue wave (2) & (4) are expected to unfold in 3 waves corrective sequence in lesser degree cycles. Above from 9951.9 low, the rally higher to 10929.2 high ended blue wave (1) in 5 waves structure. Down from there, the pullback to 10404.62 low ended blue wave (2) in 3 swings.
Above from there, the index is nesting in blue wave (3) higher. Where red wave 1 ended at 10893.25. And the red wave 2 ended at 10557.7 low. Near-term focus remains towards 11458.50-11584.44 100%-123.6% Fibonacci extension area of black wave ((i))-((ii)) to end the lesser degree blue wave (i). Later on, the index is expected to do a pullback in blue wave (ii) in 3, 7 or 11 swings before further upside is seen. We don’t like selling the index and prefer more upside as far as the pivot at 10404.62 low in our distribution system stays intact.
ABC Correction Wave by the book!If my wave counts are correct, we are finishing up subwave 3 of the a-correction wave. I've adjusted the target of "a" down further since this wave 3 extended further than I predicted. But either way, this is a good looking correction wave. We should bounce back up to the resistance rectangle 78XX for subwave 4 before hitting the 7250 target of wave "a". Than the "b" wave with 3 subwaves will take us back up to this resistance at 78xx before the final "c" correction wave (made up of 5 subwaves that could take us down to he 6900-7000 target.
This wave structure is setting up almost perfectly according to theory, with the exception of the steep squeezes and quick corrections that we see. But that is part of the volatility of the crypto market. Despite the appearance of whale manipulation and other unregulated variances, the wave theory continues to provide good insight into the market behavior and predicts trend changes just like traditional markets. Happy Trading!
Have a Great Day!

NQ! - Will Apple Save NQ?Apple beat their ER expectation - of course, they're a beast. is it enough to save the market? That's the real question.
I haven't touched elliott wave count in awhile so I thought I give it a shot.
According to the wave count. I see a drop coming in the next week or so. Maybe August will be a weak month after all, now that we're done with all of the FAANG ER's
Lets see if this play out as predicted. Best of luck!

Wave 4 correction is done (A Flat) now up for Wave 5Wave 4 correction is over, it was a Flat 3,3,5. Now we head up for the 5th wave, Target 1 9300 - 9400.

Short and Long We have a pattern of 5 complete waves, which in turn form wave 1 of greater degree, now we are in correction a-b,
once the c wave is finished, ideally in 78.6 a perfect Cypher pattern will be formed that will give us a more confirmed entry for wave 2 of greater degree..
also we have 2 magnets in 78.6 level that must be closed

Recap- for this weeks currency pairs and spyShowing how this weeks currency pairs are playing out for the weeks end.

Correction almost doneSome people didn't think a correction was possible. But here we are, couple of days later, and bitcoin made a much needed and healthy correction so far.
It seems we are currently working on the 5 of the C wave which could end around the 61.8% fib levels. That would be nicely above wave 1 , so valid according to Elliott rules
I will be looking to long when 4 is in and 5 seems to be starting

Correction almost done ?Some people didnt believe a correction was going to happen.
Well here we are, a couple of days later and BTC sure did a nice and healthy correction.
And...It looks like the correction almost done ?
From what i see we're putting in the 4 of the 5 of the C wave.
Logical target for 4 seems to be around the 0.618 fib level which is still above the wave 1 high, so not breaking any Elliott Wave rules.
I Will go long when 4 is done and 5 is starting

Elliott Wave Analysis: DAX Ready For Rally Higher?Hello Traders,
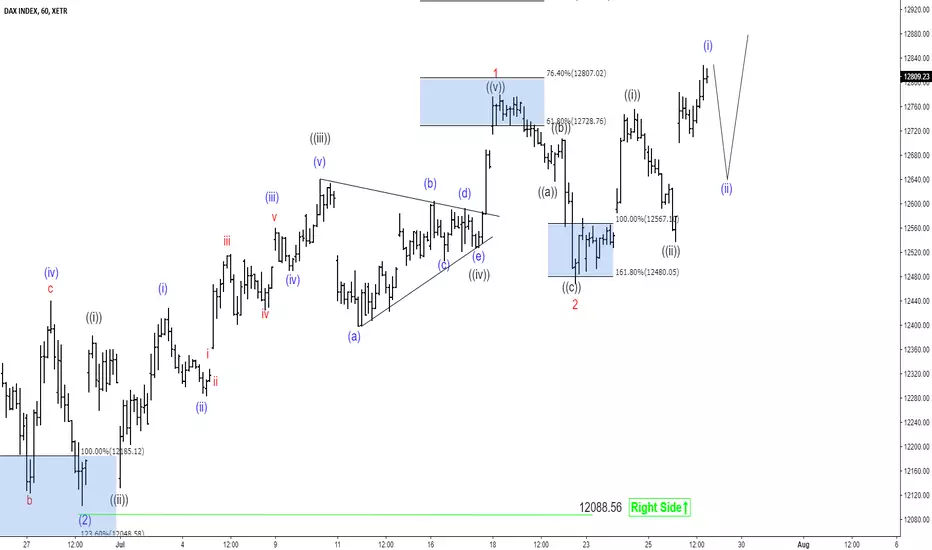
DAX short-term Elliott wave analysis suggests that the pullback to 6.28.2018 low ended blue wave (2) at 12088.56. Up from there, the rally higher to 12769.8 higher ended red wave 1. The internals of that rally higher took place as impulse structure with internal sub-division of 5 wave structure in black wave ((i)), ((iii)) & ((v)). On the other hand, wave ((ii)) & ((iv)) took place in 3 waves corrective structure.
Above from 6.28.2018 low cycle, the rally higher to 12369.5 high ended black wave ((i)). Down from there, the pullback to 12115 low ended black wave ((ii)). The rally higher from there took place in 5 waves structure & ended the black wave ((iii)) at 12630 high. Below from there, the pullback to 12513.5 ended black wave ((iv)) as a contracting triangle. The final rally higher from there ended black wave ((v)) of red wave 1 at 12769.5 peak. Down from there, the correction against 6.28.2018 low cycle completed red wave 2 at 12454.5 low after reaching the blue box area at 12540.50-12446.86 100%-161.8% Fibonacci extension area. Near-term, while dips remain above 12454.5 low and more importantly above 12088.56 low, expect the Index to resume the upside in red wave 3 higher. We don’t like selling it.
GBP/USD Elliot Wave Analysis Buy Set upWatch for price to finish a small correction then look to hop in for the Buy set up

Elliott Wave Analysis: Amazon May Start Another Extension HigherHello Traders,
Let's have a look at the Amazon 1 hour chart.
Short-term Elliott wave analysis suggests that pullback to $1646.48 low ended blue wave (2). Above from there, the stock is rallying higher in blue wave (3). The internals of that extension higher is unfolding as Elliott wave impulse structure with sub-division of 5 waves.
Above from $1646.48 low, the rally to $1858.88 high ended red wave 1. The internals of that rally higher took place in another 5 waves impulse sequence in lesser degree cycles. The first leg of a rally to $1725 high ended black wave ((i)) as Leading diagonal structure. Then the pullback to $1682.15 low ended black wave ((ii)) pullback as a Zigzag correction. Up from there, the rally higher to $1841.95 ended black wave ((iii)) in 5 waves. black wave ((iv)) pullback ended at $1791 low, and black wave ((v)) of red wave 1 ended at $1858.88 high.
Below from there, the stock did a 3 wave pullback in red wave 2, which is proposed to have completed the correction against $1646.48 cycle low. After reaching the blue box 100%-123.6% Fibonacci extension area at $1787.19-$1775.77. However, a break above $1858.88 high remains to be seen to validate this view & until then, a double correction lower in red wave 2 can’t be completely ruled out. Near-term, while dips remain above $1769.99 low and more importantly above $1646.48 low the stock is expected to resume the upside. We don’t like selling it and the right side remains to the upside.

what goes up.. must go downBTC is (almost) done with its 5 wave impulse up. Time for a correction. We can already spot bearish divergence on the daily RSI, so perhaps there's a small push up left but then its time to correct. If this plays as a 1-2 of a higher degree Elliott wave the most probably place for the 2 to end would be between to 50%-61.8% fib levels

OIL Elliott Wave Analysis: Larger Correction Taking PlaceHello Traders,
In this Elliott Wave Analysis, we will have a look at Oil.
OIL short-term Elliott wave analysis suggests that the rally to $75.31 high ended in red wave III. Down from there, the larger correction in red wave IV is taking place in 3, 7 or 11 swings before Oil resumes higher. The internal of the first leg of the decline from $75.28 high took place in 5 wave’s impulse with internal distribution of 5 wave’s structure in lesser degree cycle. This suggests that the five waves down from $75.31 is part of a larger Elliott wave Zigzag correction within cycle degree wave IV pullback.
Down from $75.31 high, the decline to $72.14 low ended blue wave (1) as a leading diagonal structure. Above from there, the bounce to 74.70 high ended blue wave (2) bounce as a Zigzag correction. Below from there, the decline to $69.23 low ended blue wave (3) in another 5 waves. Then the bounce to $71.66 high ended blue wave (4) bounce in 3 swings. The final decline from there unfolded in 5 wave’s structure which ended blue wave (5) at $67.04 low & also completed the black wave ((A)).
Up from there, the instrument ended black wave ((B)) pullback at $71.11 and should continue the decline. As long as the market stays below $71.11 peak but more importantly below $75.31 peak, we expect Oil to continue lower. We don’t like selling it.

GBPNZD big move with patternCup and Handle pattern taking shape and almost complete. All that is left for completion is a break out of neckline. This big move will reap hundreds of pips and you herd it here!

Finishing the 3rd wave on BTCHi Guys!
Today, as usual, we are looking at the BTC/USD and to be on honnest it looks pretty good! During the third wave, we found a top at the trend line that was the support previously, and now I think we are retracing to the support, which is 7k, and we didn't test it yet, so let's see if it'll do it's work.
I am trying a little sell here, but my SL is not far on that, it is a little big higher than the trend line (7600).
Hope this analysis helped you, leave a like if yes, and don't hesitate to shares your ideas in the comments!
Stay tuned Traders.

Finishing the 3rd Impulse Wave, now need a retraceWell that 3rd wave went up a bit higher and a lot faster than I expected. The bulls broke hard through the long term downtrend pink line. Now they need some good consolidation and retrace on the 4th wave to garner more support to get ready for the 5th wave.
Ideally, the 4th wave retrace will drop back to the 6800-6900 level which should prove to be a good level of support now. Then the 5th wave will be free to move up to the 7800 level by Mid August.
You can see I've then forecasted the abc correction wave back to the 6400-6600 level. This would be a really healthy sign representing a .618 fib level retracement by early September. Then we could begin another bull impulse wave through the previous resistance level of 7800 and go all the way up to 9200 level by October.
Any other bullish EW folks have the same ideas?
Have a great day!
