"If" we are to break support. (BTCUSD - Bitfinex - TR:Week)This is a happy prediction for seeing the bottom.
If price drops lower than this, then ( my opinion is that investors are indicating ) "digital gold" isn't good enough and the market wants something more versatile.
In other words, there will be a change in the crypto reign.
Elliottwaveretracement

Bitcoin #BTCUSD - the last chance for bulls?The previous impulsive scenario has been invalidated due to the wave (2) and wave (1) overlap. The current scenario is still bullish, but this look like a last chance for bulls to do their thing, otherwise the bears will push the market below $5,820 support in a no time.

USDCAD - Wave 3 starts with uptrendHi followers,
the USDCAD is now going down.
The perfect retrace says us, yes this is the right time. The divergence and also the down impulse maintain this!

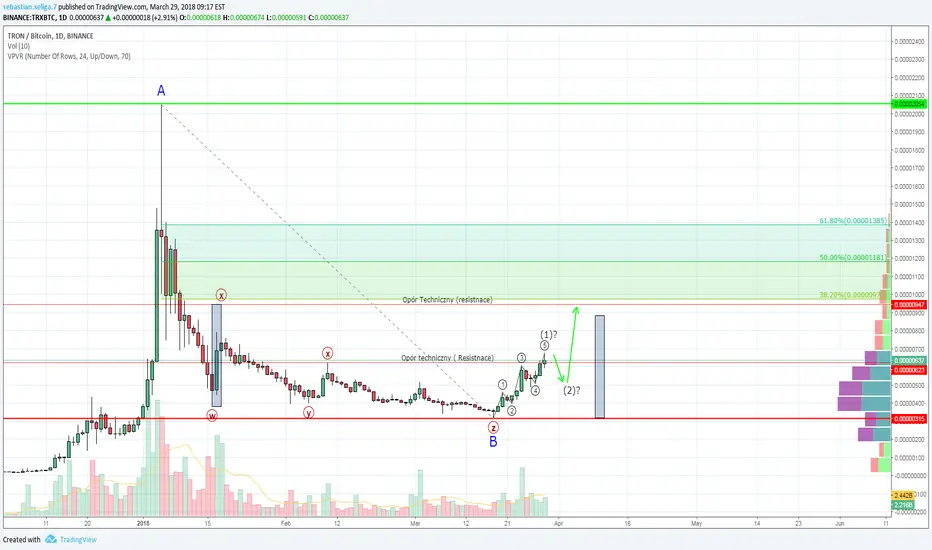
TRON #TRXBTC - impulsive breakout higher, where is the target?After a very long waiting time to complete the correction in the B wave, the cryptocurrency TRON has finally beat the top, testing the first level of technical resistance at 700. Five growth waves are almost completed, so it's time for a downward correction in which the area between levels 400 -500 will be a good zone for entering long positions.
The first goal for wave (3) is the level of technical resistance at 947 or 38% Fibo at 977.
It remains to keep your fingers crossed!
PS: Follow me to be sure You will not miss any update!
PPS: Next analysis will be publish after this post will get min 50 likes! :)
Lisk #LSKUSD - in interesting demand zone, will it rally?Since the misfire with the conference of cryptocurrencies LISK, where the main event was to show a new logo, the price is slowly but surely overcoming successive levels of support.
The last important level was $ 12.00, which was also stamped. Currently, the price is closer to the level of $ 10.00, which falls already in the demand zone. This zone extends between levels $ 6.50 - $ 10.00 and previously behaved like market support.
From the point of view of the Elliott wave theory, the current declines may be coming to an end, because the downward (W) (X) (Y) (X) (Z) folded over time and in the large wave cycle (A) may be at the end . Until the end of this cycle, the wave of a smaller cycle, ie the wave C from the wave (Z) would have been missing.
Potential increases, however, do not seem to be impulsive, because the upward wave will be the wave (B) of the downward cycle. Setting the target level at $ 21.75 is quite optimistic in itself.
Please note that after the end of the wave (B), unfortunately, but it will be time for more drops in the wave (C).

Elliott wave analysis of EUMaybe 5-5 disappear cuz of the gann number of dxy is 88 who knows?
If Weekly price above 1.248 SL and long it again tp 1.274 and short it again
Every thing in the pic
It's 8 years cycle DXY is gone

Bitcoin #BTCUSD - growth still possible, key levels aheadThere is still a chance for another upward wave as long as the level of $7,700 is not clearly violated, because the ABC zig-zag correction looks now completed. The key level for the upside is still seen at $8,271, so a bullish breakout above this level is required to confirm the bottom is in place. Breakout above this level will open the road towards the next technical resistance at the level of $9,187.
On the other hand, a failure to rally here will likely lead to more decreases towards the technical support at the level of $7,230. Any breakout below this level will invalidate the impulsive scenario.

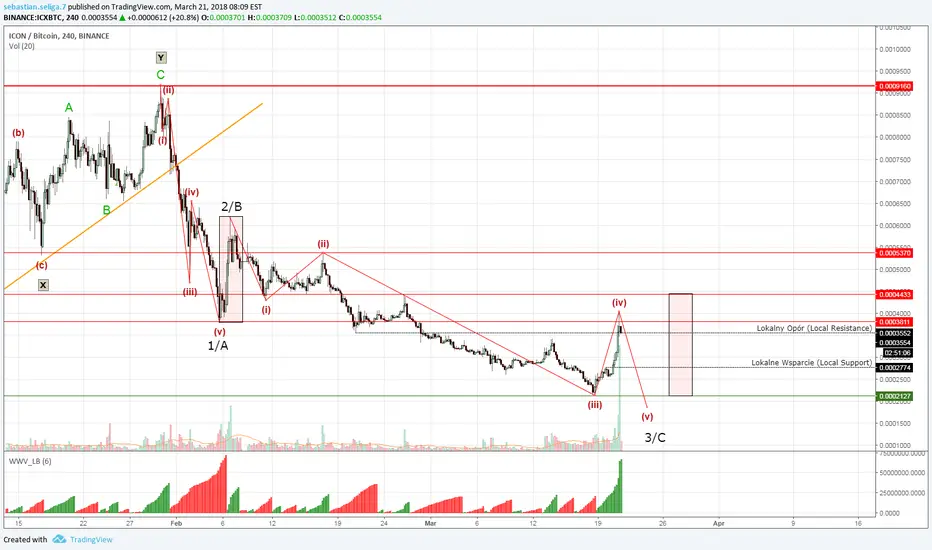
ICON #ICX - there is something missing here...According to the newest Elliott Wave Analysis of this relatively interesting cryptocurrency is now rallying higher on a high volume, but there is still missing the fifth wave to the downside. When the last wave down is made, then there will be a potential for another leg up, but fore now cautious is advised on the way up.
CADJPY - Elliott Wave counting - Forecast for a correction wave Hi followers,
look on the daily chart to find my counting for CADJPY.
I believe there will be in next time a correction wave.

USDJPY H4 CATCHING CORRECTIVE WAVEOn H4 I see USDJPY completed wave 5, good chance to long USDJPY at least retrace to 0.328 fibo
Entry 105.400 - 105.500
Risk 50 pips
Reward
TP1 100 pips
TP2 200 pips
TP3 300 pips
Good luck

BTC Update 25 MAR. HUGE critical area.Imminent approach to $8400-$8470 is coming for bitcoin.
After that, it will enter a critical area of huge proportions.
Basically it can go anywhere from there. Personally, I WILL stay as far away from that area as I can.
There are three major scenarios at play here:
S1) GREEN ELLIOT WAVE
It will reach 8470$ and bounce back up 'thus confirming the GREEN EllliotWave
Must barely touch critical area no. 2)
S1.1) OR it HITS $8600 area and bounces dwon again,'thus forming scenario S3)
S2) YELLOW ELLIOT WAVE
HUGE Second EW to be made. Can start anywhere in critical area no. 2.
S3) RED ELLIOT WAVE
This might just be another ABCDE correction, which is forming a descending triangle.
Higher bounceback area might produce a ascending triangle, but it would be too messy to chart.
Also might start in critical area no. 2)
S4) ALL ELliot WAVES FAIL. (highly unlikely scenario).
And we are returning to $7300
S5) Not everything fails and yellow EW bounces back at $7800 to make a nice 3rd WAVE.
(but I doubt this one as much at S4 )
Critical Area No. 1 is where the fun starts. Either will stay in triangle trend, or it will break to form Elliot Wave.
Make sure to follow me here, for more updates on this chart.

SPY to target 234-242 in the weeks aheadSPY has completed a nine year bull run that peaked at the end of January. This run on the log scale has been a beautiful 5 waves, with wave 3 a near perfect 1:1.618 extension of wave 1, and wave 5 a near perfect 1:1 extension of wave 3. As such, I now anticipate we see a significant retracement in the months/years ahead.
I hope to publish my SPY targets as this journey unfolds.
My first target suggesting the bull run is likely over has already been met (published here recently).
The next target is as elucidated above: SPY in the next few weeks will head for a touch of the 9 year log trend line. This trend line touch will depend on the speed at which the upcoming fall unfolds, but I'm expecting the touch will be in the 234-242 range.
To get there I first anticipate SPY gets a positive bounce off 257 (likely Monday, 3/26). I see two possible scenarios for this to play out.
Scenario 1 (pink arrows) takes SPY in a B wave to 266 for a 38.2% retracement of wave A down. Following this move up, SPY will start to head down toward 242 as wave C. 242 would be a nice 1:1 extension of wave A of this complex off a B wave move up to 266. I would be more likely to expect this if we get a slow steady bounce off 257 as SPY heads to 266.
Scenario 2 (green arrows) could unfold if SPY gets a sharp move up off 257 all the way to 272. If this happens, I will be looking for a sharp move down all the way to the lower end of our target range over a shorter period of time. This could yield wave C as a 1.618 extension of wave A with a target of 234 for SPY.
I'd appreciate your thoughts (and support)! Of course, this may not pan out (and almost certainly not exactly as outlined), and I therefore I will adjust my projections as this continues to unfold.

BNB/USDT Update 22 Mar 18BNB seems to be making an (open ? - I really can't grip the word right now) triangle formation WHILE also trying to break the 11$ .
Well, that's at least what it was trying to do before the Bitcoin Shakeuk which happned while I was writing this. So I guess it will stay in this triangle for a bit more.
Showing Strong Support on 10 USDT and 10.3 USDT. If those break, STRONG SUPPORT on 9.6 $ (Thanks Bitcoin...)
There are two critical areas in my opinion. If it managed to breach one of them, the open triangle trend might change and Elliot abcde might fail.
I can't really do better than this right now - I'm on a 14'' screen for a long time.
This is what I'm seeing at the time of writing this. Things probably will change if BTC makes another dive - adapt your trades accordingly.

ETCBTC - Deep 4th wave Fib Retracement & 6.6 R:R for 5thETCBTC pair on 30-minute chart
Using Fib Retracement on the 3rd wave, the 0.618-0.65 pocket for the 4th is likely to be around 210,000 satoshi (0.00210000). This would be a good buy position for the fifth at 255,000 satoshi (0.00255000) with a stop limit just below the 0.786 which is not far from the 0.65. The Risk to Reward here is 6.6
I think this is worth a try.
Note :
This is not an recommendation, just an observation and experiment with wave analysis projections.

XRPUSD (RIPPLE) poised for a bull move? 4hr tf analysisRipple's (XRPUSD) sell off terminated at ~$0.53 which is within the Weekly and Daily support area that I mentioned in this post:
Price close at ~$0.53 has been determined to be a possible termination point of a minor wave C. Target area for the current upswing is shown here as between $0.77 and $0.82. Failure to move above this resistance could see price return to the support area between $0.57 and $0.41. If price closes and holds above $0.82 (upper range of the target area), XRPUSD could possibly reach ~$1.20

Ethereum Classic (ETCUSD) not in the clear yet: 4hr tf analysisEthereum Classic (ETCUSD) sell off from ~$42.14 on Feb. 20, 2018 to March 18, 2018 (~$14.51) has been identified as a minor wave degree that is not yet complete with Ethereum classic currently in a minor wave 4 position. The possible termination point of minor wave 4 is the vicinity of the fourth wave of the previous degree i.e. minute wave ((iv)) of minor wave 3.
This region coincides with a 38.2% retracement of minor wave 3. The target area for minor wave 4 as shown on the chart between 38.2% and 50% retracement of minor 3 i.e. between $23.57 and $26.37.
Price of ETCUSD holding at the mentioned target area should result in another sell off that should see Ethereum classic at least close at or below $14.51. The arrows as used on the chart are used to indicate the trajectory for the price of ETCUSD.
POI= Point of invalidation for this analysis is placed at $30.14 at which point minor wave 4 would have overlapped more than 61.8% of minor w3.

Top of Wave 1 to 2, including targets for wave 2 and 3Well first two targets got hit pretty well. RSI, Vol, MACD and EMA 55 show us, that we hit the Top of wave 1 and are on a way down to 2.
Target of the wave could be between 0.382 and 0.5 Fib Ret.
I got my buy-orders stacked between 8000 and 8100. Target see on Chart.
Bulls and bears are still fighting on the way down, we might retarced higher and wave 2 might be shorter, anyway I shorted and wait for new signals.
As always: This is a hobby for me. I improve fast, keep on learning and reading. Feedback and ideas are always welcome!
I am not a financial adviser, please do your own research and let me know if we agree on targets and so on. I need people who correct me, tell me why and what if I analysed something wrong.
Thank you! :)

LiteCoin wants to tests $171 region soon.Hello all my friends, LiteCoin looks like it will test the $171 region soon. Set very stop tights in case it's a bull trap.
Take Profits 1 - $161
Take Profits 2 - $169
Stop Loss - $153

Bitcoin #BTCUSD - we going down to $5,920?Both levels have already been compromised and the price droped towards local support at $ 7,233.
Despite the potential end of the C wave of the ABC irregular correction in the alt: 2 wave, there has not been seen any demand from the demand side yet.
Therefore, the price will most likely fall to the level of the previous $ 5,920 support, unless the bulls find enough strength to break out of the channel.

BTC Double Three for wave 4 of this diagonal?We appear to be moving in a double three for this 4th wave correction. Looks like it might continue up to ~8300 before turning back down.

Bitcoin #BTCUSD - it is now or never.The price of BTCUSD has hit the projected target zone and now the scenario is really simple: either we will impulsively rally towards the new highs or we are going down to $5,920.

Bitcoin (BTCUSD) bears ruleBitcoin, the world's number 1 cryptocurrency closed at ~$19,210 on Dec. 16, 2018 and has been in a downtrend ever since. Price close on Dec. 16,2018 has been identified as the termination point of Primary wave ((3)) and the current downtrend or correction is Primary wave ((4)). Based on guidelines, it is quite possible for Primary wave ((4)) of Bitcoin to terminate in the region of the 4th wave of the previous degree i.e. Primary wave ((3)), which this analysis identifies as the region of $4,367
The correction from $19,210 has been identified as a possible wedge (leading diagonal). If this holds true, then the entire correction can be anticipated to be an Elliot wave zigzag (5-3-5) structure. Currently, price action appears to be completing in a Minute ((1)) of Minor wave 5. Completion of Minor wave 5 should see Bitcoin close below at least $6,946.60 (price close on Feb. 5, 2018).
Any bullish momentum from a close of Minor wave 5 should see price possibly terminate in the region of Minor wave 4 which is approximately around $11,433.50.

#NEOBTC - close to the demand zone, upward rally possible?After the end of the C-wave rise cycle at the level of 0.015, the NEOBTC is in the upward trend corrective cycle, which has now taken the shape of a complex correction WXYXZ.
The price is approaching the 50% Fibo level of the previous swing up, which is right in the middle of the demand zone between 0.0076 - 0.0090.
If the correction cycle is over, then in this zone there should be at least a momentary reflection towards local resistance at 0.0094 and 0.01030.
It is possible that the reflection may be stronger and reach even 0.01111 or a little higher, straight into the pink zone of supply.
