Elliottwaveretracement

Lisk #LSKUSD - bad news, paradigm change!TECHNICAL ANALYSIS:
The impulsive wave scenario has been invalidated!
Currently, the best scenario available is not the impulsive formation, but the double zigzag (W) (X) (Y), which ended at $ 40.48.
The reason for changing Elliott waveforms from impulsive to corrective is too many canceled levels and too many overlapping levels. It is not the traditional behavior of the pulse wave, but more suits the formation of the Double ZygZak just. Not only that, this formation can still evolve into the Triple ZygZak, but for the time being there is no reason to do so.
The current inheritance formation WXY is the largest downward correction since the cryptocurrency has been recorded, which proves that the trend and form of the further wave scheme has probably changed.
Without going into details, in the short-term perspective the situation is as follows: there is still a chance for further increases (option of the Triple ZygZak), even with the option of new peaks, but they will not be long-lasting. The most similar to this model are currently the so-called: Pumps and Drops (PUMP and DUMP), which means that the market is no longer in an upward trend (and this option was assumed from the beginning of the impulsive scenario).
In the short-term, the most important levels are currently:
- support at 15.70
- internal trend line at 15.00
- Fibonacci cluster at 11.50.
- external extension of the Fibo level at 8.00.
The current WXY correction is close to the end of the decline at one of these levels.
PS: Please FOLLOW ME if you want to know about all new updates!

I believe there's still a lower low, but strange things happen..Counting the Elliott Waves as I am able to, I find it hard to avoid a lower drop, because this would mess up the complete correction...
I cannot believe there's no 5th subwave in the C wave... if someone can show me a better set-up, or where I made a mistake, any critic is welcome...
Because I have seen very smart and experienced Elliott Wave analysts who change their mind every time there's a trend reversal... ??

Ethereum #ETHUSD - up cycle completed, correction startedHello and welcome to my first video analysis for TradingView portal.
In this video I will analyse ETHUSD pair using Elliott Wave Principle.
Enjoy and please leave the feedback! :)

BitcoinCash #BCCUSDT - possible downward correction?The price of BCCUSDT had completed the impulsive wave at the level of $4,198 and now is developung a complex corrective wave 2. There is clearly missing wave C of this correctiion. If the level of 2059 will not hold, then the implsive cycle to the downside might bring another leg down to the level of $1,810 and below.

BTC/USD When will the bloodbath end? Here's two idea's.Not what most people want to see. (Note that I'm still learning how these things work). Yet the data all points in one direction.. down. At least for a little bit longer. Using Elliots wave theory we have definitely done the A,B portion of the ABC correction, the question is "how low do we go?" for the "C" portion?. I have two boxes marked out.
The first one is a good candidate with RSI level and MACD showing support of an upturn here shortly, but I have to note that strictly based off elliots wave theory we haven't dropped enough at those levels. Further note it is possible for us to see an extended 5 wave pattern in the "C" corrective wave which means we will drop further.
My second box drawn is a SUPER MAJOR support line AND elliots wave theory lines up. This is where I would feel most comfortable buying in. If we break this year long support... well then bad days are coming. (I do not foresee this happening yet I always consider every possibility)
Overall, short-term BTC -16.50% is going to keep dropping, long-term HODL that shit.

LISK #LSKUSD - about to break higher?TECHNICAL ANALYSIS:
The long shadow of the supply candle has set the demand zone (green) between levels $ 25.84 - $ 30.00 and only a serious violation of this zone can turn against bulls. The consequence of this market behavior would be a fall in the price towards the golden trend line around the level of $ 20.00.
For now, however, there are no grounds to believe that the low of $ 25.84 is the end of the wave (2). Therefore, the rate should still be set on increases towards the supply zone (pink) after the peak at $ 40.00.
TREND AND IMPORTANT LEVELS:
Main trend: UP
Intermediate trend: UP
Daily trend: UP / NEUTRAL (continuation of the correction)
Key levels:
- for further increases - the level of $ 33.70 and later $ 35.50
- for continuing correction - level of $ 33.70 (resistance) and $ 25.84 (support)
- for the continuation of falls - the level of $ 25.84 and later $ 20.00
PS: Be sure to add me to the watchers!
PPS: The next analysis of the next cryptocurrency will be published, if this post receives a min. 100 likes. :)

Nifty rejected ending diagonal resistance After struggling to break the ending diagonal to the upside it is in a crucial level to break the channel, if price breaks the channel then a drop to test 10,400-10,500 will be open before Nifty moves to the dead zone

Litecoin #LTCUSD - +130% possible after the breakoutThe price of LTCUSD is still trading inside of the corrective zone, between the levels of $230 - $304. In order to move higher in price, the market must break out above the level of $304 first, then test the level of $380 and attack the swing high at $420. The next nice take profit level for the up wave if at $600, which would gibe a +130% for someone who bought the LTCUSD in the correction zone.
Otherwise, the market will continue to move sideways.
Any violation of the level of $144.00 invalidates the bullish impulsive scenario.

Dash #DSHUSD - no so fast, Dashboy!The Dash cryptocurrency price is still in wave 4, which may turn out to be an irregular ABC correction. In this correction, wave B has already been made (with a high at $ 1.253) and now the price would be in the last phase of the downward cycle, the C wave. Confirmation of this scenario will come with the breaking of the trend line (golden bottom line) and a testing the levels $ 936 and later $ 856 and finally $ 775. This is why red arrows is the preffered scenario.
The lack of the above wave development will be synonymous with the further development of another wave of correction, i.e. the wave triangle 4.
Main trend: UP
Intermediate trend: UP
Daily trend: UP / NEUTRAL (continuation of the correction)
Key levels:
- for further increases - the level of $ 1.253 and later $ 1.338
- for continuation of the correction - level of $ 1,253 (resistance) and $ 936 (support)
- for the continuation of declines - the level of $ 936 and later $ 856 and $ 775
PS: Be sure to add me to the watchers!
PPS: The next analysis of the next cryptocurrency will be published, if this post receives a min. 100 likes. :)

IOTA - A promising Rebound!The IOTA cryptocurrency price managed to recover over half of the pre-holiday decline and is now just below the supply zone and below the local resistance at the level of $ 4.49. The golden trend line has just been tested and you can see small, but always, demand engagement at the levels of $ 3.20 - $ 3.30. For increases to be continued, the local support level of $ 2.72 should remain intact.
From the point of view of the Elliott wave theory, there are two wave scenarios available, both of which are pro-growth in the long term. Moreover, if the alternative scenario turns out to be a correct wave scenario, the potential for growth is much higher than in the case of the main scenario. The invalidation of the growth scenario will occur with the violation of the level of $ 1.10.
Main trend: UP
Intermediate trend: UP
Daily trend: UP / NEUTRALNY (continuation of the correction)
Key levels:
- for further increases - the level is $ 4.49 and later $ 5.80.
- for the continuation of the correction - the level of $ 2.72 and later $ 2.14
- for the continuation of decreases - the level of $ 1.10.
The next analysis of IOTA cryptocurrencies will be published if this post receives a min. 50 likes.
Good luck! :)

EOS #EOSBTC - more gains ahead!TECHNICAL ANALYSIS:
After finishing wave 1 and corrective wave 2, the price of the EOS cryptocurrency is still in the impulsive wave 3 growth cycle. The range of this wave can reach the level of the previous long-term high at the level of 0.0023.
The growth momentum has slightly decreased in the last few days, so the slight corrective pull-backs will not be unexpected.
TREND AND IMPORTANT LEVELS:
Main trend: NEUTRAL
Intermediate trend: UP
Daily trend: UP (continuation of the trend and the possibility of breaking higher after adjustment)
KEY LEVELS:
- for further increases - 0.0013 and later 0.0016
- for continuing correction - level 0.0013 and 0.00071
- for a continuation of decreases - level 0.00071
PS: If You do not want to miss another update, make sure You are following me on TradingView!

Bitcoin #BTCUSD - two possible scenarios for a correctionAt the moment, the fourth wave correction (4) can develop in two ways. The first one, marked in green, is a correction scheme in the form of the fourth wave triangle, in which C, D and E are still to be found. All these subwaves should end within the area of $ 16,500 - $ 12,750. Breaking any of these levels will invalidate this scenario for a correction. The second scenario, marked in red, is an irregular correction ABC, in which waves A and B seem to be finished, so only the C wave remains to be realized. In this scenario, I assume the level of $ 12,750 is broken, then breaking the level of subwave B to $ 12,000 and level test of $ 11.159 (wave A bottom). This level should not stop bears in this scenario and this level should also be impulsively broken through. In this case, the first target level for the C wave will be the level of $ 9,021.
Main trend: UP
Intermediate trend: UP
Daily trend: UP/ NEUTRAL (continuation of the correction)
Key levels:
- for further increases - the level of $ 16,500 and later $ 17,500
- for continuing correction - the level of $ 12,750 and later $ 14,400
- for the continuation of declines - the level of $ 12,500 and later $ 12,000 and $ 11,159
PS: Please follow me on TradingView!
PPS: The next Bitcoin analysis will be released if this post will make 100 likes.
Thank You and Good Luck! :)

Siacoin #SCUSD - one more wave to the upside? +315% possible!The Siacoin SCUSD cryptocurrency price has four growth sub-waves. In the current situation, there is one more wave missing to complete the overall wave progression of the higher degree - wave 5. If the 0.0504 level is the end of wave 4 correction, the target range for wave 5 is between 0.1538 - 0.2167.
The necessary condition for further increases is the break out of the technical resistance level at 0.1132.
On the other hand, any violation of the level of the 0.0410 level invalidates the upward scenario.
TREND AND IMPORTANT LEVELS:
Main trend: UP
Intermediate trend: UP
Daily trend: DROP / NEUTRAL (continuation of the correction and the option of breaking)
KEY LEVELS:
- for further increases - level 0.0838 and later 0.1132
- for continuation of correction - level 0.0838 and 0.05040
- for continuation of decreases - 0.0410
PS: Make sure you FOLLOW ME!
PPS: The next analysis of the next cryptocurrency will be published, if this post receives a min. 100 likes. :)

Crude met its match?After an aggressive extended rise, has crude oil met its match at the 11 year resistance level of $62.58? Good reversal price action after hours: prices flash spiked to $62.56 early in the after hours session, hitting just below the 11 year resistance level before immediately dropping down into the $62.15-$62.25 range. This looked like saudi traders trying to hit the buy stops to blow through the $62.60 resistance level without success. 4 hour charts and daily charts showing a nice bearish pin bar forming - a strong short term reversal signal. RSI well overbought at 82%-91%. Add to this that this is day 22 of an extended 3rd wave following a strong 5 wave uptrend (see my prior "Fall drive for $55" bull analysis from $42.26 that blew through my $55 target) and has crude finally met its match?
Great risk/reward at this level. Looking for at minimum a weak 28.6% retracement to the $59 level, but possible stretch to see 38.2% to $55 level.
New short entry at $62.20
Immediate 2 day price target: $61.40
long range price target: $59~
long range stretch price target: $55~
Are you in?

ELLIOTT WAVE ANALYSIS OF XAUUSDno thing else
SL:1309
TL:1338 or higher wait for wave 5 done.
every thing in the chart


BITCOIN #BTCUSD Two possible scenarios!We are going to wait a few days in this triangle and we will go either way, i personally think that btc 1.33% will go to set new highs. The volume is getting smaller among the sails, that indicates a possible volatility as BTC has shown us, in turn shortening the space of our ascending triangle, meanwhile you can trade a bit inside the triangle but be careful.
Important levels:
- for further increases - the level of $ 17000 and until psychological barrier
- for continuing correction - the level of $ 16,750 and later $ 14,700
- for the continuation of declines - the level of $ 14,500 and later $ 12,700 and $ 12000 unil 9000$

XLM/BTC Elliot Waves Fib Retrace/Ext- Wave 1 & 2 + 5 Sub Waves I've been following XLM for about 12 days now and I am also learning about Elliot Waves and Fib. This is my first attempt at Charting. I think I'm doing it right but could be all hosed up and if so... I'd like to know where and why.
1. Wave 1 completed a couple days ago and Wave 2's downward trend has been developing since.
I've used the Fib retracement and it looks to have bounced up between the .5 and the .618. That Fib is located on the far LEFT of the chart but the Yellow (2) and the Arrow are towards the right of the chart.
2. I expect Wave 3 (yellow line) to be LONGER than Wave 1, although it is currently drawn as a 1:1 Measured Move.
3. The 5 Blue Sub Waves inside the main Yellow Wave 1 were tricky for me but I believe they are correct. Blue Sub Wave 2 Retracement was SMALL as stated in the Thought Bubble. The Fib Retracement for Blue Sub Wave 2 is set off to the Lower Middle/Right of the Chart. You can see the bounce at the .236 level. Since this was a small retrace I would expect Blue Sub Wave 3's retrace to be much larger.
4. The Green Box/ Rebuy Zone was set between the Fib Retracements of .50 and .618 --- I actually layered a couple of buys there and it did hit and fill overnight while I slept. There is a very long red wick dipping down though it might be hard to see on this chart. The corresponding Fib Retracement is placed way over to the far right but there is a stretched out Thought Bubble that shows where it goes:)
5. The last thing I placed was the Fib Line Extention... trying to figure out where the TOP of Main (Yellow) Wave 3 will go. My 1st click was at the horizontal axis of Yellow 1 and Sub Blue 1. Second click at the top of Main (Yellow) 1 and Sub Blue 5. And, the third and final click was at the bottom of Main Yellow 2.
This gave me the Measured Move 1:1 at 0.00008530 as you will see at the top of the chart. I drew a "sell box" where I will eventually/likely layer my sells and take profits. I'll be especially stoked if this plays out as planned though I am quite okay with things going sideways as long as I can learn what I've drawn wrong or what derailed my plans to accumulate more magic internet money.
Okay... there it is... my first attempt at Charting and my first posting of a chart.
I'm all ears... whatcha' think?

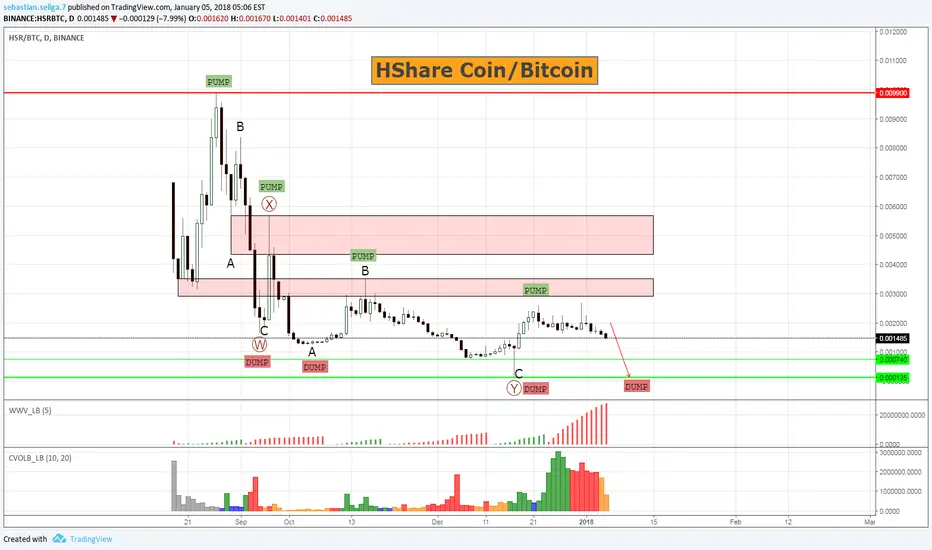
HShareCoin #HSRBTC - another dump in view?TECHNICAL ANALYSIS:
The price of the cryptocurrency HSare Coin quoted to Bitcoin HSRBTC remains on a downward trend, despite an extensive downward adjustment of the Double Triple WXY type correction. It is possible that the market will perform another downward wave, thanks to which the WXY structure will transform into WXYXZ, making all the movement even more complex and stretched over time. Such a scenario would correspond to the next cycle in the PUMP-DUMP scheme, as the price is currently in the DUMP cycle. This is confirmed by the lower lows on the daily time frame chart.
In order for growth to take place, the market would have to first of all reach 0.0030 (first pink zone) and move upwards to 0.0050 (second pink zone). Without such developments, it is difficult to talk about downtrend reversal.
TREND AND IMPORTANT LEVELS:
The main trend: DOWN
Indirect trend: DOWN
Daily trend: DOWN (price at a key level)
Key Levels:
for further increases - level 0.0030 and later 0.0035
for the continuation of drop - the level of 0.000740 and later 0.000135
PS: Please add me to the watched ones!
PPS: The next analysis of the next cryptocurrency will be published if this post will receive min. 50 likes. :)

NEOfailure to take out 110, then break below 88 opens retrace to 70 to complete a wave 2 of 3.
then over 110 opens 3 OF 3
240 eventually above.
THIS COULD ALSO END UP BEING A FLAT, THEN HIGHER

Cardano - #ADA - hit another target level!Just as anticipated, the price of Cardano ADABTC has hit the 261% Fibo extension at the level of 0.00009234. This level might be the top for the wave (3) and if this level is the top for this wave, then the corrective cycle in wave (4) should retrace min. 38%, so the next target would be at the level of 0.00006641.
Please notice the wave labeled as (3) might keep going up to the next target projection without any significant corrective cycle, but for now, the move up looks extended and need some pause
