Fake Pump, Real Dump?On the daily timeframe, XAUUSD is expected to be vulnerable to a correction toward the 3253–3325 area as the minimum retracement zone to potentially form a triangle pattern. However, in the worst-case scenario, indicated by the black label, XAUUSD may experience a deeper correction toward the 3093–3191 range.
Elliott Wave

#Nifty directions and levels for July 22nd:Good morning, friends! 🌞
Here are the market directions and levels for July 22nd:
The global market shows no major changes and continues to maintain a moderately bearish sentiment.
Meanwhile, the local market is exhibiting a moderately bullish tone. Today, Gift Nifty indicates a gap-up opening of around 100 points.
What can we expect today?
In the previous session, both Nifty and Bank Nifty experienced a pullback and managed to sustain it. However, structurally, the trend remains bearish in the lower time frame. So, how should we interpret this sentiment?
1, Since there’s no clear direction, if the market faces rejection initially, we can expect minor consolidation within the 38% Fibonacci range.
2, On the other hand, if it sustains the gap-up and breaks the immediate resistance with a solid structure, we can follow the direction for further upside.

One Last Dip Before the Pop?On the daily timeframe, we anticipate two possible scenarios for USOIL’s movement. In the red-labeled scenario, USOIL is expected to undergo a correction to test the 63.71–64.03 area. However, in the best-case scenario, if USOIL manages to hold above 64.03, it has the potential to strengthen toward the 68.27–72.53 range.


Elliott Wave Update – Is Wave 2 Complete?OANDA:XAUUSD
We're currently in an ABC correction following our Wave 1.
Potentially, Wave C is already completed, which would mean that Wave 2 has found its top.
❗ Why do I say potentially?
Because there's still a chance we could see a higher high before the real drop begins.
However, based on the current structure, I believe the top is in ✅
⚠️ Key Confirmation – White Trendline
📉 If we break below the white trendline, it confirms the end of Wave 2.
Then I expect a 5-wave move down:
➡️ (1) - (2) - (3) - (4) - (5)
📈 If the trendline holds, we might still see a higher Wave 2 before reversal.
📏 Fib Zones are marked on the chart for confluence and targets.
Let’s see how price reacts in the coming hours. A confirmed breakdown would set the stage for the next impulse ⚡

GOLD → Breakthrough accumulation. Correction before growthFX:XAUUSD has been strengthening since the session opened and is heading towards the 3374 zone of interest. The price has previously broken through the consolidation resistance and may test this boundary before moving further.
Gold is rising amid trade risks and dollar weakness. After falling to $3310, gold resumed its growth, seeking to break through the $3368 level. Support for prices was provided by uncertainty surrounding Trump's tariff policy and expectations for Fed Chairman Powell's speech. The US dollar weakened temporarily as investors sought refuge in gold amid trade disputes with the EU, political instability in Japan, and criticism of the Fed from the White House.
Technically, the price is in a realization phase after breaking out of consolidation, but it has encountered resistance at 3368, which could lead to a correction. The focus is on the 3350-3355 zone. If the bulls hold their ground above this zone, the market may return to the realization phase.
Resistance levels: 3368, 3374
Support levels: 3345, 3332
The market is bullish and feels support, especially against the backdrop of a weak dollar. Traders are watching Trump and Powell. If the latter decides to cut rates, for example tomorrow at 12:30 GMT, gold could rally...
Technically, gold could test 3350 before rising.
Best regards, R. Linda!

BITCOIN → Consolidation, retest of 120K. Correction of dominanceBINANCE:BTCUSDT , after a rapid rally and touching 123K, rolled back and entered consolidation, giving altcoins a chance. At the same time, Trump signed new crypto laws, but will these laws open new doors?
On June 18, the GENIUS Act was signed. Information can be found in the sources, but there is no direct reference to BINANCE:BTCUSDT.P , except perhaps indirectly: increased confidence in the crypto market, increased liquidity, possible new rules, and pressure on decentralized assets. Bitcoin has not always grown on positive news; more often it has been a deep pullback and liquidation before the momentum.
Technically, Bitcoin is currently consolidating, and I would highlight several key areas: the upper range is 120K-120.9K. The zone between these levels is particularly important, as this is where buyers were previously liquidated and sellers gathered (liquidation is possible).
The bottom is 117K (confirmed) - 116.2K. There is a liquidity pool on the support side.
additional scenario if the market does not reach resistance and decides to form a long squeeze before growth
Theoretically, I am not yet expecting a breakout and growth of Bitcoin. I think that consolidation may continue for some time, especially against the backdrop of a pullback in altcoins and a deep correction in the dominance index.
Resistance levels: 120100, 120850
Support levels: 117000, 116230
Since the opening of the session, the price has been working off the liquidity capture from 117K. There is a reaction - growth, which could bring the price to the zone of interest at 120K. But the question is: will the price hold in the 120K zone? A false breakout of resistance could trigger a correction to 117-116K. Thus, I expect the market to remain in consolidation for some time or even expand the current trading range...
Best regards, R. Linda!

Bitcoin Technical Setup: Support Holds, Wave 5 in FocusBitcoin ( BINANCE:BTCUSDT ) filled the CME Gap($117,255-$116,675) and started to rise, as I expected in my previous idea .
Bitcoin is currently trying to break the Resistance zone($119,530-$118,270) . In the last week's movement, the price of $118,000 can be considered as one of the most important numbers for Bitcoin , with a lot of trading volume around this price.
In terms of Elliott Wave theory , it seems that Bitcoin has managed to complete the main wave 4 near the Support zone($116,900-$115,730) and Support lines . The structure of the main wave 4 is a Zigzag Correction(ABC/5-3-5) (so far). There is a possibility that the 5th wave will be a truncated wave because the momentum of the main wave 3 is high and Bitcoin may NOT create a new ATH and the main wave 5 will complete below the main wave 3.
I expect Bitcoin to start rising near the Potential Reversal Zone(PRZ) and Cumulative Long Liquidation Leverage($118,277-$118,033) , break the Resistance zone($119,530-$118,270) and reach the targets I have marked on the chart.
Note: Stop Loss(SL)= $116,960
CME Gap: $115,060-$114,947
Cumulative Short Liquidation Leverage: $121,502-$121,134
Cumulative Short Liquidation Leverage: $120,612-$119,783
Cumulative Long Liquidation Leverage: $116,810-$115,522
Do you think Bitcoin can create a new ATH again?
Please respect each other's ideas and express them politely if you agree or disagree.
Bitcoin Analyze (BTCUSDT), 1-hour time frame.
Be sure to follow the updated ideas.
Do not forget to put a Stop loss for your positions (For every position you want to open).
Please follow your strategy and updates; this is just my Idea, and I will gladly see your ideas in this post.
Please do not forget the ✅' like '✅ button 🙏😊 & Share it with your friends; thanks, and Trade safe.

ELLIOTT WAVE XAUUSD H4 update
EW Trade Set Up H4
monitoring the end of subminuette wave ii
subminuette wave ii is going to end in a double zigzag.
Waiting for an accumulation in the price range 3250/3315 before subminuette iii starts.
daily key levels (area)
3315
3275 POC
3250

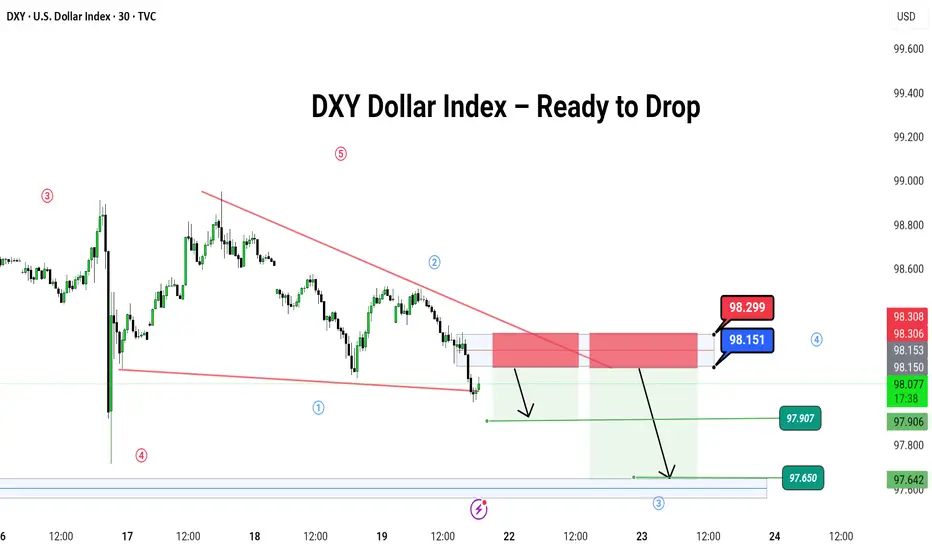
DXY Dollar Index – Ready to Drop
🌪️ DXY Dollar Index – Ready to Drop Like a Hot Potato? 💸
Hey traders! 🎯
The DXY (U.S. Dollar Index) is dancing inside a falling wedge 🔻, and it just hit the top of the party zone (red box 🎁).
📍 We're watching for a bounce up to this red zone near 98.151–98.299, then expecting a big slide down like a rollercoaster 🎢 toward:
🎯 Target 1: 97.907
🎯 Target 2: 97.650
🛑 Stop if it jumps over: 98.299
🌀 Pattern: Ending Diagonal / Wave 5 Setup
🧠 Logic: Smart money might be setting up the final wave before a major fall. Let it pop, then drop!
💡 It’s like the last spark before the fireworks go out 🎆
---
#DXY #USDIndex #ForexTrading #Wave5 #PriceAction #ChartPattern #SimpleTrading #DollarDrop
---
Let me know if you have ant suggestion ,
$PENGU: Taking Profit and Watching for a TurnIf you find this information inspiring/helpful, please consider a boost and follow! Any questions or comments, please leave a comment!
PENGU has made a strong move off the 0.007 level, now it just popped cleanly out of consolidation beneath the key LOI at 0.032. That break gave us the signal we needed for continuation, and so far, the price has followed through nicely.
But now, we’re approaching a zone where things could get a bit trickier.
This advance is starting to look like a classic wave 3 impulse, and while there’s no clear confirmation of a top yet, signs are beginning to flash caution. That means it’s time to start watching for potential topping behavior—especially if we move into a broader consolidation phase.
Here’s what’s on my radar:
• Wave 3 Exhaustion?
Still unconfirmed, but this could be the final leg of the wave 3 structure.
• AOI or Key Level Rejection
A stall or strong reaction near resistance could be a red flag. Channel parallel being reached.
• Bearish Divergence on the EWO
Momentum isn’t keeping pace with price. That’s often a precursor to a deeper pullback.
No need to force the next move here. This thing could just keep ripping up, but I am being extra cautious here. Not only to look for a potential top, but if a retrace is given, a potential long add to my current trade. Taking profit at these levels makes sense, especially given the early entry from 0.012 and my trade plan.
As always, trade what’s printed, not what’s hoped for. Stay nimble.
Trade Safe!
Trade Clarity!

Dow Jones is Nearing an Important Support!!Hey Traders, in today's trading session we are monitoring US30 for a buying opportunity around 43,950 zone, Dow Jones is trading in an uptrend and currently is in a correction phase in which it is approaching the trend at 43,950 support and resistance area.
Trade safe, Joe.

USDJPY, Elliott wave analysisOutlook for USDJPY on 3Days chart.
I think we are in sub-wave (ⅱ) of the wave 3.
The market remains volatile. The corrective wave may continue for a while.
If it can break through Deceleration channel line (Red), it will probably become bearish.

EURUSD is Nearing the Daily Uptrend! Hey Traders, in today's trading session we are monitoring EURUSD for a buying opportunity around 1.15800 zone, EURUSD is trading in an uptrend and currently is in a correction phase in which it is approaching the trend at 1.15800 support and resistance area.
Trade safe, Joe.

MTF bearish macro outlook on Ethereum, wave X finishedMini altcoin season over? I think we are about to see a record high amount of liquidation within the next few months.
This is not going to sit well with a lot of people I suspect.. Even if the count is technically correct, I suspect many will not see it as probable.
This is a bias based on not just Elliott waves, but internals of S&P and NQ looking week despite crawling higher this past few days. Ethereum and even Bitcoin having massive open interest (OI). Each time Ethereum has reached close to 4k area (2024 March, May, Dec, 2025 July), OI has increased significantly with high-ish positive funding rate. Almost all indicators for Bitcoin are red hot with bearish divergences. Momentum has stalled. Sentiment is ridiculously bullish.. after Bitcoin has had a 8x?
Having said that, from the last post, I was expecting somewhere around 3500-3600 region to finish the X wave. 1400 to 1800 run is impressive. But, so were the S&P, NQ, Bitcoin, and gold. I still see the recent April to July run as a 3-wave in Ethereum.
Invalidation is simple: it needs to break 4k. That would mean there are multiple 1-2's stacked in the April-to-July run..
I see 1900 as a very strong level. I suspect that's not the final destination but I expect to see a good reaction/bounce from that area. My primary target is just below 1400, the April 2025 low. Anywhere between around 1050 and 1400 should suffice, forming a massive running flat as a corrective wave 2 since 2022.

GBPUSD → Hunting for liquidity before the fallFX:GBPUSD is forming a countertrend correction towards the liquidity zone amid a correction in the dollar. Are there any chances for a trend break?
The currency pair is taking advantage of the opportunity to test the trend resistance and consolidation amid the dollar correction. Focus on the nearest resistance level of 1.3467, behind which lies a pool of liquidity relative to the local trend.
Based on the overall market sentiment (bearish), a breakout of the 1.3467 resistance could trigger a downward pullback.
Resistance levels: 1.3467
Support levels: 1.3370
If, during the retest of the specified liquidity zone, the market is unable to continue its upward movement and the price returns below the level, we will have a chance to catch a decline within the current trend.
Best regards, R. Linda!

ETH/USD Breaking Higher, Can Fill The Gap? Hey traders,
Some of the altcoins are recovering very nicely today, with Ethereum being no exception. In fact, we’ve seen a pretty nice consolidation on ETH over the last three weeks, and it looks like it’s breaking to the upside right now. I wouldn’t be surprised to see more gains unfolding into wave five of a five-wave advance away from the April lows.
Targets around 3000 and even 3300 could be quite interesting, especially if we consider the big gap that dates back to February.
GH

Jasmy long elliot wave A look at Pengu/usd with Eliot wave on the daily, lots of resistance above the current price, and with good crypto policies going into effect holding for a long long time might be profitable
and this crypto article is reason to dream ;) /cheers!
www.tradingview.com
Thanks again!

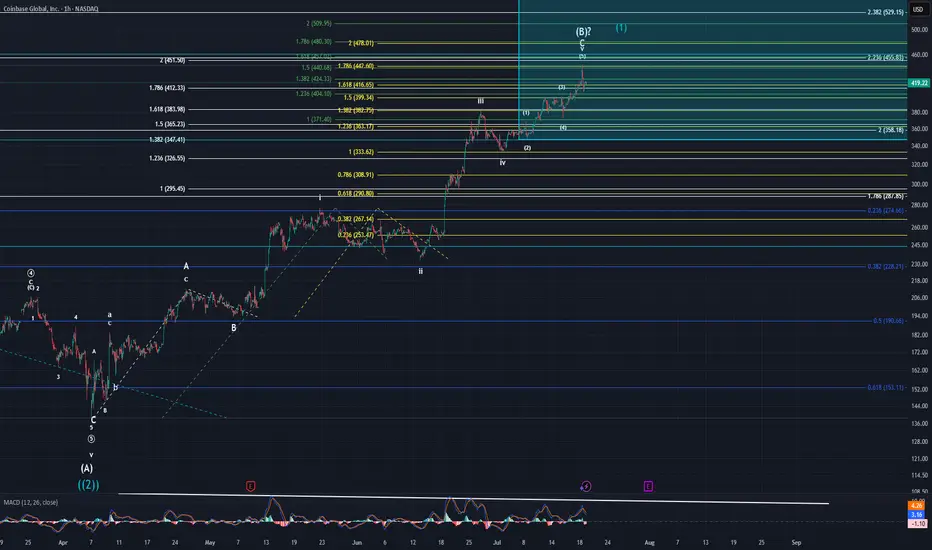
Coinbase UpdateI stated that if price broke through the yellow 1.618 @ $416 with strength that I would start to very seriously doubt the corrective count that I have. Well, it broke well through that fib only to immediately fall right back down and close only $3 away from it. Now, that being said, I am still in very seriously skeptical of the corrective pattern I am tracking. Lets start at the beginning of how I re-evaluated this pattern.
First thing I did was revisit the very beginning of the larger move higher that started way back in January 2023. I zoomed out to the monthly and then worked my way through the weekly, daily, 4hr, so on and so forth. I looked at MACD in relation to price action and notice a few things.
MACD Observations:
#1 - Monthly is still pointing higher in a strong manner.
#2 - Weekly is also pointing higher with strength and is on the verge of making a new high.
#3 - Daily just made a new ATH. This is significant given we're supposed to be in a (B) wave according to my white count.
#4 - Daily high in MACD combined with a high in price suggests eventual continued upside movement as momentum is still to the upside.
#5 - 4Hr and below is showing weakness
Now, to interpret all of this, one must know the typical correlation between price and MACD. Before, my ALT was that this was a continuation of intermediate (5) of primary ((1)). Now, after I have reflected on the recent longer-term developments, I am of a mind that this could be the intermediate wave (1) of primary wave ((3)). That would help to explain why the move down that began in Dec 2024 breached the wave 4 of a lesser degree. When you turn off log scale on the longer-term retracement fibs, it shows price slightly breached the 0.618 @ $153.11 to hit a low of $138.45. Is this the more accurate way to look at this? I cannot say for certain, but it sure is starting to seem like it.
Chris and I have been forecasting an imminent high in the overall markets for some time now. I still believe the markets are on the precipice of a super cycle wave (III) high. So how does this new possible outlook on Coinbase fit in with the overall markets dropping for the next few decades. How can it continue to move higher towards such highs while most everything else is getting hammered? Short answer, I have no idea. I have largely given up trying to link causation with events. Sure, it is fun to think about it and try to link certain things towards price action. In the end though, what does it really matter? All I care about is WHAT price does. Not WHY it does it.
For now, I am still stuck in not being able to make a decision on which count I prefer more. After this last week or two of price action I am beginning to strongly lean towards Coinbase entering into a new bull phase in the form of primary wave ((3)). The main problem I have with wave ((3)) though is that would suggest that primary wave ((2)) only lasted for four months whereas primary wave ((1)) lasted for two years. There are no rules that says this cannot be the case. It is odd for sure though.
Rather this is wave (1) of ((3)) or wave (B) of ((2)), price is overextended and does need a consolidation of the gains made in the last four months. As of now, if we have a top or only make a minimal new high, I forecast that retracement will fall to sub $300 easily and likely $250 to as low as $170. Once we have a larger abc pattern down from a top, that will be a GREAT time to go long. Worst case scenario, I will ride the minor B wave higher if it is a larger corrective pattern. Best case scenario, I ride the wave (3) of ((3)) to all time new highs. Obviously, it goes without saying one needs to keep their assets protected no matter what happens.
P.S: I am sorry the chart looks a little messy. I thought it pertinent to leave the three different fib extensions to give you as much information possible as to what prices possible intentions are. There is a lot of information in this post. PLEASE let me know if you have questions or I left anything unanswered.
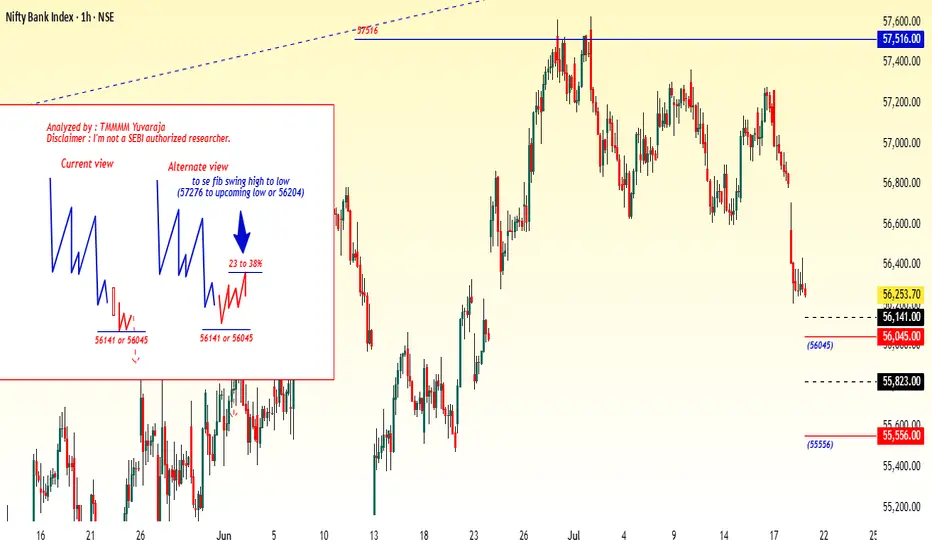
#Banknifty directions and levels for July 21st:What can we expect today?
In the previous session, both Nifty and Bank Nifty fell sharply. Structurally, the trend remains negative.
However, due to major firms' results, we might see some volatility in the first half, possibly leading to initial speculation.
That said, as per the structure my expectation is a continuation of the correction that's my current view
The alternate view is If the market takes an initial pullback, we could see a 23–38% retracement in the minor swing. Even in this scenario, the bias remains bearish unless the 38% Fibonacci level is broken.
A break above 38% could extend the pullback toward the 50–78% levels.
#Nifty directions and levels for July 21st:Good morning, friends! 🌞
Here are the market directions and levels for July 21st:
The global market shows no major changes and continues to maintain a moderately bearish sentiment.
Meanwhile, the local market is exhibiting a bearish tone. Today, Gift Nifty indicates a neutral to slightly gap-down start,
around 30 points negative.
What can we expect today?
In the previous session, both Nifty and Bank Nifty fell sharply. Structurally, the trend remains negative.
However, due to major firms' results, we might see some volatility in the first half, possibly leading to initial speculation.
That said, as per the structure my expectation is a continuation of the correction that's my current view
The alternate view is If the market takes an initial pullback, we could see a 23–38% retracement in the minor swing. Even in this scenario, the bias remains bearish unless the 38% Fibonacci level is broken.
A break above 38% could extend the pullback toward the 50–78% levels.

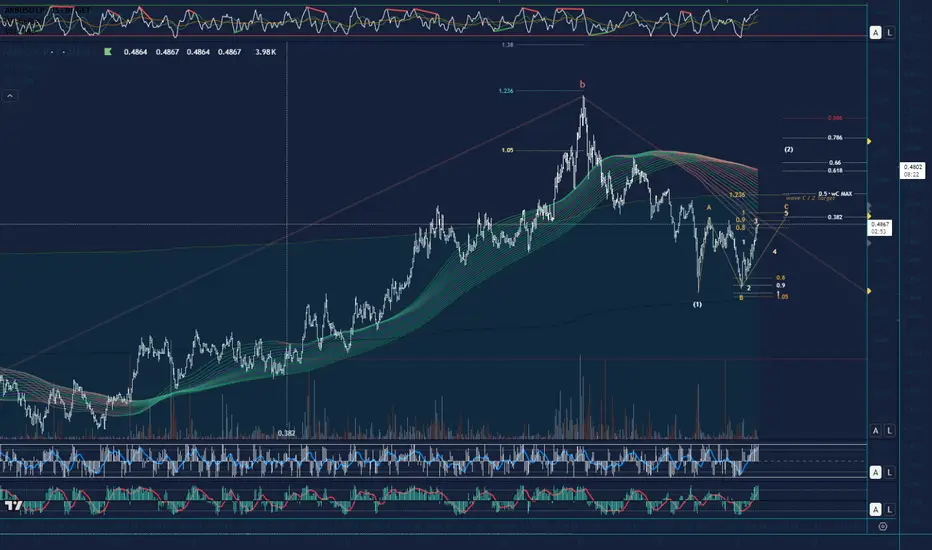
Update on Arbitrum Expanding FlatZooming in on the 3min TF the Target for completion of wave C of regular flat (White wave 2 retracement) will be 0.4888. Looking to reverse lower at this level to complete the white impulse down for wave C of larger degree Expanding Flat (See earlier post for HTF count)