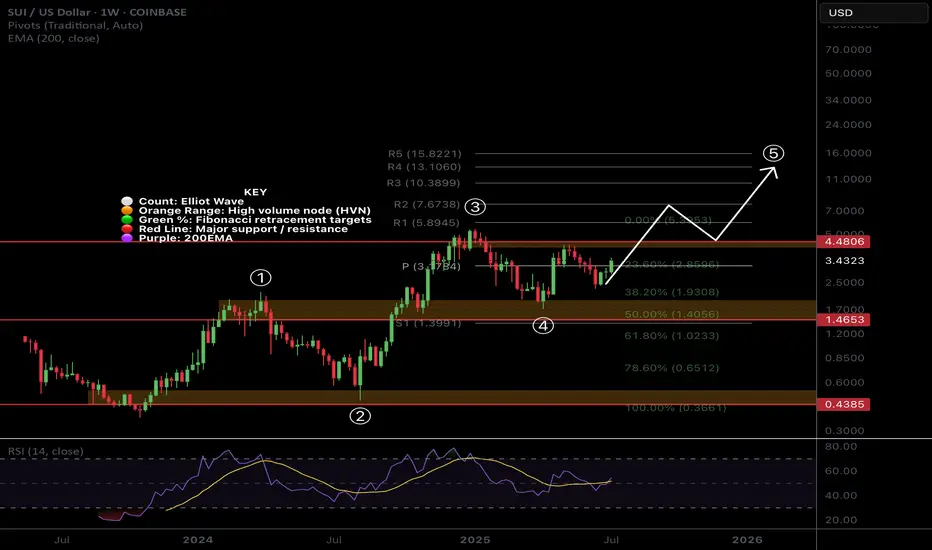
$SUI Wave 3 to Continue with a Strong Weekly CloseCRYPTOCAP:SUI printed a great weekly candle that will be closing today above the weekly pivot point with RSI trying to flip bullishly.
Price found support at 0.5 Fibonacci retracement and High Volume Node.
Wave 4 penetrated wave 1 which we potentially have a ending or leading diagonal Elliot Wave count limiting the potential upside with my current terminal target being around $10-13. Wave 4 could also actually be another wave 2 which would give us ridiculous targets but this is my preferred count for now.
Safe trading
Elliott Wave
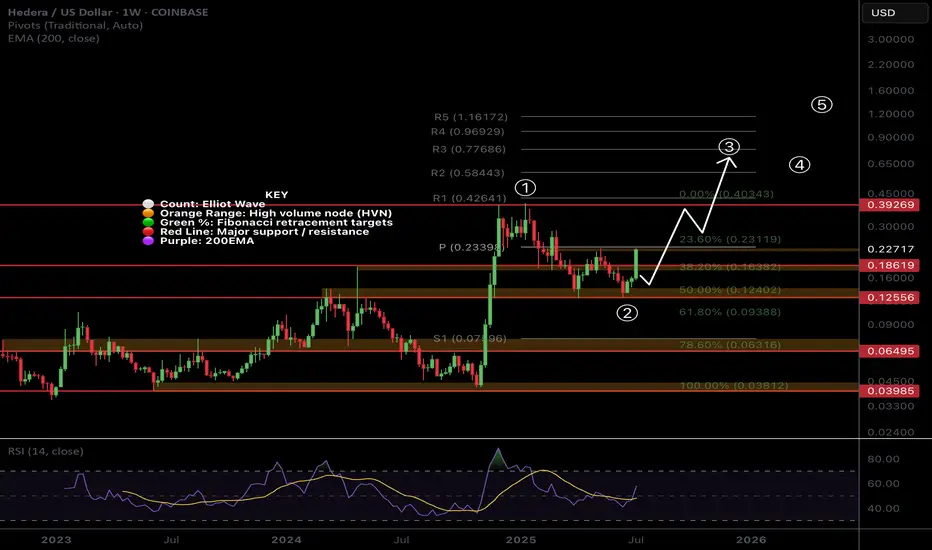
$HBAR Shooting Up in Wave 3CRYPTOCAP:HBAR is flying off the High Volume Node and 0.5 Fibonacci retracement with Elliot wave 3 characteristics keeping the count alive.
Price is testing the weekly pivot point which should act as resistance for the time being but a break straight through will demonstrate a very bullish trend. Traders should be cautious about entering here.
RSI confirmed a weekly bullish divergence
Safe Trading
20 year long BTC analysisTaking into account the halvening and the recent bullish news of countries and big companies wanting to establish a BTC reserve. I think we can see some crazy cycles in the future.
These entities are most likely planning to hold for a minimum of 20 years. And countries won't be shy to print some extra dough for it. Some may see it as an opportunity to finally get rid of their national debt.
As long as fiat exists BTC will most likely keep going up. Its that simple.

Xrp wave countXrp wave count to see where this bull run is going to take us.
Please be realistic and don’t miss out on massive profits by being greeedy!!! Xrp will not be $100 this year.
Probably have to wait a while, like years. So take your profits at $7-10, and then buy back in after the corrective phases.
Be smart.

More upside for BitcoinHi traders,
Last week Bitcoin made a small move down before it shot up again.
It looks like this is wave 3 so we could see a small correction down and more upside for this pair.
Let's see what the market does and react.
Trade idea: Wait for a small correction down on a lower timeframe and a change in orderflow to bullish to trade longs.
If you want to learn more about trading FVG's with wave analysis, please make sure to follow me.
This shared post is only my point of view on what could be the next move in this pair based on my analysis.
Don't be emotional, just trade your plan!
Eduwave

Gold is ready to go up againHi traders,
Last week gold went up again after a correction to finish (orange) Wave D just as I've said in my outlook.
Next week we could see another move down for Wave E and after that the next impulsive wave 5 up.
Or the last correction down was already wave E and gold started the next impulsive wave up.
In both cases gold will shoot up after a correction down.
Let's see what price does and react.
Trade idea: Wait for a small correction down on a lower timeframe and a change in orderflow to bullish to trade longs.
If you want to learn more about trading FVG's & liquidity sweeps with wave analysis, please make sure to follow me.
This shared post is only my point of view on what could be the next move in this pair based on my technical analysis.
Don't be emotional, just trade your plan!
Eduwave

More upside after correction for SPX500USDHi traders,
Last week SPX500USD went a little more up (diagonal) just as I've said in my outlook.
Next week we could see the start of a bigger correction down (grey wave 4) and a break of the dotted trendline. Or the diagonal is a leading diagonal wave 1 and grey wave 3 extends more.
Let's see what the market does and react.
Trade idea: Wait to see if price breaks the dotted trend line (for shorts) or not (for longs).
If you want to learn more about trading FVG's & liquidity sweeps with Wave analysis, then please make sure to follow me.
This shared post is only my point of view on what could be the next move in this pair based on my technical analysis.
Don't be emotional, just trade your plan!
Eduwave

Up again for EUHi traders,
Last week EU went exactly as I've said in my outlook.
It slowly went down to take the liquidity.
Next week we could see price reverse from the Daily FVG below and start the next impulsive wave up.
Let's see what the market does and react.
Trade idea: Wait for the finish of the correction down and a change in orderflow to bullish on a lower time frame to trade longs.
If you want to learn more about trading with FVG's, liquidity sweeps and Wave analysis, then make sure to follow me.
This shared post is only my point of view on what could be the next move in this pair based on my technical analysis.
Don't be emotional, just trade your plan!
Eduwave


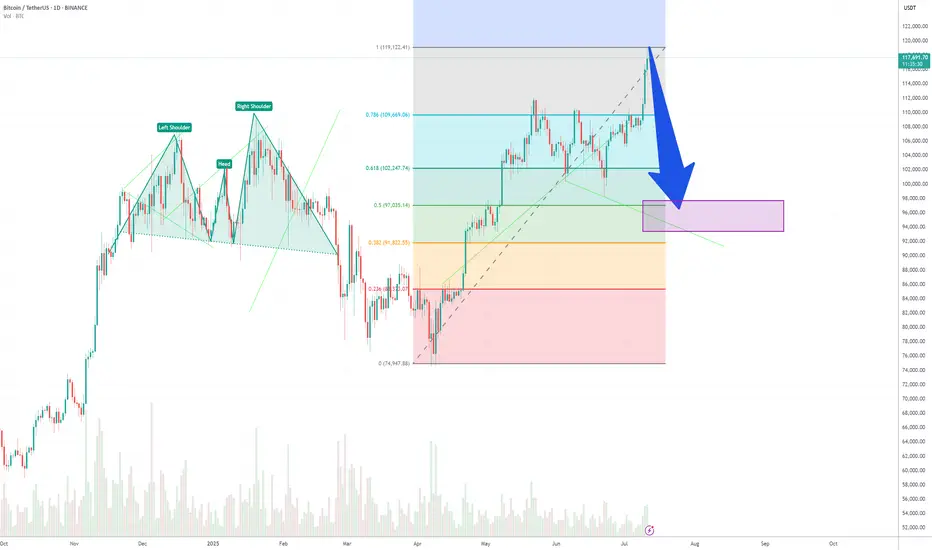
from 118k $, I expect a correction to the area of 100k$Somewhere from the current levels of 118k $, I expect a correction to the area of 100k$
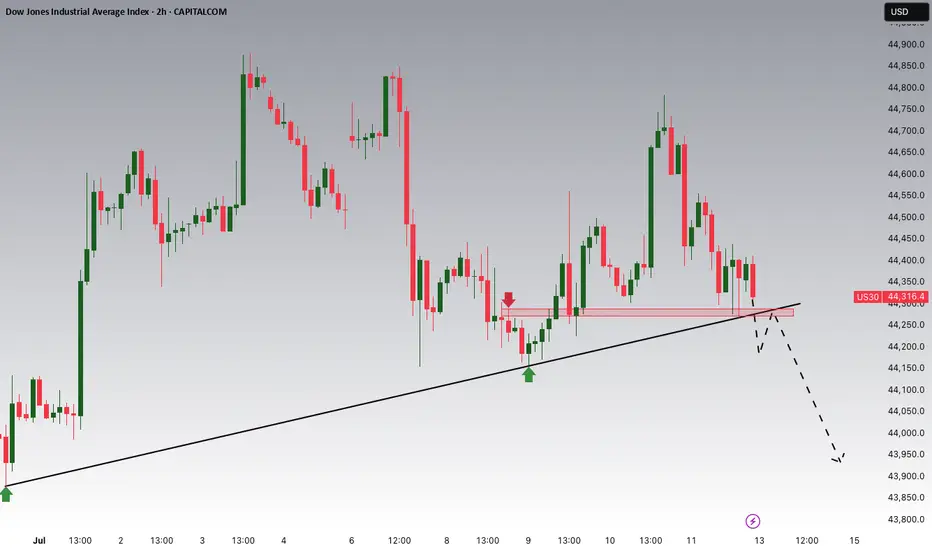
Dow Jones Potential DownsidesHey Traders, in the coming week we are monitoring US30 for a selling opportunity around 44,270 zone, US30 is trading in an uptrend and currently seems to be attempting to break it down, if we get dips below the trend we will be looking for a potential retrace towards further downsides.
Trade safe, Joe.
GOLD → Retest of consolidation resistance. Breakout?FX:XAUUSD is consolidating in a symmetrical triangle pattern. The price is stabilizing amid a falling dollar and uncertainty...
Gold is recovering after falling to $3,283 thanks to a weaker dollar and lower bond yields amid concerns over Trump's new tariff threats. The announced tariffs against seven countries, including Brazil and the Philippines, have heightened tensions, partially offsetting the Fed's hawkish signals. Markets are now awaiting new data from the US and speeches by Fed officials, which could influence the further dynamics of gold.
Technically, gold is squeezed between the resistance and support of a symmetrical triangle. The price is being aggressively pushed away from support within a bullish trend, but at the same time, gold is testing resistance for the fifth time, which only increases the chances of a breakout.
Resistance levels: 3330, 3345, 3358
Support levels: 3308, 3295
If gold continues to storm the local resistance at 3330 and the triangle resistance during consolidation, we will have a good chance of catching the breakout and growth. An additional scenario could be growth after a shake-up of the triangle support and the global trend.
Best regards, R. Linda!

Netflix is going to fall sharply soonNetflix is in the huge 5th wave extension. I expect it to complete wave (v) of 5 very soon, probably within the next week.
RSI divergence on 3-days, weekly frames is quite visible and supports the upcoming trend reversal.
When wave 5 is extended, retracement typically goes to the bottom of wave (ii) of this 5th wave. This would mean 1180-1195 USD to end the wave 5. Also, at this price wave 5 will be 2.168 times bigger than waves 1 and 3 together.

Potential Reversal Ahead: Elliott Wave AnalysisHello friends,
Welcome to RK_Chaarts,
Today we're going to analyze chart of stock named IDFC First Bank, based on Elliott wave theory.
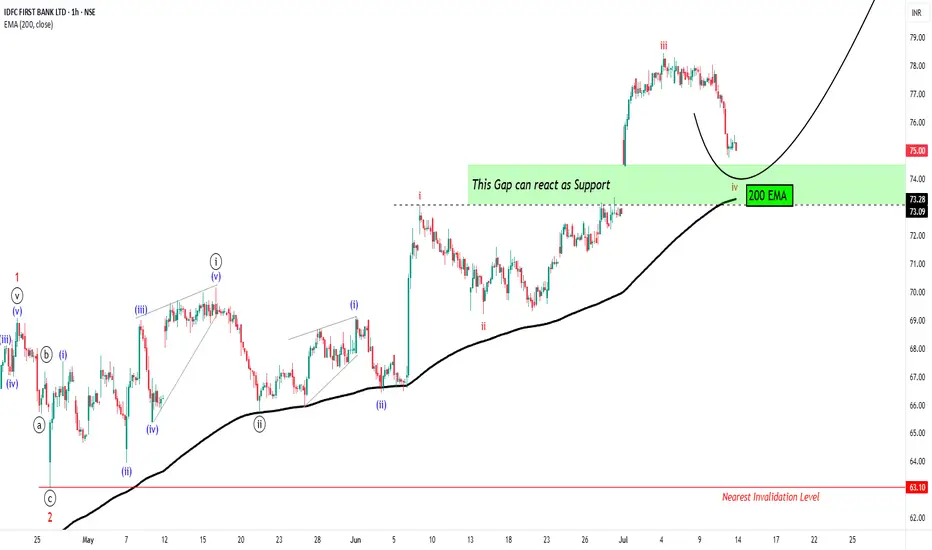
Today, we're analyzing the chart of IDFC First Bank using Elliott Wave theory. On the chart, we've marked the Elliott Waves, indicating that:
- Red wave 1 and 2 (Minor degree) have ended
- Price is unfolding into red wave 3 (Minor degree)
- Black wave ((i)) and ((ii)) (Minute degree) have completed
- Black wave ((iii)) (Minute degree) is ongoing
- Blue wave (i) and (ii) (Minuette degree) have finished
- Blue wave (iii) (Minuette degree) is in progress
- Red wave i, ii, and iii (Subminuette degree) have completed
- Possibly in the correction phase of red wave iv (Subminuette degree)
We observe that the price gapped up, retraced to correct wave iv, and is now supported by the gap zone. Along with 200Exponential Moving Average is also at Gap level which can also provide a good Support to same view.
Our estimate suggests a high probability of a price reversal. However, market uncertainties exist.
Potential price targets: 81, 93, and 100+
Nearest invalidation level: 73.09 (wave iv should not overlap wave i)
Please note that this analysis is for educational purposes only. I'm not a SEBI-registered analyst, and you should consult your financial advisor before trading or investing.
Let's see how the market unfolds. This entire study is shared solely for educational purposes. Thank you so much.
I am not Sebi registered analyst.
My studies are for educational purpose only.
Please Consult your financial advisor before trading or investing.
I am not responsible for any kinds of your profits and your losses.
Most investors treat trading as a hobby because they have a full-time job doing something else.
However, If you treat trading like a business, it will pay you like a business.
If you treat like a hobby, hobbies don't pay, they cost you...!
Hope this post is helpful to community
Thanks
RK💕
Disclaimer and Risk Warning.
The analysis and discussion provided on in.tradingview.com is intended for educational purposes only and should not be relied upon for trading decisions. RK_Chaarts is not an investment adviser and the information provided here should not be taken as professional investment advice. Before buying or selling any investments, securities, or precious metals, it is recommended that you conduct your own due diligence. RK_Chaarts does not share in your profits and will not take responsibility for any losses you may incur. So Please Consult your financial advisor before trading or investing.
Silver Analysis – Potential Top in Place?FXOPEN:XAGUSD
We've now reached the Fibonacci Extension Take-Profit zone from our (4) to (5) move – which is actually part of the larger Wave 3 structure.
The move up unfolded in an ABC structure, which itself formed a smaller 1-2-3-4 (with the 4 again as an ABC).
🚀 So technically, we may have already topped out.
⚠️ What to Watch For:
There may still be some upside volatility, which is why I’m currently watching the yellow trendline closely.
📉 A clean break below it would signal that Wave (5) is likely done, and we’ve started our next move:
➡️ (1) → (2) → (3) → (4) → (5)
This would be the start of corrective Wave (A) of a larger ABC move.
📈 If the yellow trendline holds, we could still see higher highs – but based on current chart structure and momentum…
📊 Indicators are extremely overbought and flashing bearish divergence, supporting the idea that a local top is already in.

XAG/USD – 4H Elliott Wave AnalysisFXOPEN:XAGUSD
Silver is currently in the final stages of a higher-degree Wave 3, which itself is unfolding in a classic 1-2-3-4-5 structure. Within this larger move, we are completing Wave C, which again consists of five subwaves – and that’s where we are right now: transitioning from Wave 4 into Wave 5.
🔍 On this move, we can identify a clear ABC structure — or rather, a cluster of smaller ABC setups — within the Wave 4 to Wave 5 leg.
⚪️ The white Wave A has already completed.
🌀 We are now on the way to the white Wave B.
💠 The expected ABC move from A to B is marked in turquoise on my chart.
📈 From B, I’m expecting a clean 1-2-3-4-5 impulsive rally into the higher-degree target zones of Wave 3.
🚨 If the turquoise Wave 5 fails to hold or shows early weakness, I’ve marked an alternate yellow A, signaling potential downward momentum. In that case, I’ll be watching closely for impulsive moves to the downside — giving us fresh short (sell) entry opportunities.

XAU/USD – 4H Elliott Wave AnalysisOANDA:XAUUSD
We are currently in an upward correction on the 4H chart, developing within an ABC structure from Wave 1 into Wave 2.
✅ Wave A has already been completed.
🔁 Wave B is most likely in place – though I've also marked an alternate yellow B if the white one fails.
⚡️ We’ve seen the first impulsive push up, which I label as a smaller Wave 1 within B.
🔄 Now expecting an ABC pullback into the smaller Wave 2.
📐 The Fibonacci retracement zone (white box) marks the key area for this correction.
🎯 Blue lines inside the zone are my targets for Wave 2.
If the structure holds, we should see a clean 1-2-3-4-5 move in Wave B toward Wave C – completing the higher-degree Wave 2. After that, I expect bearish momentum to take over again.

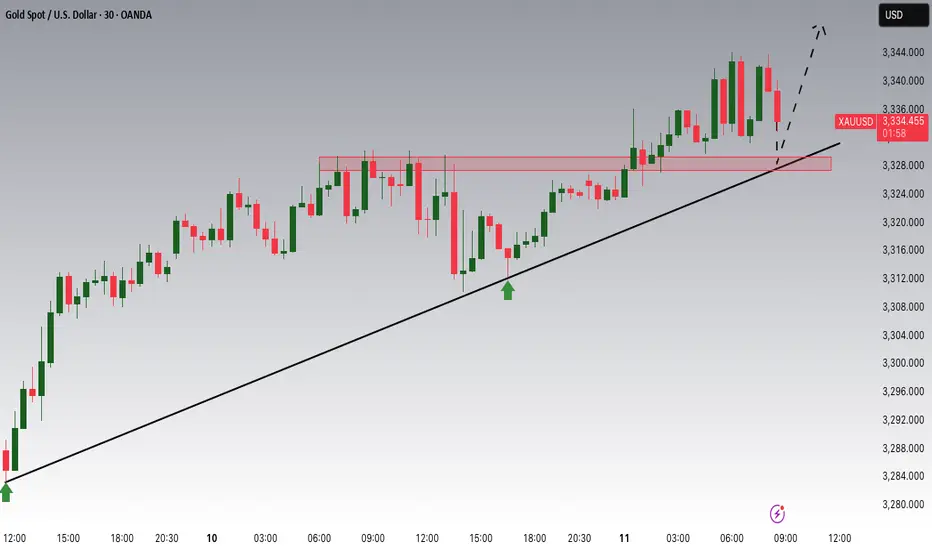
Gold Potential UpsidesHey Traders, in today's trading session we are monitoring XAUUSD for a buying opportunity around 3,330 zone, Gold is trading in an uptrend and currently is in a correction phase in which it is approaching the trend at 3,330 support and resistance area.
Trade safe, Joe.
GOOG Wave B
Bullish price action from the last couple of months has been unconvincing, and this looks more like a wave B correction.
A break of the black ascending channel would be a trigger for wave C.
It would be interesting to see a reversal pattern in smaller timeframes if price touches the gray supply zone.

S&P 500 - Micro Count Ew AnalysisThis is my lower timeframe analysis. Price has now reached the ideal target area for Wave 3, suggesting that a corrective phase may soon follow. This potential retracement could also align with broader market reactions to a possible announcement from Trump regarding new tariffs on Russia this coming Monday.
P.S. The macro count and higher timeframe outlook will be shared later.

AMZN Ending DiagonalFrom an Elliott Wave point of view, we could be near a downside correction (wave C).
The rise from late May doesn´t have the same momentum, and looks like an ending diagonal.
A break from the bottom of the ascending wedge would indicate wave C is in progress

TACO about to become TUFTThe acronym "TACO" has been adopted as a market slogan to explain the shocking volatility brought on by Trump's follow through with his campaign promises to enact and/or adjust tariff's in the USA on its trading partners around the world. The mere mention resulted in a 1,334 point sell-of culminating in April. When Trump walked back {read: backed off in terms of immediacy of effect..} the market "rallied."
However, at the bottom of the lows, ES1=4,832, all strength fell out of the index and all Minor pattern lows were breached. This leads me to believe that 4,832 was just that...a LOW and not a bottom. To resolve this aspect of the price pattern in relation to strength, price and go for a higher low on less strength, or a lower low on more strength...either way, this can only result in a sell-off of .618 of 1,334, or approximately 824 points. Assuming participants intend to go lower on more strength, the bottom will be struck approximately 2,159 points lower in the 4,200 region, since this irregular B has complicated the direct 1.0 hit in the 4900 region. Still possible, but unlikely we swing within 100 points of the low, all while strength falls out and holders get brave.
The other problem I see with this wave higher is that it is sloppy. How?
(1) It is sloppy first of all because as it approached its 1.382 level off the first wave up (at least as noted by a premier Elliot Wave pub) it basically ripped right through. What is healthy for an impulse is to approach the 1.382, then pause for a retracement to the 1.0.
(2) The wave began with an obvious 3 wave pattern, and I was surprised to see prominent publications accepting such an obvious corrective pattern as the start of a true impulse upward. The 3 waves that took us to 5,528.75 are accordingly labeled as the A wave on this chart. Even if this is an Ending Diagonal, which is a motive wave, but not an impulse, which starts with 3 waves, we should at minimum get overlap at the 5,528.75 level in order to continue higher.
(3) We are getting mixed MACD readings between the daily and hourly charts right where price would be expected to blast off if the daily is correct and would be expected to fail if the hourly bearish divergence is correct.
As we approach this 1.618 level of 3,398.75 on ES2, off the pattern as stated, we can use it to guage the downside expectation. A direct hit and sell-off might lead us to the conclusion that the 4900s are in order or even 5400s, but a failure here, 10-20 points off, would be considered more bearish. Giving the benefit of the doubt to price, I have included various ways that price can regain its footing, here stating a primary count that this is the Minor A of an intermediate (B) wave, because it has been very bullish, very disorganized, and has created a higher MACD reading on the daily chart. Alt count is that this is All of Intermediate (B), and Intermediate C should commence to carry price into the low 4k region.
If price is to go higher, it must overcome a 3 wave start, an irregular and disorganized pattern, and conflicting strength readings...not to mention, a Fundamental hurdle that Trump Ultimately Follows Through.

DUSK Missing Wave 5
Probably not the most popular opinion, but in my primary count, DUSK would still have one more leg down for Wave 5.
Count is valid as long as we stay below 0.0830 (wave 1 low).
