Ping An Group (2318) is on the long riseHere is my Elliott Waves analysis for 2318 on HKEX. I did it for all history of the group and believe that we are at the start of wave 3 of very very big 3 now, which means it is going to be multi-year rise, of course, if the count is correct.
After making a long correction, which I labeled as W-X-Y, the stock started to print a leading expanding diagonal. I detected this pattern in a number of stocks in China as situation started to improve with government support (JD is an example, see my previous idea).
I believe that correction is 99% behind as we gapped up today on decent volumes from the bullish flag upper edge. And this today's move pushed the price above 200 Weekly EMA and closed there.
Bullish cross of 50 to 100 EMAs on weekly is coming right now.
I don't want to wait for EMAs to perfectly line up as now there is enough evidence for we are set to go higher long term.
Full big picture labelling can be found here:
Elliott Wave

Bitcoin Elliot Wave CountBullish for the next 90 days
Blow off top thesis
Pump into rate cuts and Big Beautiful Bill.

ETHUSDT: Elliot Analysis You can see the Ethereum chart in the long term, which indicates the end of the fourth wave and the beginning of the fifth wave, so with capital management, you can have a good investment.

EUR/USD Reversal or Trap? 4H Clean Breakdown InsidePrice just tapped into a high-probability sell zone after a corrective Wave 2 structure. With sellers already active at 1.16342 and 1.17635, this setup is not just textbook—but a potential goldmine for swing traders.
🔻 Is this Wave 3 continuation about to begin?
🔍 Liquidity swept. Zones respected. Structure still bearish.
⚠️ Many traders will miss the bigger picture here—will you?
👇 Drop your thoughts:
Are we about to break 1.13000?
Do you agree with the Elliott Wave count?
What’s your bias on DXY?
💬 I personally reply to every comment—let’s build this chart together.
🔥 If you caught the entry, show your entry point and reasoning—let’s level up as a team.

End of GOLD correction#GOLD #XAUUSD
UPDATE
As I mentioned earlier, gold was forming a contracting triangle.
The wave-(e) of the triangle has formed a double pattern diametric-X-triangle and has moved beyond my expectations (the post-pattern movement has passed ), breaking the trendline of (a)-(c). However, since it did not exceed the end of wave-(c), the contracting triangle has not been invalidated.
We expect gold to gradually rise from this range and surpass $3,500.
Good luck
NEoWave Chart

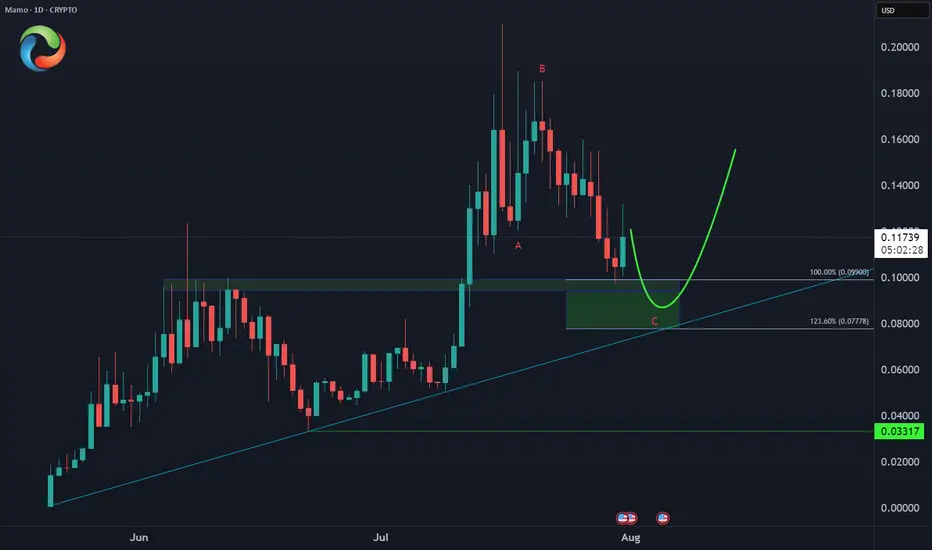
MAMO Buying Opportunity🤑 CRYPTO:MAMOUSD did 3 waves pullback into extreme area $0.099 - $0.077 and as long as it holds the trendline from May low then Bulls will be looking for more upside to take place from here!
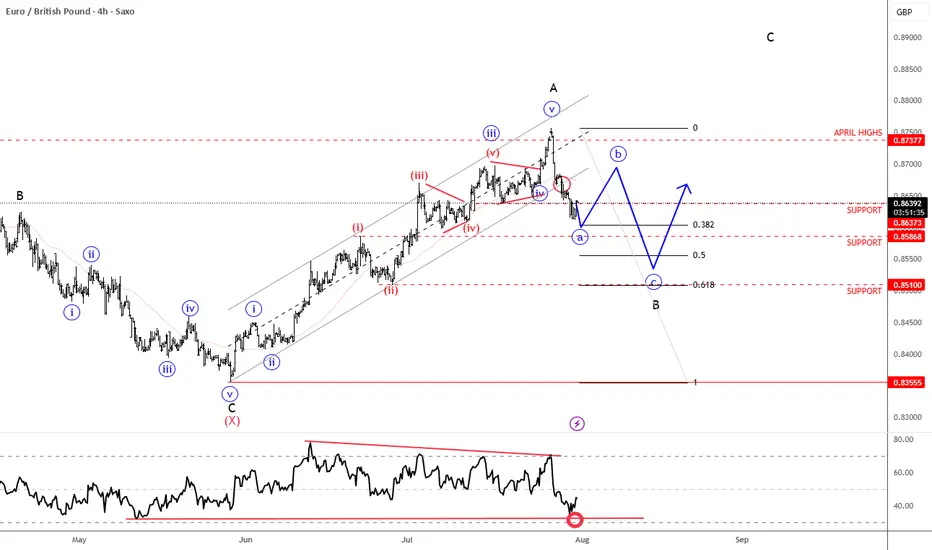
EURGBP Steps Into A Correction Within Ongoing RecoveryEURGBP is sharply down after reaching April highs for wave »v« of an impulse into wave A. As expected, the pair is now unfolding a three-wave abc corrective setback within higher-degree wave B. Currently, EURGBP is breaking below the channel support line in a sharp and impulsive projected wave »a«. A corrective recovery in wave »b« may follow, considering that RSI is already at the lower side of its range. Overall, we are still tracking this correction toward the 0.85x support area, which could act as a base before a potential bullish continuation higher into wave C.
XRPUSDT → Range formation. Retest of resistanceBINANCE:XRPUSDT.P , after a false breakout of the daily resistance level of 3.352 and the elimination of traders, has entered a correction phase. The trading range shown below has been formed, with an emphasis on resistance...
XRP previously formed a false breakout of the daily resistance level of 3.352, as indicated in the idea above. After changing its market character, the price entered a correction phase. Focus on the range of 3.00 - 3.264. A retest of resistance (zone of interest and liquidity) is possible before falling to 3.161, 3.05 or to the liquidity zone of 3.00. There are no technical or fundamental reasons for exiting the consolidation; most likely, a retest of the zone of interest may end in manipulation and a pullback to support...
Resistance levels: 3.1609, 3.264, 3.352
Support levels: 3.05, 3.00
I do not rule out the fact that a retest of the 3.264 resistance level may have a breakout structure and the price will continue to rise, but based on the price behavior pattern on D1, the market structure, and market stagnation, I conclude that at the moment, the chances of seeing a correction from resistance are higher. Further developments will need to be considered after the retest of key zones on the chart...
Best regards, R. Linda!

Nasdaq Short: multiple reasonsOver here, I present to you the Nasdaq short idea again. For my previous idea, it was stopped out at 23500. This time, I changed the wave counts again, mainly merging the previous wave 5 into wave 3, allowing for the new high to be a wave 5.
On top of that, here are the few other reasons for the short:
1. Fibonacci extension levels: Wave 5 is slightly more than Wave 1.
2. RSI overbought for the 3rd time on the hourly timeframe.
3. Rising wedge false breakout.
4. Head-and-shoulders on the 1-min timeframe.
As usual, the stop for this idea is slightly above the recent high, around 23700.
Thank you.

Nasdaq Short: Catching a rising knife. Stop loss at 23500.Hi everyone, here I am trying to catch the peak of Nasdaq again. As mentioned, the previous idea was stopped out at 23,320. Now, for this idea, I am attempting another short with a 30 points risk for Nasdaq. The stop for this idea is fixed at 23,500. The take profit is 22,650.
This is a positional trade and I will re-evaluate as the waves unfolds. So the strategy will mainly be trailing the stop periodically.
Thank you and good luck!

BTCUSDT – Diametric G-Leg Underway?⏱ Timeframe: 4H / 1H
🔍 Method: NeoWave + Smart Money Concepts (SMC)
📍Posted by: CryptoPilot
⸻
🧠 NeoWave Progression Update
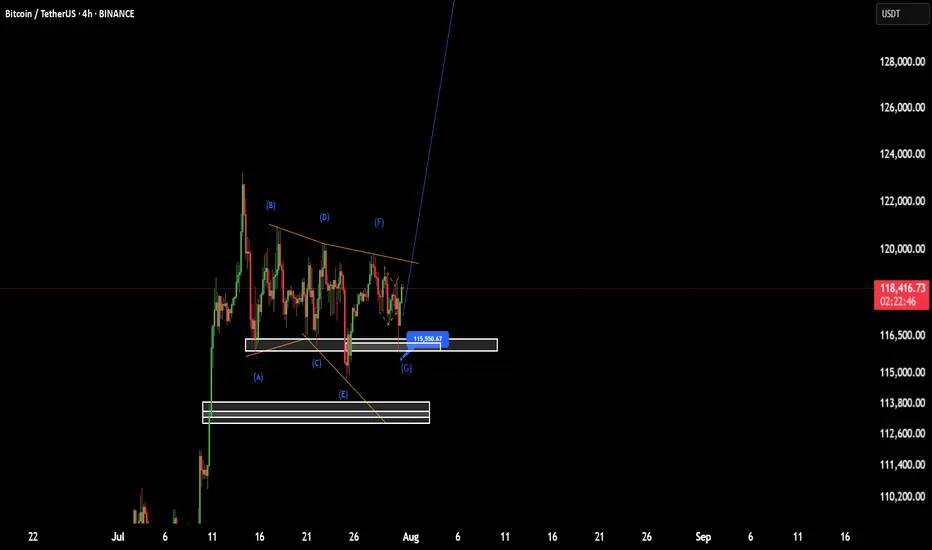
As outlined in our previous analysis, we are tracking a potential Contracting Diametric structure (A–G) originating from the March 2025 highs.
🚨 The G-Leg may now be actively unfolding.
Here’s what just happened:
• Price rejected sharply from the supply zone near 119,000–119,500, exactly where Wave F was expected to end.
• After a drop to 115,780 (minor trendline), price bounced, but failed to make a new high, stalling at 118,700, forming a lower high → classic signature of a developing G-Leg.
• This G-wave likely aims to break below Wave E low, seeking imbalance fills and structural resets.
⸻
📊 Smart Money Confluence (SMC / ICT)
• 🟥 Bearish Market Structure confirmed via MSS on 1H: Lower Highs + Internal BOS
• 🟨 Buy-side Liquidity above 120k was already swept
• 🔻 Price failed to reclaim OB block around 119.5k
• 🧩 FVGs remain open between 114.5k–113k, acting as magnet zones
• 📉 Expectation: Price may now break the ascending minor trendline and accelerate toward the major structure low
📌 Primary Scenario:
• Wave G of Diametric in motion
• Potential structure: Zigzag or Complex Combination
• Expectation: Bearish continuation to break below 113k
📌 Alternative Scenario:
• If price closes above 120.5k, diametric structure may be invalidated
• Watch for triangle/flat development instead
⸻
⚠️ Risk Management Note:
Price action near 118.7k–119.5k is crucial. Reclaiming that zone with strength changes the bias. Until then, sellers remain in control.
💬 Final Thought:
We’re tracking the final stages of a multi-month complex correction. The rejection at supply, combined with SMC signals and NeoWave symmetry, suggests sellers may push price into deeper demand zones soon.
⸻
📌 Follow CryptoPilot for advanced wave structure updates, market geometry insights, and ICT-style smart money traps.
💬 Share your views or alternate wave counts in the comments!

BTC(based on NEo wave)I think wave G is finished and soon it will pump to 138K.
stop loss is 115500.
attention:138K is the first target of these bullish waves.
Gold (XAUUSD) – H1 Wave 5 in Progress | Bearish Setup Building📉 Gold (XAUUSD) – H1 Wave 5 in Progress | Bearish Setup Building
🕐 Timeframe: H1
🔍 Strategy: Elliott Wave + Support/Resistance + AO Divergence
The market has likely initiated Wave 5 on the H1 timeframe following a clean 5-wave structure. We’re now watching for the internal corrective Wave 4 of Wave 5 to complete.
📌 Key Zone to Watch:
Fibonacci Level 2.618 lines up with a previous support-turned-resistance zone — a high-probability reversal area.
Awesome Oscillator (AO) shows convergence, signaling weakening bullish momentum.
🔧 Execution Plan:
Waiting for M15 break of structure to confirm the end of the corrective sub-wave.
Will look to enter sell on confirmation of bearish continuation.
🎯 Target Zone:
The shaded green area below marks a strong support zone — potential TP area for Wave 5 completion.

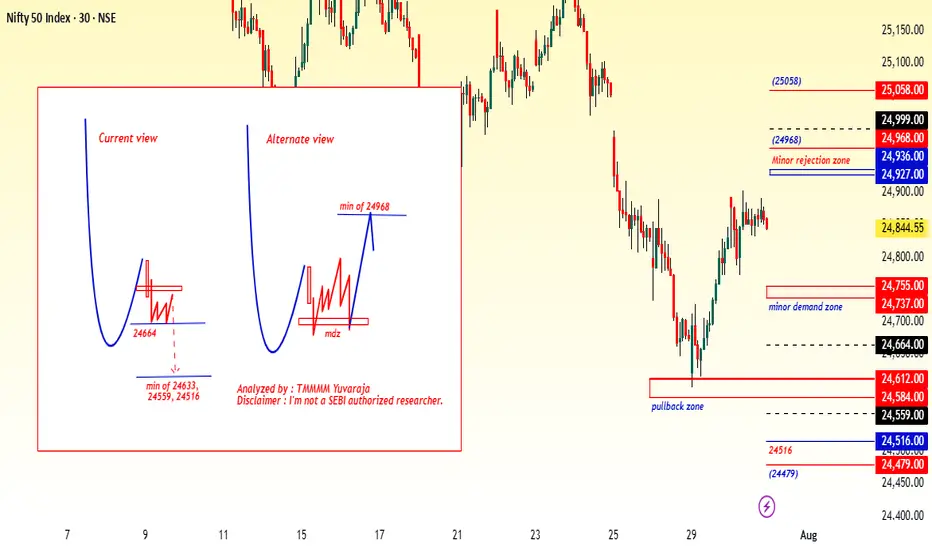
#Nifty directions and levels for July 31st:Good morning, friends! 🌞
Here are the market directions and levels for July 31st:
In the past two sessions, the global market (based on Dow Jones) has shown a moderately bearish sentiment,
while the local market continues to reflect a bearish tone.
Today, Gift Nifty indicates a gap-down opening of around 160 points (as per the chart).
What can we expect today?
In the previous session, both Nifty and Bank Nifty went through consolidation.
Structurally, we are still in a bearish tone, and with Gift Nifty indicating a gap-down start,
if the market breaks the immediate support levels with a solid candle, we can expect further correction.
On the other hand, if it finds support there, then the range-bound movement is likely to continue.
Which means, if the initial market takes a pullback, we can expect consolidation within the previous day’s range.
#Banknifty directions and levels for July 31st:
What can we expect today?
In the previous session, both Nifty and Bank Nifty went through consolidation.
Structurally, we are still in a bearish tone, and with Gift Nifty indicating a gap-down start,
if the market breaks the immediate support levels with a solid candle, we can expect further correction.
On the other hand, if it finds support there, then the range-bound movement is likely to continue.
Which means, if the initial market takes a pullback, we can expect consolidation within the previous day’s range.

BITCOIN → Correction within a downward channel. 112K or 125K?BINANCE:BTCUSDT is consolidating. However, a local downward trading range is forming relative to the current setup. What is the probability of a correction continuing to 112K or growth to 125K?
Daily structure: a local correctional channel within a global bullish trend. We have cascading resistance at 119.2, 119.6, 120, and 120.8. It will be quite difficult to break through this zone on the first attempt, but MM can use it to form traps and collect liquidity.
At the bottom, everything is simpler — a breakdown of the local bullish structure, the formation of an intermediate minimum, below which there is a void down to 112K.
Yesterday, relative to 115-116K, mm staged a massacre (trap) on both sides of the market.
Liquidity collection, return to the range, and growth. The reaction to the false breakdown of support is quite strong. Since the opening of the session, Bitcoin has been heading towards resistance, but there may not be enough potential to break through the upper resistance conglomerate, so I expect to see a pullback or decline to 116-115-114.
Resistance levels: 119.2, 120.1, 120.85
Support levels: 116.37, 115.67, 112
Technically and fundamentally, I do not see any drivers that could support the market (I am talking about Bitcoin, since the driver for altcoins is the decline in Bitcoin's dominance). It is possible that this may appear later. In the current situation, I am considering a false breakout and correction, as the market has not yet finished consolidating or correcting, and the current downward trading range may be extended.
PS: As the price moves towards resistance, it is necessary to monitor the reaction. The market itself will show what it is preparing for...
Best regards, R. Linda!

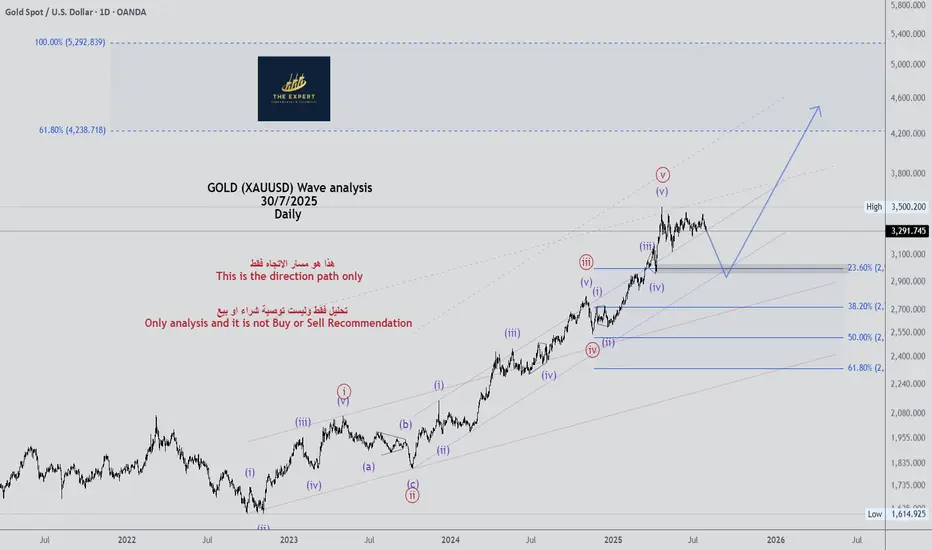
GOLD (XAUUSD) Wave analysis Daily - 30/7/2025GOLD (XAUUSD) Wave analysis Daily - 30/7/2025
see the chart
GOLD (XAUUSD) Wave analysis Weekly - 30/7/2025 (Scenario 2)GOLD (XAUUSD) Wave analysis Weekly - 30/7/2025 (Scenario 2)

GOLD (XAUUSD) Wave analysis Weekly - 30/7/2025 (Scenario 1)GOLD (XAUUSD) Wave analysis Weekly - 30/7/2025 (Scenario 1)

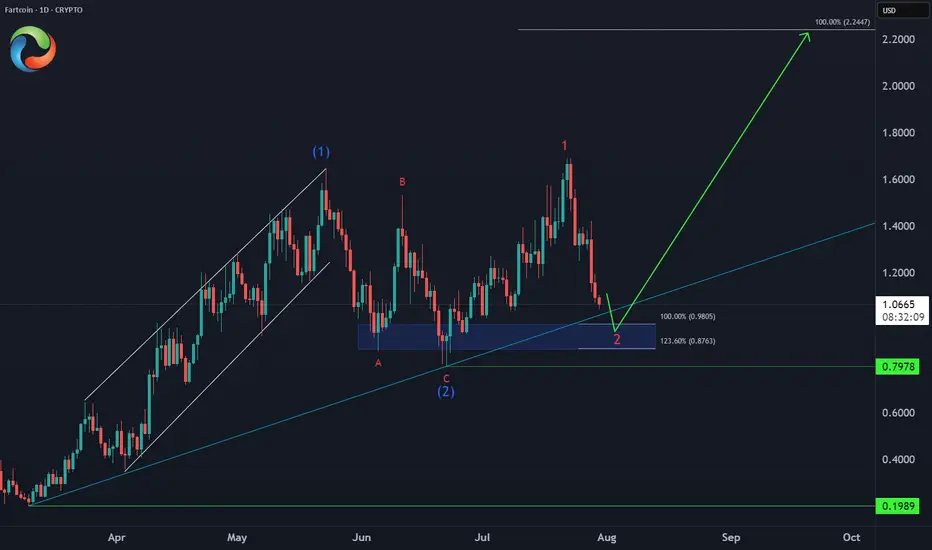
FARTCOIN Bullish Setup 📈 CRYPTO:FARTCOINUSD Entering an extreme buying area:
✅ Key support zone: $0.98-$0.87 (April trendline + equal legs)
⛔ Invalidation: $0.79
🎯 Target: $2.20 (124% upside)
This is how explosive meme setups look before liftoff.
GOLD (XAUUSD) Wave analysis Monthly - 30/7/2025 (Scenario 2)GOLD (XAUUSD) Wave analysis Monthly - 30/7/2025 (Scenario 2)

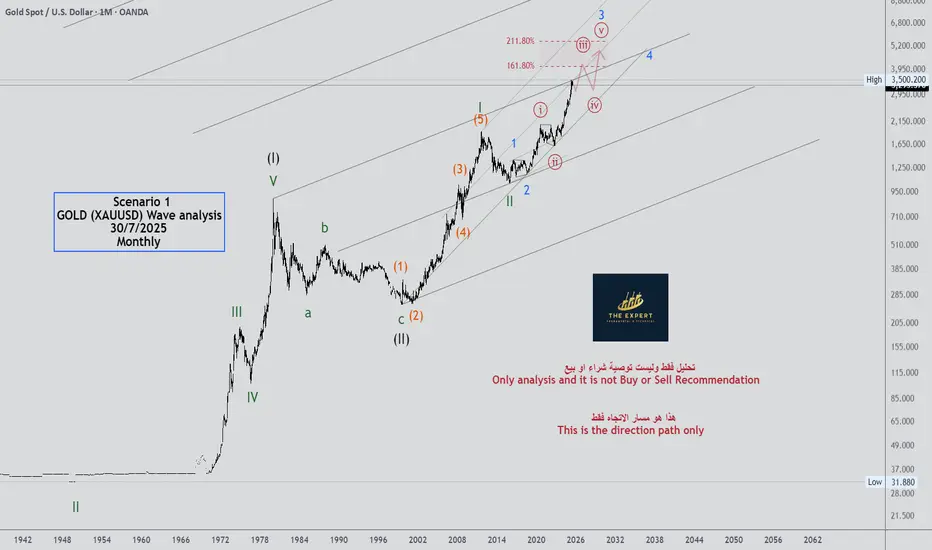
GOLD (XAUUSD) Wave analysis Monthly - 30/7/2025 (Scenario 1)GOLD (XAUUSD) Wave analysis Monthly Scenario 1 - 30/7/2025
ELLIOTT WAVE EURUSD Daily update
EW Trade Set Up daily
minute ((i)) seems finished
H4 scenario 210725:
the price upward movement from 1.1557 area on 17/07/25 has broken decisively 1.1684-1.1705 area but it had not the
strenght to go further so that the lagging span (green line) could break upward the leading span B (red line).
A decrescent high has been registered at 1.1800 area on 24/07/25.
In this new scenario it looks like that the impulsive movement that started from 1.0180 on 13/01/25
finisced at 1.1834 on 010725 in the minute wave (i). (EWO divergence, break down of the upward (ii)/(iv) channel).
So i have to register that a correction to minute wave ((ii) has started
key levels VP area
1.1800
1.1370 POC
1.0850
note :
monitor the price reaction at any supports level: VP area and LVN
