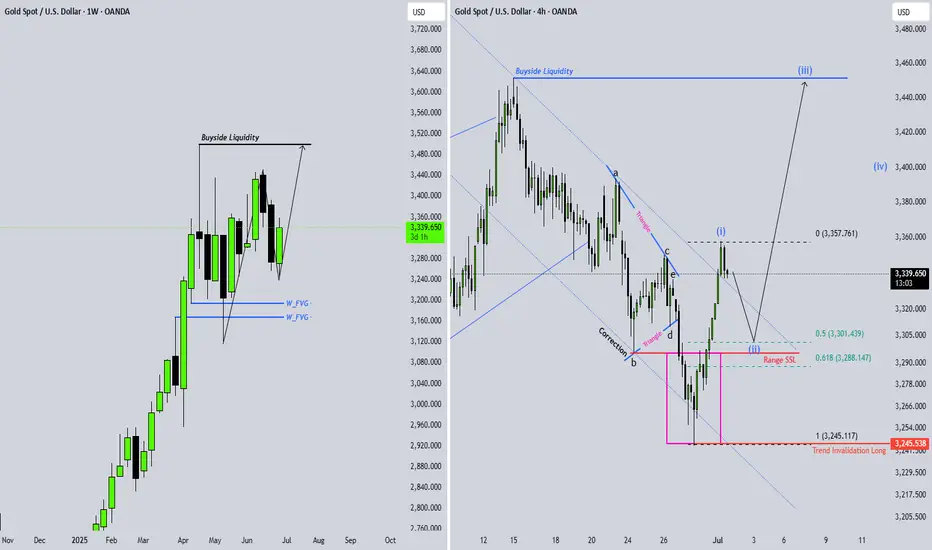
Gold Long: Stop loss at 3305, TP at 3426Over in this video, I did a quick revision on the cycle level Elliott Wave counts for Gold before delving down to the lower timeframes.
I discussed the alternate counts for Gold and explained how the latest 5-waves up made me retain what you see as the primary count. Essentially, what is important over here is that the stop loss is $3305 and the potential take profit is #3426.
Remember to keep your risk tight and good luck in your trading!
Elliott Wave

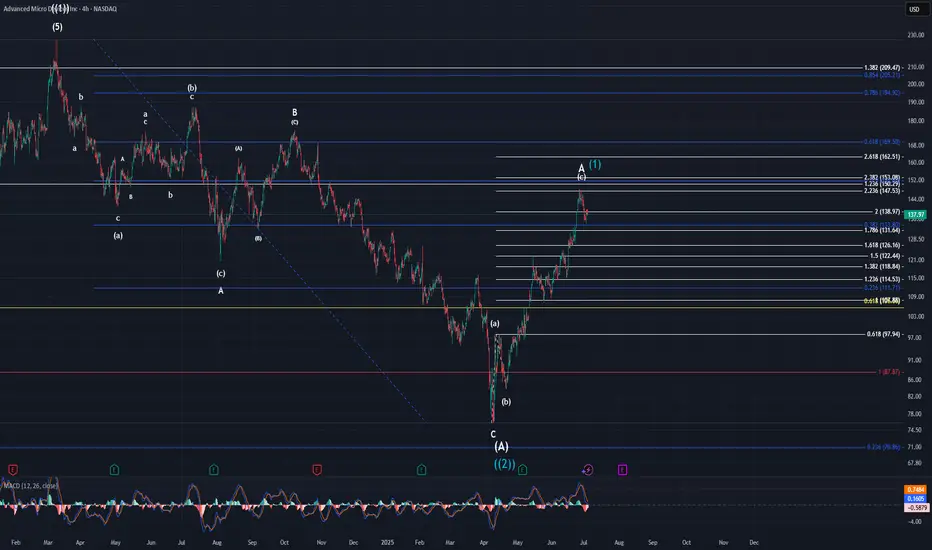
AMD UpdateAs I have mentioned, this move higher is either an extended minor A wave, or it is the beginning of another bull run. I side with the extended A wave due to not only the structure of the chart, but also the broader market as a whole. If this is the case, then price will likely drop to the $100-$110 area to complete minor B. Minor C would ideally take us back up to the $170-$190 area completing intermediate (B). I cannot say how long all of this will take us, but intermediate (A) took 13 months to complete. It would not be a stretch to say we still have 8-10+ months before (B) completes.
Let's just take this one step at a time though. That means we need to watch for price to take us to the low $100's for minor B next.
Gold BullishAfter exiting a correction, the first impulse (Wave 1) appears. I expect a retracement of at least 50% of the Fibonacci.
Apple UpdateThe way this pattern has been moving is very indicative of a B wave. It has been complex and very choppy. Needless to say, I have removed the lower target box from the chart and believe we should be headed to the upper larger target box from here. It appears, to my eyes, that price is within the micro-wave 3 of (c) of B. Once B completes, price should be headed to the $150-$110 area to complete minor wave C. This won't happen overnight but will take time. Be patient as these things can take a while.

#btc #btcusd #elliottwave short sell setup wave 4 7Jul25This count is based on my assumptions so anything can happen not a trading or financial advice just for educational purposes only kindly do your own ta thanks trade with care good luck.

COFFEE Setback targetGlobal picture on Coffee is exit from 20 years triangle. Locally i am anticipating setback into the marked zone because of ratio of the double zigzag on the minor degree.
After this i am anticipating grows resume to ~485

$NASDAQ:INSGNASDAQ:INSG
The stock moved in an impulse wave
Now in the fourth wave
A triangle is expected
We watch

#1150We're following the stock chart.
It's forming a triangle.
You can zoom out and see the rise in five impulse waves.
If it then declines in a corrective pattern, there will be a chance for the rise to continue.

Down for BitcoinHi traders,
Last week Bitcoin finished the correction down and went up again.
But this does not look like an impulse wave.
At the moment there's a small correction up so we could see another move down.
Let's see what the market does and react.
Trade idea: Wait for a change in orderflow to bearish and a correction up on a lower timeframe to trade shorts.
If you want to learn more about trading FVG's with wave analysis, please make sure to follow me.
This shared post is only my point of view on what could be the next move in this pair based on my analysis.
Don't be emotional, just trade your plan!
Eduwave

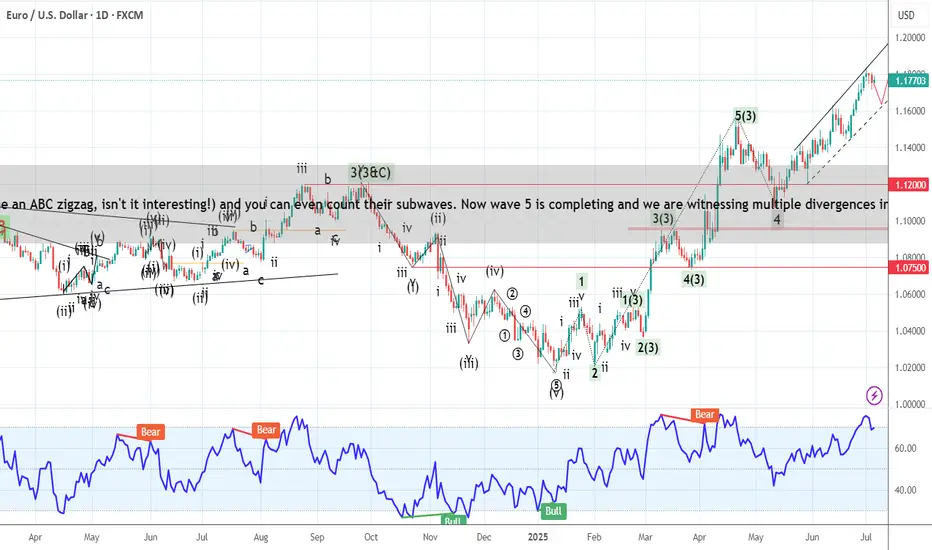
EUR USD Elliott Wave AnalysisHello friends
We are witnessing the formation of a complete Elliott wave pattern on the EURUSD chart. These waves from 1 to 5 are quite clear and you can even count their subwaves. Now wave 5 is completing . With the breakdown of the trend line drawn below and a pullback to it, we can expect the price to fall to the specified support. The first support is 1.12000and then 1.10000.
Good luck and be profitable.
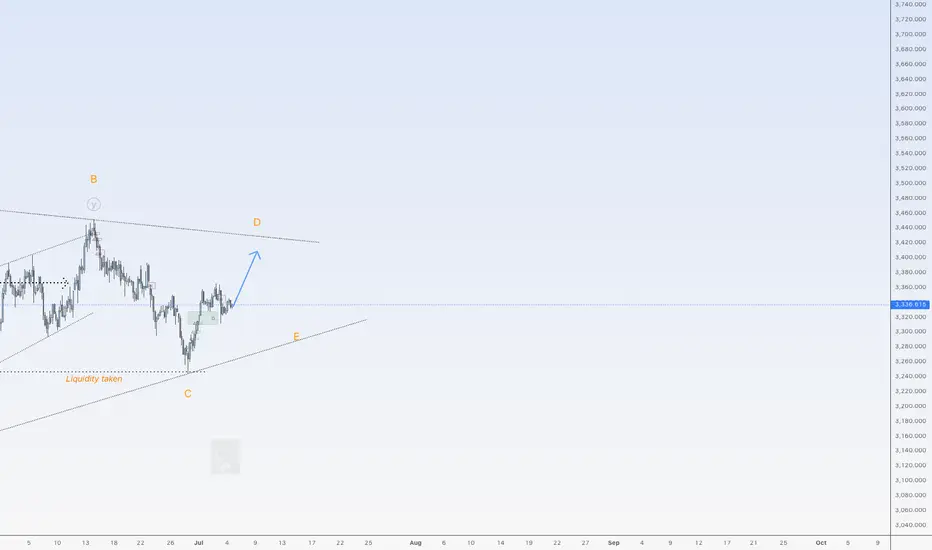
Little more upside for goldHi traders,
Last week gold swept the liquidity and went up again just as I said in my outlook.
The last wave down could be wave 2 or it's part of a big Triangle (orange C)/ Flat.
Next week we could see this pair go up again to finish (orange) Wave D. After that we could see another move down for Wave E.
Let's see what price does and react.
Trade idea: Wait for the bigger correction to complete.
If you want to learn more about trading FVG's & liquidity sweeps with wave analysis, please make sure to follow me.
This shared post is only my point of view on what could be the next move in this pair based on my technical analysis.
Don't be emotional, just trade your plan!
Eduwave
Little more upside for SPX500USDHi traders,
Last week SPX500USD went higher then expected (wavecount updated).
If this is correct, then next week we could see a little more upside for this pair.
Let's see what the market does and react.
Trade idea: Wait for price come into the Daily bullish FVG's to trade longs again. At the moment price is too high to trade.
If you want to learn more about trading FVG's & liquidity sweeps with Wave analysis, then please make sure to follow me.
This shared post is only my point of view on what could be the next move in this pair based on my technical analysis.
Don't be emotional, just trade your plan!
Eduwave

Bigger correction down for EUHi traders,
Last week EU came into the Weekly FVG and started a correction down from there.
Next week we could see another move down to finish the bigger correction.
Let's see what the market does and react.
Trade idea: Wait for the finish of the correction up and a change in orderflow to bearish on a lower time frame to trade shorts.
If you want to learn more about trading with FVG's, liquidity sweeps and Wave analysis, then make sure to follow me.
This shared post is only my point of view on what could be the next move in this pair based on my technical analysis.
Don't be emotional, just trade your plan!
Eduwave

XAUUSD Elliotwaves update: Is wave 4 complete?The view we had in past three weeks was a possibility of complex 4th wave and our short term bias was bearish. But price reacted and closed above 61.8 Fibonacci retracement level and therefore changed our bias to bullish(Technically 4th wave is complete). Another confluence was a clear 5 waves after the reaction on the 61.8 fib. Now two possibilities, either wave 2 is complete and we should expect price to continue up from current price level or a possibility of double 3 to push price down to atleast 61.8 Fib before continuation to the upside. To take advantage of this anticipated move a trader should either wait for price to drop to the golden zone or wait for price to breach the immediate high and retest.

CHILLGUY trading Idea🟢 Bullish Signs
📝 Coin $CHILLGUY
✅ Entry Points: At the current price of 0.05742, consolidation is within the range of 0.04879 - 0.0396
🔴 Stop Loss is at 0.02665
💹 Potential Targets: The first target is 0.1188, and if the currency enters with an impulse wave, the target will be 0.17648, reaching 0.26494.
📊 The profit-to-loss ratio is 9:1
📝 This idea was built on Elliott Wave analysis, especially after the rebound from 0.01780 and the support range between 0.04879 and 0.03960. This is an indication that a wave 4 has been formed, especially if the price action remains above 0.02665, Wave 1 Peak
❤️ Good luck to everyone - don't enter any currency before studying your risk tolerance.

Longterm S&P 500 Equal weight.The long-term Elliott Wave pattern appears to be approaching completion, and primary Wave 5 could be an ending diagonal.
This formation suggests a significant reversal down to the start of the E.D, which would be around the COVID low. This would be only be Wave A in a larger bearish pattern.

From BONK to Boom: Is This a Full Impulse?If you find this information inspiring/helpful, please consider a boost and follow! Any questions or comments, please leave a comment!
BONK: Watching the Impulse Unfold
Looks like BONK may have bottomed at 887, where it kicked off what appears to be an impulsive move up.
The retrace that followed was suspicious—plenty of ways to count it depending on your lens—but price action eventually started hinting at a 12-12 or zigzag-style crossroad. That indecision resolved quickly once BONK cleared 1511, shifting the structure firmly back into bullish territory.
Now trading around 2242, the behavior is aligning with what you'd expect from a wave 3: strong momentum, vertical lift, and minimal resistance. It’s moving like a third wave should.
That said, there’s some heavy resistance sitting overhead at 2506, and it could stall or even reject price short-term. If it does, the next thing I’ll be watching is how price reacts—specifically looking for a clean wave 4 pullback and a final push into wave 5.
If we see that 4–5 structure play out at multiple degrees, it would go a long way toward confirming this whole move as a completed impulse off the low.
For now, this one stays on watch for the next setup.
Trade Safe!
Trade Clarity!


SOLANA → Pre-breakdown consolidation may lead to distributionBINANCE:SOLUSDT is declining and testing the support of the trading range as Bitcoin pauses after strong growth and enters a correction phase...
SOL looks a bit weaker than Bitcoin technically, but SOLANA has some positive fundamentals, though that might not be enough.
After forming a false breakout of key daily resistance, Bitcoin is moving into a correction phase. An update of local lows on the chart could trigger a drop across the entire cryptocurrency market.
In SOL, the focus is on the two nearest levels of 148.75 and 145.64. A breakdown of support could trigger the distribution of accumulated energy within the specified range as part of a downward momentum.
Resistance levels: 148.75, 151.2, 153.88
Support levels: 145.64, 138.59
The ideal scenario would be a false breakout of 148.75 (liquidity capture) and a retest of 145.64, followed by a break of support. Consolidation below 145.65 could trigger a drop to the zone of interest at 138.59.
Best regards, R. Linda!

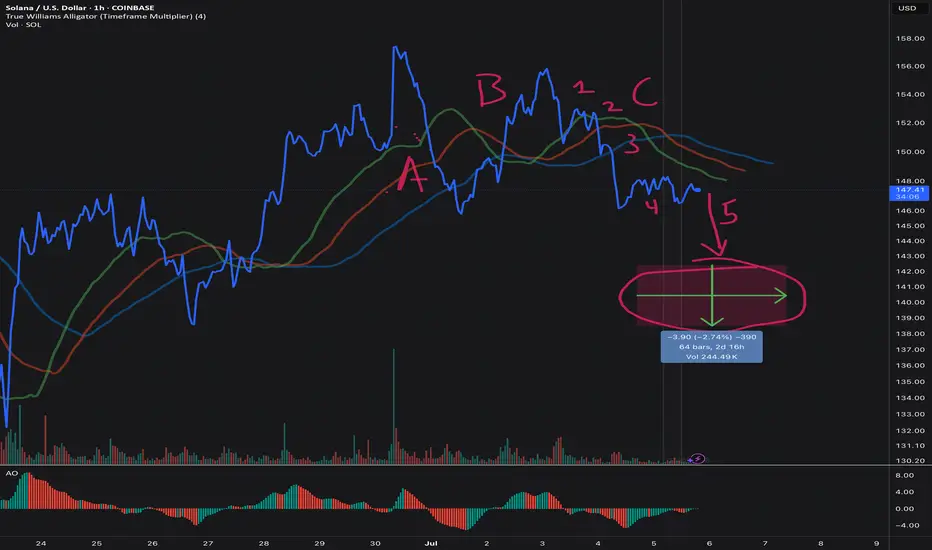
SOL Short Trading Setup: The Alligator Awakens!
Wave 4 wedge forming — watch for breakdown. Neely rules and Alligator indicator confirm setup.
SOL Trading Setup: The Alligator Awakens! 🐊
The Chart Breakdown
Looking at this SOL/USD hourly chart, we’ve got a textbook Elliott Wave setup using the Williams Alligator and Neely’s NeoWave rules .
The Wave Count Story
ABC : That larger three-wave rally? Done and dusted. ✅
1-2-3-4-(5) : We're now in a five-wave decline, currently sitting in wave 4.
Neely Rules Check ✔️
Price & Structure:
Wave 3 is not the shortest: travels farther than wave 1 and exceeds projected wave 5 → ✅
Alternation: Wave 2 was a sharp ABC; Wave 4 is a flattening wedge/triangle → textbook alternation ✅
No overlap: Wave 4 doesn’t enter wave 1 territory → clean as a whistle ✅
Equality guideline: The green box shows −2.74 %, mirroring wave 1 → picture-perfect ✅
Time Rules (Neely’s most overlooked):
Wave 4 has taken ~25 bars vs. wave 2’s ~15 bars → passes the time-ratio test ✅
Wave 5’s projected end falls within the vertical marker from wave 4’s high → on schedule ✅
Alligator & AO Confirmation 🐊
Alligator lines compressing during wave 4 → energy is building
AO divergence: red bars deepen in wave 3, shrink in wave 4 → classic wave 5 setup
The Trading Plan 🎯
Entry Strategy:
• Stop-limit sell just below wedge support (~$147)
Risk Management:
Stop Loss: One ATR above wave 4 high — protects against a throw-over
Time Stop: Exit at market if not in profit after 70 bars
Profit Targets:
TP-1: 100 % of wave 1 length (green arrow)
TP-2: Trail stop if AO shows bullish divergence near target zone
The Caveat ⚠️
If wave 4 drags on much longer (>2× its current length), it could evolve into a complex correction. Time is key — watch that clock.
Bottom Line
This setup checks all the NeoWave impulse boxes. The structure is clean. The Alligator is asleep. And we’re approaching a wedge break.
Short the break, target the equality zone, and respect your time stop.
Good traders follow rules. Great traders follow Neely rules. 😉
Agree or disagree? Drop a comment or share your chart!
HBAR in Wave C CorrectionThe token is correcting the whole move up which began in early 2023 (at 0.03560).
We are currently in wave C of the correction, so we could see bulls beginning to show up soon.
Price is grinding downwards inside the green descending channel. A breakout from the top of the channel could indicate the correction is over, with a lot of potential upside.

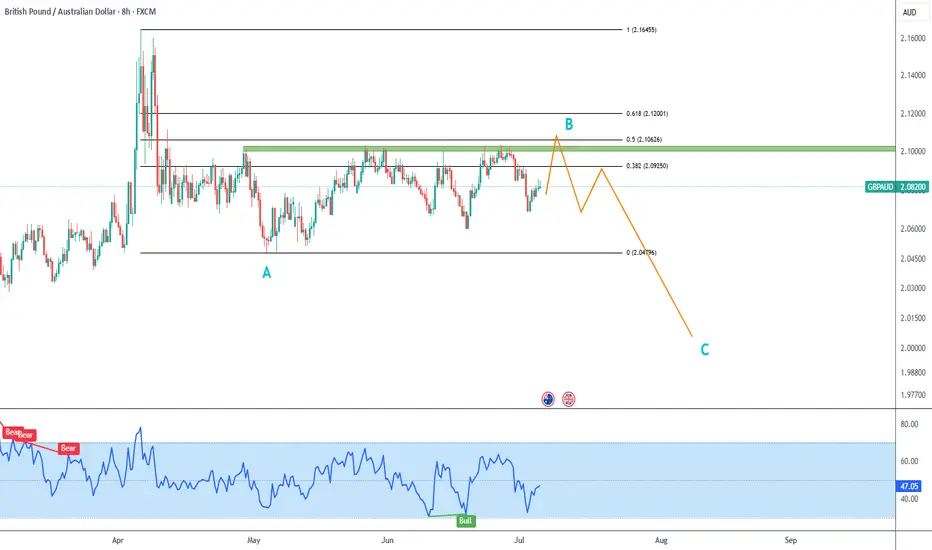
GBPAUD Trade Plan
I am considering we are currently inside blue B corrective wave, and expect further downside for blue C.
Wave B could be finished, but I´d prefer to see a liquidity sweep targeting 50% pullback, and dropping right back below the green resistance zone.
This would be a great place to enter a short trade.
AEDIFICA - Alternative Medium Timeframe Elliot Wave analysisIn this scenario, I’m interpreting the larger Wave 1 as a potential leading contracting diagonal, where each subwave is unfolding as a zigzag (3-3-3-3-3) rather than the typical 5-3-5-3-5 structure.Currently, we appear to be in Wave 4 (Pink) of this diagonal, which seems to be in the final stages of its downward leg before starting Wave 5 the final move of the pattern. The decline in Wave 4 (Pink) may take the form of either a WXY or an ABC correction; continued price development will help validate the count.
I believe this interpretation aligns well with the recent price action, particularly because the market has been moving sideways for quite some time now without delivering a convincing impulsive move to the upside.
Disclaimer: This analysis is for informational and educational purposes only and should not be considered financial or investment advice. All trading involves risk, and you should perform your own due diligence before making any trading decisions. The author is not responsible for any losses that may arise from reliance on this content. Always trade at your own risk. #AED
