USDJPY Short: On the Wave 3 Train RideOver in this video, I go through in detail the breakdown of the Elliott Waves and the rationale for counting the waves as I did. In this video, i talk about setting the stop at around 144.10 and the short-term take profit target at around 139.92.
At the end, I remind us of the big picture head-and-shoulders where the longer-term target is around 127.21.
Thank you and Good Luck in your Trading!
Elliott Wave

Quasimodo Pattern + Validator Support = Bullish Signal for ETHToday I want to analyze Ethereum ( BINANCE:ETHUSDT ) for you, many tokens are on the Ethereum network , and the increase or decrease of Ethereum directly affects most tokens.
So please stay with me.
Ethereum is trading in a Heavy Resistance zone($2,929_$2,652) near the Resistance lines and 200_SMA(Daily) . It is worth noting that Ethereum is preparing itself for a third attack on 200_SMA(Daily).
In terms of Price Action Analysis , Ethereum could start to rise with the help of the Bullish Quasimodo Pattern and break out of 200_SMA(Daily) and Resistance lines .
In terms of Elliott Wave theory , Ethereum appears to have completed a main wave 4 near Important Support lines . The structure of the main wave 4 is a Double Three Correction(WXY) . By breaking the 200_SMA(Daily) and Resistance lines , we can confirm the end of the main wave 4 .
The ETHBTC ( BINANCE:ETHBTC ) chart conditions are bullish , so it seems like investing in Ethereum could be better than Bitcoin . At least if the market falls , Ethereum is likely to be less likely to suffer a decline .
Note : Over 150,000 Ethereum validators, representing approximately 15% of the network, signaled support for increasing the gas limit from 36 million to 60 million units. This proposed change aims to enhance network capacity, reduce transaction fees, and improve scalability. While this development could positively impact ETH's price by making the network more efficient, it's essential to monitor potential technical risks and ensure that decentralization is maintained.
Note: If Ethereum touches $2,547 , we can expect further declines.
Please respect each other's ideas and express them politely if you agree or disagree.
Ethereum Analyze (ETHUSDT), 1-hour time frame.
Be sure to follow the updated ideas.
Do not forget to put a Stop loss for your positions (For every position you want to open).
Please follow your strategy and updates; this is just my Idea, and I will gladly see your ideas in this post.
Please do not forget the ✅' like '✅ button 🙏😊 & Share it with your friends; thanks, and Trade safe.

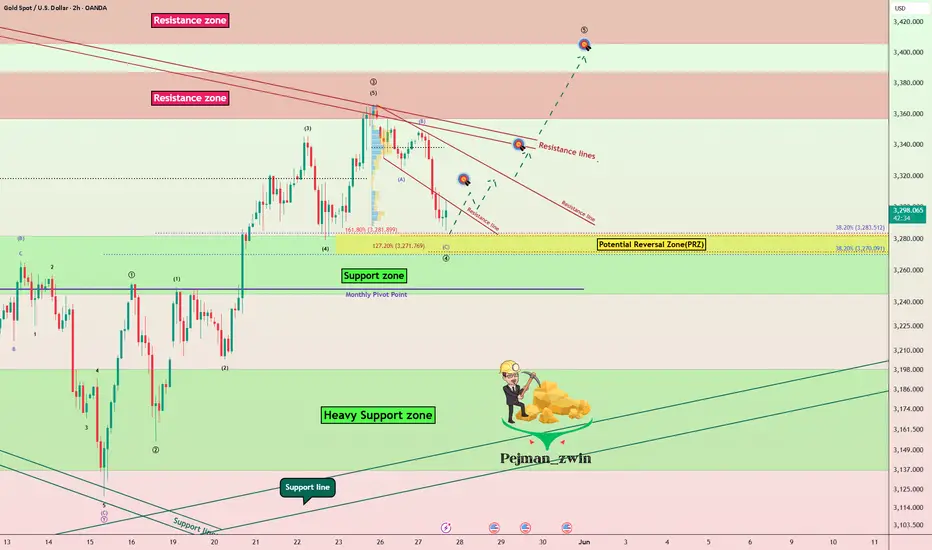
Gold Finds Support in PRZ – $3,337 in Sight? As I expected in my previous idea , Gold ( OANDA:XAUUSD ) moved towards the Support zone($3,280-$3,245) after breaking the lower line of the ascending channel.
Gold is moving near the Support zone($3,280-$3,245) , Potential Reversal Zone(PRZ) and Monthly Pivot Point .
In terms of Elliott Wave theory , Gold appears to be completing a main wave 4 . The structure of the main wave 4 can be complex . Confirmation of the end of the main wave 4 requires a break of the Resistance lines and Resistance zone($3,387-$3,357) .
I expect Gold to move up after entering the Potential Reversal Zone(PRZ) and the first target could be $3,314 and the second target could be $3,337 . If the momentum is high for Gold, you can consider higher targets for Gold to increase .
Note: If Gold touches $3,245 , we should expect further declines.
Gold Analyze ( XAUUSD ), 2-hour time frame.
Be sure to follow the updated ideas.
Do not forget to put a Stop loss for your positions (For every position you want to open).
Please follow your strategy; this is just my idea, and I will gladly see your ideas in this post.
Please do not forget the ✅' like '✅ button 🙏😊 & Share it with your friends; thanks, and Trade safe.
The Crypto Total Market Cap Excluding Top 50#TOTALE50
This index tracks the performance of mid and low-cap altcoins.
It shows a promising bullish setup on the LTF that could evolve into a major rally. Holding $42.83B is essential, with $75.82B as key level. Passing the ATH at $127.64B is the trigger for a major altseason.

BTC/USD next wave started. So this is my planBitcoin started the rally, and I'm expecting a bullish rally till 106700 range. Expecting a pull back. And re-entering again at the tip. Holding it till 107500

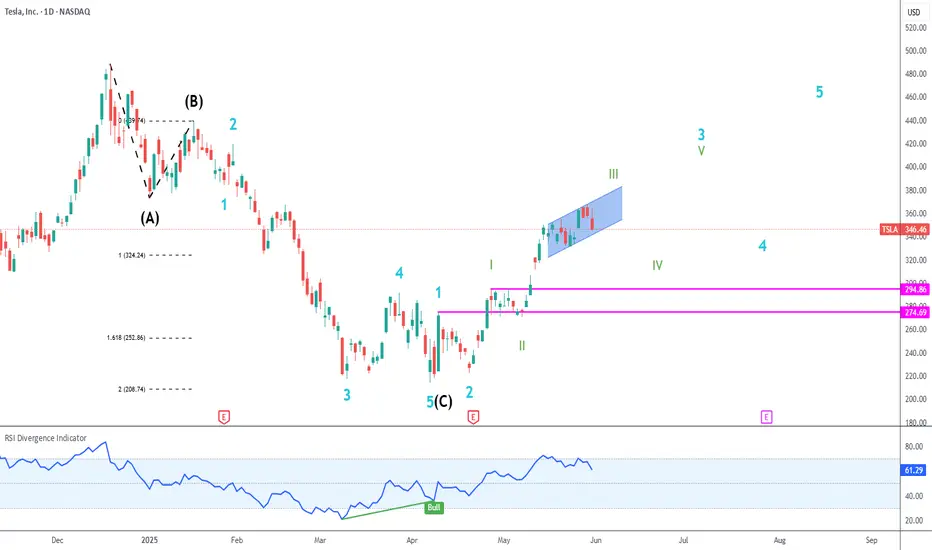
TSLA UptrendTesla has regained an uptrend in a motive wave.
In my primary count, we are currently close to finishing green III of blue 3.
Pullbacks into support zones are buying opportunities.
ALGO Potential ReversalAlgorand has broken the black descending channel and gave us bullish RSI divergence on the April low.
I expect a new leg to the upside to test gray resistance just above 0.3000.
Invalidation is at 0.1460.

PIXELUSDTThe outcome of this analysis is that based on the structure of a zero - D wave, which may be a pig or triangle, or even a pig, we should look for the optimal areas to buy Spot …
In the event that this analysis is correct, it may be ideal to purchase Spot in the vicinity of Beijing to the tribes.
A cautious target for the Chinese outbreak and a more risky target could be a dollar casualty.
In time terms too, mid - June and more accurately the beginning of the third week of June would be the ideal approximate time for the start of the DC wave …
As indicated in the chart late July and early September are important times in the chart that will probably work depending on the structure and my guess is that the mentioned times are the ideal time for the end of the larger D - wave …

BTC Elliott wave analysis 5/23/2025For me , I think that the BTC price is on the way to their target price around 128,000-133,000 that we derive from Gann fann resistance.The wave structure suggest us that the impulse that create new high is just the beginning. The invalidate point is the point below wave 2 (around 101,000).

Link Analysis (12H)Chainlink (LINK) Technical Outlook – Elliott Wave Perspective
After applying Elliott Wave Theory, the chart appears to speak for itself — the downward corrective phase seems to have concluded.
Zooming into lower timeframes, there are several bullish signs suggesting that LINK is primed for an upward move.
Key Technical Reasons Supporting Upside Potential:
Bullish Flag Formation: A clear flag pattern has formed in lower time frames, and LINK is currently testing its resistance level.
Elliott Wave Count: Based on wave structure, Wave 3 appears to be nearing completion. Should we see a short-term pullback, it would likely be Wave 4, offering a strong buy opportunity around the support zone of the flag.
Fib Confluence: The potential retracement aligns perfectly with the 50% Fibonacci level — a typical target area for Wave 4 corrections.
Two Possible Scenarios:
Immediate Breakout: With support from Bitcoin’s continued momentum, LINK could extend its current Wave 3 and break out from the flag without any significant pullback.
Healthy Correction: Alternatively, LINK could retrace to the 50% Fib level before initiating the final leg of Wave 5 — providing a textbook buying opportunity.
Target:
In both scenarios, the upside target remains the same: $18.00 to $18.40 range.
— Thanks for reading.

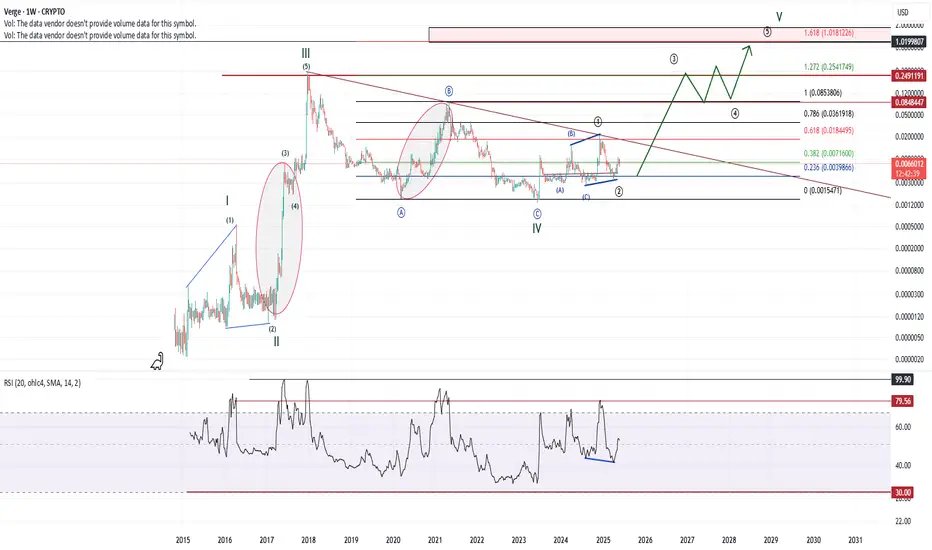
XVGUSDAnalysis of the XVG movement. We will move in a 3-wave impulse. We target 1.272 Fibonacci, then 1.618 Fibonacci.
TSLA (Daily) Elliot Wave 3 UnderwayTSLA appears to still be printing a motif wave 3 after finding a bottom at the $208 high volume support node. Fib extension targets suggest we have much higher to go including a new all time high.
Upside resistance target sits just below $413 in the HVN.
Downside targets may test the previous swing high $284
Safe trading

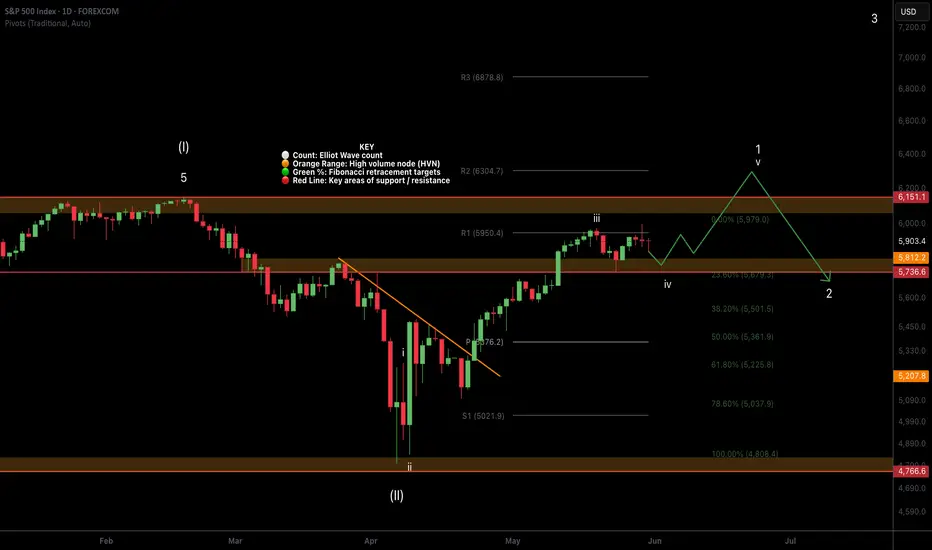
SPX500 (Daily) Elliot wave 4 underwaySPX appears to be printing a wave 4, potentially a triangle giving the proximity to the all the time high. Triangles are a motif wave ending pattern with a thrust up afterwards, typically a poke above the previous all time high before retracing trapping retail with FOMO.
Wave 2 is expected to retrace to the bottom of the triangle / wave 4 currently the high volume node support and .236 Fibonacci retracement at $5680
Safe trading
ETH (Daily) Holding up significantly wellETH is holding up its motif wave 1 rally significantly appearing to have completed an ending diagonal for wave 5 after finding a bottom at the major support high volume node (HVN).
Wave 2 is expected to retrace to the S1 pivot, 61.8 Fibonacci retracement and HVN at $1930 but may be front run at the daily pivot and wave 4 bottom $2300.
Safe trading

BTC (Daily) Elliot Wave 2 UnderwayBTC appears to have completed a motif wave (1) poking above all time high after printing a triangle for wave 4. Triangles are an ending pattern with a final thrust up afterwards typically breaking all time highs before reversing in wave 2, selling into retail FOMO.
Wave 2 has a $92k target at 0.5 Fibonacci retracement and high volume support node.
Wave 3 should be a powerful move up taking price way into all time high.
Safe trading

XRP (Daily) Complex Correction WXYXZXRP appears to have a complex correction underway with a series of ABCs in a descending channel after reaching all time high.
Price is just above the 61.8 Fibonacci retracement and high volume support node which is likely to test at $1.95.
Analysis is invalidated if price breaks above wave X swing high.
Ultimately it is trapped in a large range.
Safe trading

SUI (Daily) Elliot wave ii underwaySUI appears to have completed a motif wave (1) with an ending diagonal after finding a bottom at the major support high volume node (HVN) macro wave 4.
Wave 2 has not retraced as deep as other alt coins showing strength in the move up. The downside target is the HVN it has just tested at the 0.382 Fibonacci Retracement $2.95.
Wave 3 should be a powerful move up taking price into all time high.
Failure to hold this support could see price heading back to fresh lows and testing the $1.6 HVN once more.
Safe trading

Fet (Daily) Elliot Wave ii underway after ending diagonalFetch appears to have completed a motif wave (1) with an ending diagonal after finding a bottom at the major support high volume node (HVN) macro wave 4.
Wave 2 has not retraced as deep as other alt coins showing strength in the move up. The downside target is just above the wave (1) swing high, the 0.618 Fibonacci Retracement.
Wave 3 should be a powerful move up taking price into all time high.
Failure to hold this support could see price heading back to fresh lows and testing the $0.35 HVN once more.
Safe trading

SOL Local Elliot Wave ii UnderwaySolana appears to have completed a motif wave 1 after finding a bottom at the major support high volume node (HVN) macro wave 4.
Wave 2 has not retraced as deep as other alt coins showing strength in the move up. The downside target is the HVN at $140 at the 0.5 Fibonacci Retracement.
Wave 3 should be a powerful move up taking price into all time high.
Failure to hold this support could see price heading back to fresh lows and testing the $90 HVN once more.
Safe trading

ONDO (Daily) Elliot Wave ii UnderwayONDO appears to have completed a leading diagonal for wave 1 after finding a bottom at the major support high volume node (HVN).
Wave 2 has retraced to the expected alt coin Golden Pocket at the 78.6% retracement tapping high volume node.
The descending resistance line has been tested as support leaving a dragonfly doji but does not look strong enough to be the bottom yet.
Wave 3 should be a powerful move up.
This analysis is invalidated below macro wave 2 -$0.65
Safe trading

HBAR (Local) Elliot Wave ii UnderwayHBAR appears to have completed a leading diagonal for wave 1 after finding a bottom at the major support high volume node (HVN).
Wave 2 has retraced the expected 61.8% Fibonacci but alt coins have their own Golden Pocket at the 78.6% retracement which aligns with the S1 pivot and high volume node.
The descending resistance line has been tested as support leaving a doji but does not look strong enough to be the bottom yet.
Wave 3 should be a powerful move up.
This analysis is invalidated below macro wave 4 -$0.12556
Safe trading

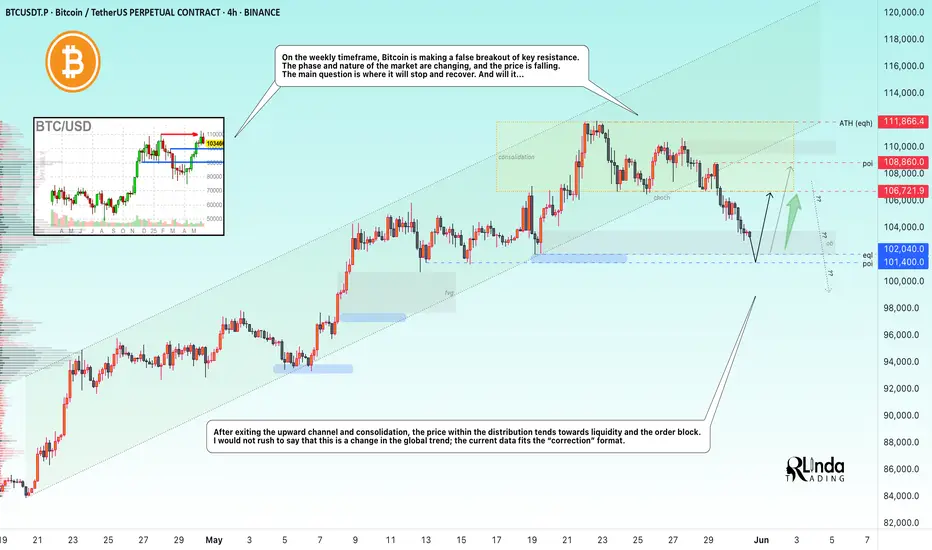
BITCOIN → Correction or trend reversal? Why is 101K important?BINANCE:BTCUSDT.P is exiting the upward channel after a false breakout of the key resistance level of 110K (previous ATH). Liquidation?
Quite an interesting situation with James Wynn. As they say, money loves silence, especially when it comes to a highly manipulated market... A week after the whale's actions, Trump decided to play the market again by creating emotional swings: he announced tariffs on the EU, canceled them, then made claims against China and is now ready to reintroduce tariffs on the EU. Things didn't end well with James... Liquidation before the rally?
On the weekly timeframe, Bitcoin is making a false breakout of the key resistance level of 110K. The phase and nature of the market are changing, the price is falling, breaking the structural support of 106500. The main question is where the stop and recovery will be. And will there be one...
After exiting consolidation and the upward channel, the price within the distribution is moving towards liquidity and the order block. I would not rush to say that this is a change in the global trend; the current data fits the “correction” format.
Support levels: 102000, 101400
Resistance levels: 106700, 108800
102-100K is a fairly important zone for the market; a breakout in this area could open the way to a (local) bottom. Bulls may not be able to hold the market, in which case a global sell-off could form. Therefore, I believe that retesting the 102000 level will end with a liquidity grab and a correction along the trend, during which the price may test the 106K - 108K level, which will determine the future of the market: consolidation, growth, or decline...
Best regards, R. Linda!
Crypto Total Market Cap Excluding Top 100The Crypto Total Market Cap Excluding Top 100 tracks mid and low-cap coins, currently valued at $12.5B. Despite the HTF corrections since 2021, it has been in a bullish trend since early 2019.
Key bullish continuation and invalidation levels are outlined on the chart.
