Gold Breakout and Potential RetraceHey Traders, in today's trading session we are monitoring XAUUSD for a buying opportunity around 3,330 zone, Gold was trading an a downtrend and successfully managed to break it out. Currently is in a correction phase in which it is approaching the retrace area at 3,330 support and resistance zone.
Trade safe, Joe.
Elliott Wave

USDJPY Potential DownsidesHey Traders, in today's trading session we are monitoring USDJPY for a selling opportunity around 143.200 zone, USDJPY is trading in a downtrend and currently is in a correction phase in which it is approaching the trend at 143.200 support and resistance area.
Trade safe, Joe.

USDJPY Short: Update to wave counts and stop lossThis is a follow-up to my USDJPY short earlier. In the previous video, I mentioned that USDJPY can retrace up to start of wave 1 (144.41) but propose a tighter stop. You would have been stopped out if you had used that stop. But right now, you will be able to enter the short at a better price and set a proper stop that will invalidate the EW count.

ImmunityBio, Inc (Wave Analysis) WeeklyImmunityBio, Inc (Wave Analysis) Weekly
We are in downtrend E wave in Triangle wave.
See the Chart.
Regards,

GOLD → Correction to liquidity before growthFX:XAUUSD is in the realization phase after exiting the “symmetrical triangle” consolidation. The price is supported by the trend and a complex fundamental background.
Gold is retreating from its peak, remaining below risk support. The price of gold is falling moderately from $3,392, awaiting data on JOLTS job openings in the US.
Gold is supported by trade and geopolitical risks: Trump doubled tariffs on metals, increasing pressure on the dollar. The conflict with China has escalated due to allegations of violations of agreements.
Focus on US employment: Strong data could support the dollar and limit gold's gains, but the technical picture remains bullish.
Resistance levels: 3365, 3391, 3409
Support levels: 3345, 3323
Against the backdrop of a rising dollar, gold may test deeper liquidity zones, such as 3345 and 3330. However, if trading forms between 3365 and 3345, followed by a retest of resistance and consolidation above 3365, this could trigger an early rise to 3391-3409.
Best regards, R. Linda!

AAVEUSDT → A false breakdown provokes a change of characterBINANCE:AAVEUSDT.P maintains a bullish market structure. The coin is consolidating, with bulls trying to hold their ground above the key support line.
Against the backdrop of a correction, the price is testing liquidity, with a false breakdown of support provoking a change in character to bullish within the local timeframe. Bulls are trying to maintain the bullish structure.
The price is breaking through the resistance of local consolidation, forming a change in character, but before growth, the market may close the gestalt in the form of an order block or liquidity located in the 249.5 zone.
Support levels: 249.11, 240.0
Resistance levels: 274.27, 280.47
Technically, the coin looks quite good and promising overall. If the bulls hold their ground in the 249-250 zone, then in the short to medium term, we could see good movement with the possibility of new highs...
Best regards, R. Linda!

USDollar Is Making An Intraday Pullback Within DowntrendGood morning traders! Stocks keep pushing higher along with yields, so it looks like 10Y US Notes could still see lower support levels, and that’s why USdollar is in a bigger intraday correction. What we want to say is that while the 10Y US Notes are still searching for support, the DXY can stay in recovery mode or at least sideways. In the meantime, stocks can easily see even higher levels after NVIDIA surpassed earnings.
Looking at the intraday USDollar Index – DXY chart, we see a leading diagonal formation, so we are tracking now an intraday abc correction before a bearish continuation, thus keep an eye on GAP from May 18 around 101 level that can be filled and may act as a resistance before a bearish continuation.

GBPJPY 1H Analysis – Bullish Breakout from Ending Diagonal + AO Pair: GBP/JPY
Timeframe: 1H
Structure: Wave 5 Ending Diagonal + Bullish Divergence on AO
Hi traders! Here’s an update on GBPJPY from the 1H chart.
After a strong bearish move, price formed a falling wedge (ending diagonal) pattern, indicating exhaustion in the downtrend. This pattern completed with a final Wave 5 that showed significant weakness — and here’s the key signal:
🔍 Bullish Divergence Spotted
While price made a new lower low (Wave 5), the Awesome Oscillator (AO) printed a higher low. This classic bullish divergence hints that bearish momentum is fading and a potential reversal is in play.
📈 Breakout Confirmation
Price has now broken above the wedge and the 1.0 Fibonacci level (~193.67), confirming the breakout and early bullish momentum. We’re currently seeing price pushing up with strong momentum candles.
🎯 Potential Targets Based on Fibonacci Extensions:
• 1.618 – 194.60 (first resistance / TP1)
• 2.618 – 195.35 (TP2)
• 4.236 – 196.45 (extended TP3 if trend continues)
🛑 Key Support:
• 193.00 zone – ideally price should stay above this level to maintain bullish bias.
🧠 Summary:
• Falling wedge (ending diagonal) completed as Wave 5
• AO bullish divergence signals weakening sell pressure
• Breakout confirmed above 193.70
• Watching for continuation toward 194.60 and 195.30+
📌 I’ll be watching for a potential pullback above 193.70 for a high-probability reentry opportunity. Always manage your risk and trade what you see.
Let me know your thoughts in the comments below! 📥
#GBPJPY #ForexAnalysis #PriceAction #ElliottWave #AO #Breakout #Fibonacci #TechnicalAnalysis #Wave5

My Thoughts #013The pair is still quite bullish...
I would look for sells
if we get to the supply zone and get a choch I would sell then for now I just think it will push up to the supply zone before we get that drop.
As you can see it's the buy before the sell that Choch so that is why I think it will mitigate the Zone before dropping...
Yet I am not. Saying it might not sell from the point it's at but it's just my perspective
Use Proper risk management
Let's do the most

AUDCAD BullishAfter a bearish pullback, the market undergoes a structural change and launches its first impulse. This could be the start of an uptrend on H4.

ADA is going to catch big targetsWe are currently experiencing a Wave 2 correction after completing an impulsive Wave 1. Once the ABC correction is complete, we can expect to enter an impulsive Wave 3. As time goes on, if it seems like we are entering Sub-Wave 1 of Wave 3, I will publish an idea to outline new targets. For now, we should anticipate new movements in the market.

CAPITALA to add or enter after 0.94using gann fann, it seems that it is currently at upper border
price currently retraced at 23.6% an uncommon level
for this stock, i will wait and see

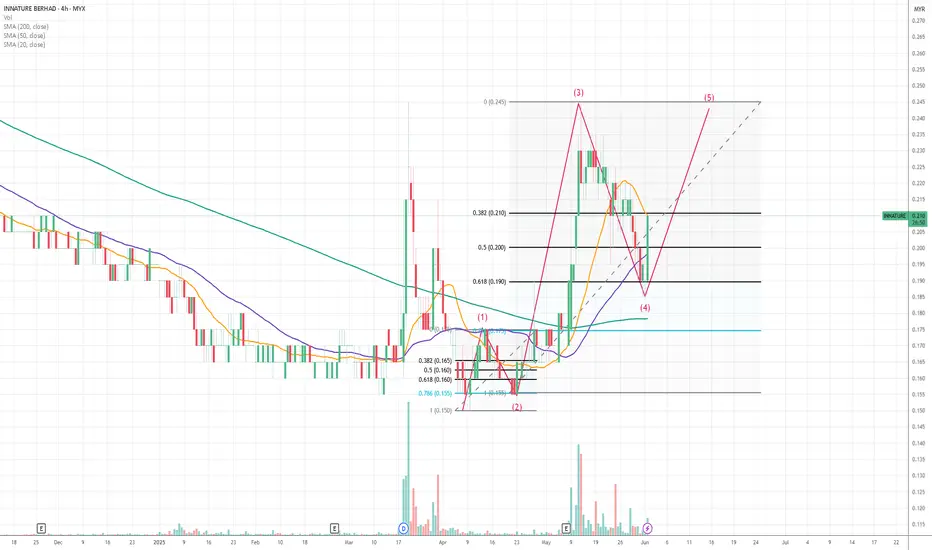
INNATURE creating 5th wave2nd wave retraced at 78.6% while
4th wave retraced to 61.8%
now forming the 5th wave that can be either same or truncated or maybe elongated (extended)
XAUUSD_10M_BuyAnas Gold Analysis
Elliott Wave Analysis Style
Short-term Time Frame and Scalping
Position Type from Buy to Sell
Main and Important Support Level $3355
Given the completion of 5 downwaves and the formation of the corner pattern, by maintaining the main support and breaking the pattern upwards, it can enter the upwave and move towards $3376 and $3382
If the announced resistance is crossed, the rise towards $3404 and $3414 will continue.


Rising from the Ashes: CUMMINS INDIA's Grand Wave 5 Launch?After a soul-sucking 11-month correction that chewed through every classic pattern — flats, triangles, zigzags, combos — CUMMINS INDIA may finally be ready for lift-off.
A WXYXZ correction has reached its climax in a clear Wave 4 low near ₹2580, completing the complex structure inside a descending channel.
But the game changed when price:
Broke the 200 SMA
Blasted through the channel
Punched RSI above 70 for the first time since May 2024
And did it with volume breakout
Now, all eyes are on Wave 5 — projected to aim for:
1.0 extension: ₹3569
1.618 extension: ₹3812
Can we reach a new ATH above ₹4171? It’s possible — if this unfolds through nested 1-2-3s, we may be witnessing the start of a larger degree rally.
Invalidation : Below ₹2706. If it breaks, the count may need a rework .
For now? Wait until it retraces to launchpad.?
Disclaimer: This analysis is for educational purposes only and does not constitute investment advice. Please do your own research (DYOR) before making any trading decisions.

Diametric Pattern near completion?Anticipating a big Upside move after completing g-wave of the Diametric pattern.

XYZ - Looking good here for some long trade
Target 1 - 68
Target 2 - 74
Target 3 - 80
Target 4 - 92
But the path won't be a straight line as you know.
Stop loss - 50

USDJPY Short: Wave 3 of 3 of 3Update to the EW counts for USDJPY. It is still a short but stop can now be adjusted to 143.70.

Gold Long: Wave 5 of 3Over in this video, I updated the Elliott Wave Counts for Gold Long. If I'm not wrong, we have finished wave 4, although the ideal entry is at 3344.
The Stop loss is 3354 if you entered now, and 3328 if you enter at 3344 (watch video for explanation).
The most important price target is 3438 which was the high on 7th May 2025 and 78.6% of wave 1 of a higher degree (watch video for explanation), although it is not the ultimate price target.
Good luck!

BSE Ltd – Completion of a 5-Wave ImpulseBSE Ltd appears to have completed a five-wave impulsive advance following a prior flat correction. Wave 5 has reached the 1.618 Fibonacci extension of Wave 1 and touched the upper boundary of a well-defined ascending channel — suggesting a potential short-term top.
If a correction unfolds from here, it may take the form of a zigzag or a flat. Key Fibonacci retracement levels to watch:
Target 1: 2,159 – 0.382 retracement
Target 2: 1,981 – 0.5 retracement
Target 3: 1,803 – 0.618 retracement
The invalidation level for this setup is around 2,736.20 . A sustained move above this would indicate that the uptrend may still be in progress.
Price action in the coming sessions will be key to confirming the next direction.
Disclaimer: This analysis is for educational purposes only and does not constitute investment advice. Please do your own research (DYOR) before making any trading decisions.

GBPJPY Potential UpsidesHey Traders, in the coming week we are monitoring GBPJPY for a buying opportunity around 193.300 zone, GBPJPY is trading in an uptrend and currently is in a correction phase in which it is approaching the trend at 193.300 support and resistance area.
Trade safe, Joe.
