BITCOIN → Correction. The hunt for liquidity...BINANCE:BTCUSDT.P is recovering after liquidity was captured in the 100K zone. Locally, the technical situation is controversial despite the global bullish trend
Bitcoin is changing its market character (106700) and breaking the bullish structure (103000) during a correction phase. As part of the downward momentum, the movement is testing liquidity below the 100700 support level. As for the liquidation, there are several reasons: the conflict between Trump and Musk, strangely enough, the market reacted with a fall; the liquidation of whales, history repeats itself...
Traders are buying back Bitcoin, but technically the market has a bearish structure. Locally, there is a bearish trend, and a countertrend correction, “liquidity hunting,” is forming.
Ahead lies a fairly important zone of 105900-106700. The initial retest may end in a false breakout, as there may not be enough potential for continued growth (after a strong buyback).
Resistance levels: 105,900, 106,720, 110,400
Support levels: 103000, 101400, 100K
After a correction from 105900, which could target half (0.5) of the trading range, the market may attempt to return to a bullish phase, provided that the bulls keep the price from falling and do not allow it to update local lows. That is, in the short term, I expect a decline from 105900 to 103000, but further, if the price starts to return to 105500-105900, there may be chances for growth to 110K
Best regards, R. Linda!
Elliott Wave

Bigger correction for EUHi traders,
Last week EU did not make an impulse wave 3 but instead it slowly went up. And after the ECB rate decision on Thursday it started to drop.
At the moment the pattern is not very clear.
This could be a bigger correction down for wave 4 (black) so my main bias is to the downside.
Let's see what the market does and react.
Trade idea: Wait for the finish of a small correction up to trade shorts.
If you want to learn more about trading with FVG's, liquidity sweeps and Wave analysis, then make sure to follow me.
This shared post is only my point of view on what could be the next move in this pair based on my technical analysis.
Don't be emotional, just trade your plan!
Eduwave

JINDAL STAINLESS Breaks the Channel – What’s Next?After completing a long WXY correction, Jindal Stainless has flipped into a strong uptrend. The price broke above the downtrend channel and also reclaimed the 200-day moving average — confirming strength.
The rally from 504 has unfolded as a nested 1-2, 1-2 impulse, and the wave 5 has now entered its 1 to 1.618 projection zone. We’re likely entering a blue Wave 4 pullback, especially as:
RSI shows bearish divergence
The rally looks stretched short-term
A healthy retracement toward the 661–640 zone can follow.
As long as 633.35 holds, this bullish structure remains intact.
Trend : Bullish
Retracement zone : 661.80 – 640.65
Invalidation : Below 633.35
This is a dynamic setup. Chart will be updated as price action unfolds
Disclaimer: This analysis is for educational purposes only and does not constitute investment advice. Please do your own research (DYOR) before making any trading decisions.

Peak of BitcoinI think the Peak of Bitcoin is near.
I see a chance risk ratio of 1 to 2.
New Longpositions make no any sense.

Bearish Structure Still in Control, But a Twist is PossibleALKEM continues to respect its larger downward channel, forming what looks like a classic W-X-Y corrective structure.
Wave W unfolded as a zigzag .
Wave X developed as a contracting triangle , ending near ₹5400.
The current drop appears to be the start of Wave Y , possibly forming another zigzag.
As long as price stays below ₹5460 (the 0.5 retracement of the entire W-Y structure), the bearish setup remains valid.
The RSI breakdown below 40 adds strength to the bearish bias. The projected Wave Y could extend toward the ₹3450 zone if symmetry with Wave W plays out.
Alternate Bullish Scenario :
While bearish remains the primary view, there's a low-probability bullish alternate :
If the move from the February lows to ₹5400 was actually a leading diagonal, then the current fall could be a Wave 2 correction. A sharp reversal from above ₹4491 might trigger a bullish breakout toward new highs.
Chart will be updated as price action evolves.
Disclaimer: This analysis is for educational purposes only and does not constitute investment advice. Please do your own research (DYOR) before making any trading decisions.


GOLD → Intra-range strategy. Waiting for NFPFX:XAUUSD remains consolidated in the 3340-3391 range. The price is stuck in the middle of the range due to the uncertainty created by upcoming unemployment news...
On Friday, gold rose slightly, remaining within the range ahead of important US employment data (NFP), which could set the direction for the market. Optimism over the US-China deal and profit-taking on the dollar are supporting the USD, holding back gold's rise. A weak NFP (less than 100,000) will reinforce expectations of a Fed rate cut and support gold. A strong report (above 200,000) will have the opposite effect. The probability of a rate cut in September is 54%.
Technically, on the daily timeframe, the market structure is bullish. After a sharp breakout of resistance and a new high, the price is consolidating above the upward trend line, forming a plateau in the 3300-3340 zone. Another shakeout from support is possible before the trend resumes
Resistance levels: 3375, 3391, 3414
Support levels: 3339, 3331
Forming a price forecast ahead of news, especially ahead of NFP, is a thankless task. Therefore, it is advisable to wait for the news and monitor the price reaction. A retest of the consolidation boundary and a rebound are possible. There is a chance that the price will remain in consolidation until next week, but again, it all depends on the fundamental background...
Best regards, R. Linda!

USDCAD → One step away from distributionFX:USDCAD is recovering amid the dollar's growth. Unemployment news is ahead. A return of the price to the buying zone may support the currency pair.
Against the backdrop of the dollar's growth, a change in the market phase is forming (unconfirmed). The price has stopped updating lows and is forming an eql, from which it is breaking out of the downtrend. The initial retest of liquidity at 1.366 may end in a correction. However, a quick retest and consolidation of the price above the level will confirm the change in sentiment
Resistance levels: 1.3686, 1.3732
Support levels: 1.3675, 1.366
Despite the fact that the price broke the downward resistance, the currency pair is still under pressure from sellers who are waiting for the price to fall from 1.3686. A breakout, a change in market sentiment to bullish, and consolidation above 1.3675-1.3686 will confirm readiness for a recovery. Zones of interest: eqh 1.3732
Best regards, R. Linda!

Digital Turbine inc. Future of the Stock impressive, where it Target level = 47.57$
Cup and Handle at the Bottom in progress of formation 👌
1st Target price = 47 $ - 48 $
A Motive powerful wave in the way, and I expected a Massive positive News in the way any moment
Highly recommended for Buying & Accumulation.

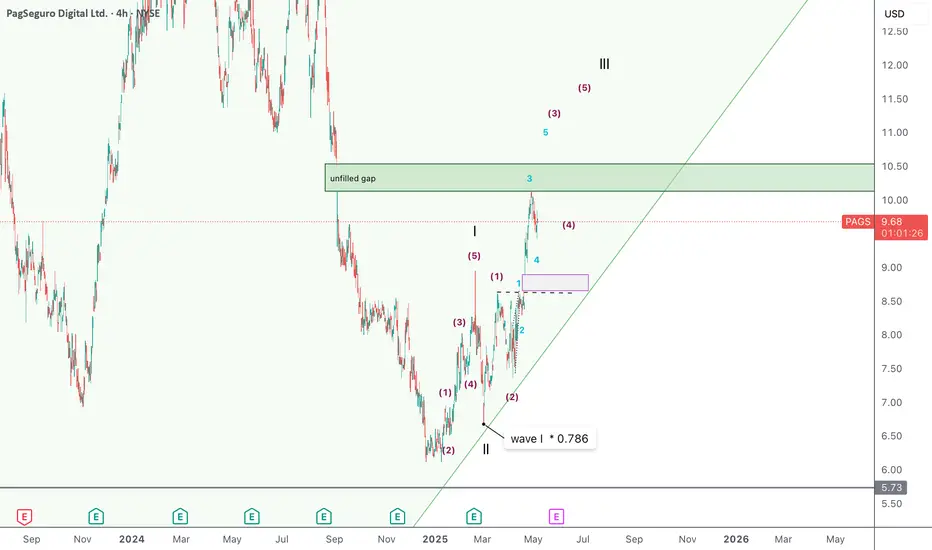
Long at least until wave III completes I expect wave III to complete at around 11-11.5.
Waves count started as rising impulsive waves started to shape off the long all-time channel bottom edge.
TEM - what do you see ?I love this stock, so much momentum and good follow through.
I see it's ready for a strong rally. I've huge position via shares and Aug calls

Bitcoin's Structure Breaks — PRZ May Trigger a BounceBitcoin ( BINANCE:BTCUSDT ) has finally continued its downward trend , as I expected in my previous idea .
Do you think this downward trend will continue or not?
Bitcoin has now managed to break the Support zone($104,180-$103,670) and the lower line of the Ascending Broadening Wedge Pattern .
In terms of Elliott Wave theory , Bitcoin appears to be completing microwave C of the main wave Y of the Double Three Correction(WXY) .
I expect Bitcoin to continue to decline to the Support zone($102,000-$107,120) and the Potential Reversal Zone(PRZ) and then start to rise again.
I choose to label this idea as ''Long''.
Note: If Bitcoin falls below $100,200, we should expect further declines.
Please respect each other's ideas and express them politely if you agree or disagree.
Bitcoin Analyze (BTCUSDT), 1-hour time frame.
Be sure to follow the updated ideas.
Do not forget to put a Stop loss for your positions (For every position you want to open).
Please follow your strategy and updates; this is just my Idea, and I will gladly see your ideas in this post.
Please do not forget the ✅' like '✅ button 🙏😊 & Share it with your friends; thanks, and Trade safe.

AUDJPY Begins Elliot Correction After Wave 5 Impulse EndsOANDA:AUDJPY seems to have started a Elliot Correction Wave after the Impulsive Elliot Wave came to a finish once Wave 5 ended this morning @ 93.774.
Now after an Impulsive Wave ends, its theory that a Correction comes next and with Price having Retraced to the Golden Ratio creating a Lower High, this is the beginning signs of that theory in the works!
The Sequence will be confirmed once Price Breaks below Point A @ 93.248 where then we should suspect Price to find itself back down into the 92 range where the Correction Wave should come to an end.
RSI is trading back below 50 confirming Price has room to move lower strengthening the Bearish Bias.

2️⃣ Who's Next? Or: Operation: "Saving Private Saylor2️⃣ Who's Next? Or: Operation: "Saving Private Saylor"
❗️ Disclaimer: This idea is only a part of an article with a forecast for Bitcoin and the cryptocurrency market for 2025-2028. To fully and completely understand what is being discussed here, please refer to the root idea via the link:
1️⃣ Main Idea: Analysis of US Treasury Documents
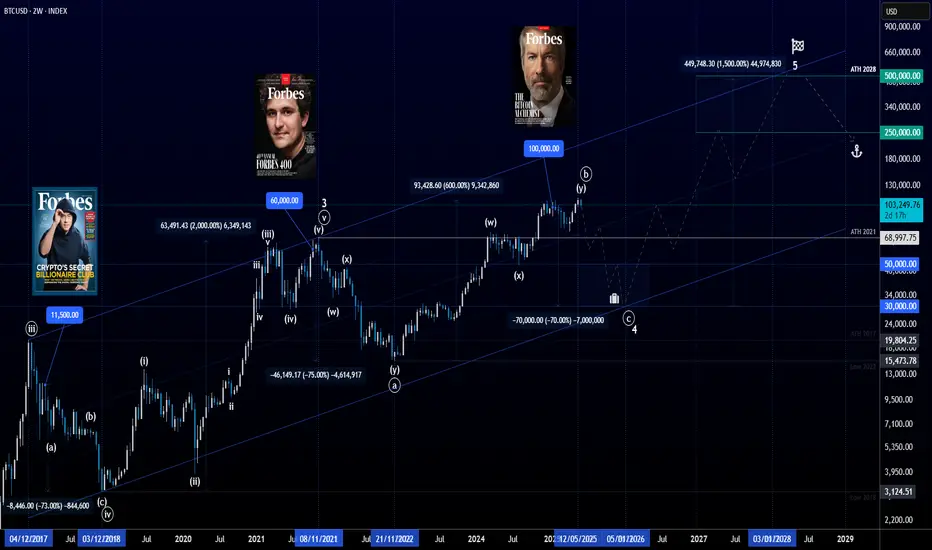
📰 Forbes: Your Cover – Our Margin Call. Saylor, Get Ready!
You've heard it, haven't you? Those stories about Forbes covers and the subsequent fall of crypto empires? It's no longer a superstition; it's, damn it, statistics:
Changpeng Zhao (CZ), Forbes, February 2018: "Binance's Crypto King!" – the headlines screamed. And what then? He served four months in prison. Well, not immediately, of course, but the "seed" of the curse was sown.
Sam Bankman-Fried (SBF), Forbes, October 2021: "The New Warren Buffett of Crypto!" – the fanfares shrieked. And what was the result? He's sitting pretty now, enjoying prison romance.
And now, our incomparable Michael Saylor enters the stage! Forbes puts him on the cover in January 2025 "Michael Saylor: The Bitcoin Alchemist"!
Why a Forbes cover is not glory but a warning for Michael Saylor (and a signal for the US government): This is not just a coincidence; it's a systemic pattern. Forbes, whether out of naivety or, conversely, subtle calculation, acts as an unwitting harbinger. They choose those who are at the peak of hype, those who have "believed in themselves" and are ready to tell the whole world about their "brilliant" strategy. And the peak of hype, as we know, is the beginning of a fall. And this is where it gets interesting. The US government, which carefully reads such magazines (after all, they write about "financial stability" and "national interests" there), sees Michael Saylor on the cover and thinks: 💭 "Well, well, this guy has accumulated half a million Bitcoins. And he's currently at the peak of self-admiration. Excellent! Get ready for 'Operation: Coercion to Stability'!"
❌ Why this cover for Saylor is not just a photoshoot, but a "liquidation marker" for the US government:
"The Forbes Curse" as a "Market Overheat" Indicator: For our financial strategists from the Treasury and the Fed, Saylor's appearance on the cover is not just a signal of "overheating"; it's a green light for activating the "Crypto-Reserve" plan. They see: "Oh, this guy got too relaxed. He has too much 'digital gold' at an average price of $74,000. And we love to buy at a discount, especially if the discount can be 'arranged'!"
Recession and Crash as "Natural Selection": Remember that TBAC in its documents constantly reminds us of Bitcoin's "volatility" and the "necessity of hedging." The perfect storm for Saylor is an "unexpected" recession in the US and a sharp stock market crash. At this moment, Bitcoin, which has always historically behaved as a "high-beta" asset (DA&TM, p. 5), will fall even faster. When BTC is in the range of $30,000 - $40,000, this will not just be a "loss" for Micro Strategy – it will be absolute financial hell for their leveraged positions, which they so "cleverly" accumulated.
Margin Calls: Music to Regulators' Ears: Saylor's average purchase price of $74,000, and Bitcoin has fallen to $30-40k? This is not just "oh, we're in the red" . These are massive margin calls and the threat of liquidation of MarginCallStrategy MicroStrategy's positions, which mortgaged its shares and Bitcoin itself to buy even more Bitcoin. The banks holding them as collateral (and which are, of course, "friendly" with the Fed) will start to get nervous. And then, as if by magic, the "saving hand" of the government will appear.
"Humanitarian Aid" (at a Bitcoin price of $30-40k.): They won't come waving checkbooks to buy Bitcoin for $100,000. They will come when Saylor is on the verge of collapse, and they will say: 💬 "Michael, we see your pain. To avoid 'systemic risk' and 'protect investors' (who are in your fund because you bought so much Bitcoin), we are ready to 'help'. We will 'acquire' your Bitcoin at a 'fair' price (which, of course, will be significantly lower than Saylor's purchase price) to 'stabilize' the situation. Naturally, this is not a purchase, but 'crisis prevention'."
Bitcoin in the "Crypto-Reserve": Mission Accomplished! Thus, the government, without directly buying a "speculative asset," will receive half a million BTC at a "bargain" price, using market crashes and financial pressure. And then they will be able to proudly declare: "We have 'digital gold' that will protect our financial system from external shocks. And yes, it is now in our hands, not some 'Alchemist's'."
✖️ The Forbes Curse: When a Magazine Becomes a Catapult for Crypto-Kings
The cover of Forbes magazine is not just paper and ink; it's the financial equivalent of an "X" on your back, appearing exactly when "Big Brother" decides you've gotten too big for your "digital gold" britches. Let's recall the chronicles of this "curse" to understand what awaits our Michael Saylor:
1. CZ (Changpeng Zhao), Binance:
▫️ Forbes Cover: Feb. 2018. Headlines trumpeted "crypto-king."
▫️ BTC Price: $11,500. The entire crypto-brotherhood rejoiced, thinking the moon-run was endless.
▫️ What happened next: By the end of 2018, Bitcoin plummeted to $3,000. A -73% drop. And Changpeng, after several years of legal battles, eventually ended up behind bars for 4 months.
2. SBF (Sam Bankman-Fried), FTX:
▫️ Forbes Cover: Oct. 2021. "The Billionaire Saving the Crypto World!" indeed.
▫️ BTC Price at the time: Around $60,000. The market was at its peak; everyone was talking about $100k, "diamond hands," and a "new financial era."
▫️ What happened next: A year later, by the end of 2022, Bitcoin was already around $16,000. A -75% drop. And Sam? Sam is enjoying government cuisine and the company of cellmates, sentenced to 25 years (but according to recent data, the term may be reduced by 4 years).
3. Michael Saylor, Micro Strategy:
▫️ Forbes Cover: Jan. 2025. Our "Alchemist" Michael, with brilliance and faith in his eyes, has concocted somewhere around half a million bitcoins and has finally received this "honor."
▫️ BTC Price: As of today, around $100k. Imagine the hype! Saylor tells everyone that "we've only just begun," that Bitcoin is "financial sovereignty" and "the future of humanity," whose price is about to fly to $500k without you! Buy now, don't miss out!
▫️ What will happen next (according to the "Big Brother" scenario): If history is not just a collection of boring dates, but a cyclical performance with notes of tragicomedy, then the following awaits us. A year after the Forbes cover, by early 2026, the price of Bitcoin in this scenario could plummet by -70% from its ATH. This means Bitcoin would be in the range of $30-40k. dollars. And what about Michael? I don't want to jinx it, but if CZ served four months, Sam will likely serve 4 years, then how long will our BTC-prophet and "crypto-Moses" get? Forty?
In conclusion: The Forbes curse is not magic; it's a harbinger of a systemic blow. So, when you see another crypto-hero on the cover of Forbes, don't rush to rejoice for him. Most likely, it's the last call before the "system" begins its complex, multi-step plan for "coercion to cooperation."
So, let's dream. No, not about flights to Mars, but about much more down-to-earth, but far more probable scenarios, where Washington finally gets its hands on "digital gold." After all, as stated in DA&TM, Bitcoin is "a store of value, aka 'digital gold' in the decentralized world of DeFi" . Well, since it's "gold," it should be in our "gold reserve," right? But to buy it directly? Oh no, that's a "speculative asset," it's "volatile" ! But "acquiring" it at a discount – that's a whole different song.
📝 The "Digital Couping" Scenario (or how to take Bitcoin without buying it on the open market):
◻️ Phase 1: Deflation of the US Stock Market Bubble
▫️ "Recession? Stock market crash? Perfect time for 'healing'!" The government and banksters will always find a way to "help" the market. If the American economy, as many are whispering now, faces a serious recession, and the stock market tumbles, then Bitcoin, as a "high-beta" asset, may well follow suit. Remember how Bitcoin reacted to "crashes" in 2017, 2021, 2022 (DA&TM, p. 5, chart). If Michael Saylor's average purchase price is $74,000 today, then a drop into the $30,000 - $50,000 range is not just a "correction"; it will be an absolute financial hell for his margin positions, which he so "cleverly" accumulated.
▫️ Margin-call for Micro Strategy. Michael Saylor didn't just buy Bitcoin; he bought it with borrowed funds, collateralizing his shares and even Bitcoin itself. In the event of a deep market downturn and, consequently, a fall in BTC's price, Micro Strategy will face serious problems servicing its debt and maintaining collateral. The banks that issued them loans (and these are, most likely, banks very "friendly" to the government) will start to get nervous. And then the most interesting part will begin.
◻️ Phase 2: "Operation: Buyout"
▫️ "An offer you can't refuse." When Micro Strategy is on the verge of default or bankruptcy due to its Bitcoin positions, "saviors" will appear on the scene – perhaps some specially created "Digital Asset Stability Fund" or even directly "government-friendly" large financial institutions that have received a "green light" and, possibly, even funding from the Fed (naturally "to ensure financial stability").
▫️ "We are not buying; we are 'stabilizing'!" They won't say: "We are buying Bitcoin." They will say: 💬 "We are preventing systemic risk! We are providing liquidity to the market during a crisis, buying back their 'high-beta' asset at a 'fair' price (which, of course, will be significantly lower than Saylor's purchase price)." And this is where the "digital gold" narrative, which has already permeated even official documents (DA&TM, p. 2), will come into play. "It's gold, and gold should be in the state reserve, shouldn't it? "
◻️ Phase 3: Nationalization of 'Digital Gold' and control over the narrative
▫️ "Congratulations, Michael, you've become a 'pioneer'!" After most of Saylor's Bitcoins are "saved," they will end up in the hands of, say, a "special depository" or a "strategic digital asset reserve." At the same time, the government will not "own" them in the traditional sense, but will "manage" them for "national interests."
▫️ "Now we have 'digital gold,' and it will work for us!" With this significant reserve of Bitcoins (576k "taken" from Saylor + 200k "confiscated" Bitcoins earlier – that's no joke), the US government suddenly becomes the largest sovereign holder of an asset that they will now officially recognize as "digital gold." This will allow them to:
▫️ Influence the market: If necessary, they will be able to use this "crypto-reserve" to "stabilize" prices, intervening in the market (for example, by selling small portions to curb too much growth, or conversely, by buying if the market falls sharply, but through their affiliated structures).
▫️ Legitimize "digital gold": If the US government has a Bitcoin reserve, then it's no longer "speculative nonsense," but part of the official financial system. This will open doors for broader institutional adoption, but on their terms.
▫️ Pump capitalization through stablecoins for national debt: A crucial strategic step will be to use this new "digital gold standard" to address the growing national debt. By aggressively legitimizing Bitcoin as "digital gold" and creating controlled mechanisms for its storage and trading (e.g., through regulated ETFs and tokenized assets), the US government will create a powerful incentive for capital inflow. In parallel, by strengthening regulation and encouraging the growth of fiat-backed stablecoins, collateralized by short-term US Treasury bonds (T-Bills), a colossal "cushion" of demand for US national debt will be created. The larger the capitalization of stablecoins, the greater the need for T-Bills to back them. The goal is to first build up a large BTC reserve, then, by boosting stablecoin capitalization, inflate the overall crypto market capitalization and the price of Bitcoin itself, to ultimately create a new powerful tool for "monetizing" or, at least, facilitating the servicing of US national debt. This will look like a brilliant financial maneuver, turning "wild" cryptocurrency into a tool for strengthening US financial stability and national security.
◽️ A rescue that looks like a robbery. So the scenario is not that the US government will "pump" Bitcoin by buying it expensively; the scenario is that they will create conditions and wait for the market to "drown" the most ambitious hodlers, and then come to the rescue to "save" their assets. And this "help" will look like the acquisition of a strategic asset at a bargain price, using existing market pressure mechanisms and crisis phenomena. This is a classic "good cop, bad cop" game, where the "bad cop" is an "unexpected" market recession, and the "good cop" is the government that "saves" assets to then use them for its geopolitical and financial interests. And all this under the guise of "financial stability" and "national security," of course. After all, who better than the government can manage your "digital gold"? Of course, no one!
❗️ Disclaimer: This idea is only a part of an article with a forecast for Bitcoin and the cryptocurrency market for 2025-2028. To learn more, refer to the root idea via the link:
1️⃣ Main Idea: Analysis of US Treasury Documents
Reversal?Five waves may have been completed. BTC is bouncing off support while holding the 100k. Let's go!

Bitcoin - Secret pattern no one talks about, drop below 100k!The price of Bitcoin is currently in a downtrend. We can see that the price is inside this secret descending channel that really no one talks about. As long as we are in this channel, Bitcoin remains bearish, and we can expect a huge drop in the short term! So what is the plan?
Currently I recommend entering a short position and taking profit at around the bottom of the previous symmetrical triangle. Do not forget that triangles always act like a magnet for whales! Usually the price wants to take liquidity above and below triangles, so be careful. There is an extremely high chance of sweeping liquidity below this symmetrical triangle. Triangles are also printed by the market maker to engage retail traders in trading.
The whole crypto market, especially Bitcoin, is manipulated by banks and huge institutions. They control the price and all movements on the charts, so you want to learn techniques on how to spot whale movements and where retail traders have their orders to become a successful trader! This can take a few years of education.
From the Elliott Wave perspective, it looks like we are ready for another leg down after the bears break the local red trendline. At this point, I marked it as a complex correction, but there are multiple scenarios on what could happen in the near future.
Currently I am bearish on Bitcoin and expect prices below 100,000. Always use technical analysis to confirm your bias.
Write a comment with your altcoin + hit the like button, and I will make an analysis for you in response. Trading is not hard if you have a good coach! This is not a trade setup, as there is no stop-loss or profit target. I share my trades privately. Thank you, and I wish you successful trades!

Bitcoin Short: Video Walkthrough on 4th and 5th waveOver in this video, I explained the bitcoin short by explaining the wave 4 structure and how I set the stop losses and take profit target using resistance level and previous waves and Fibonacci extension levels.
I also talk about how I will trade this setup by scaling in.

Gold Short: Wave C of 2Gold has completed a 5-wave structure. This big structure should be a wave 1 of cycle wave 5. Now we should be on wave B and going into Wave C of Wave 2 of cycle Wave 5.

EURGBP Potential H&SI´m following a potential reversal for EURGBP as a Head and Shoulders pattern.
Neckline break at 0.845 would take us to the next strong resistance level at 0.853.
Bullish RSI divergence is supportive of this scenario.

USDJPY is Nearing an Important ResistanceHey Traders, in today's trading session we are monitoring USDJPY for a selling opportunity around 143.700 zone, USDJPY is trading in a downtrend and currently is in a correction phase in which it is approaching the trend at 143.700 support and resistance area.
Trade safe, Joe.

Bitcoin is looking great so far!Once the potential Wave 2 correction is over, we can enter a potential Wave 3 on the daily timeframe, reaching at least 140k before the next "major" correction.

TSLA Backtest: A robo-taxi launchpad? TBD ... 𝗧𝗲𝘀𝗹𝗮 𝗕𝗮𝗰𝗸𝘁𝗲𝘀𝘁: A robo-taxi launchpad? 🤖🚗
After a 20%+ breakout, NASDAQ:TSLA is retesting its 200dma with $295–300 now key support. Hold that — and bulls have room to run to $400+.
𝘉𝘶𝘭𝘭𝘪𝘴𝘩 𝘴𝘦𝘵𝘶𝘱 𝘸𝘪𝘵𝘩 𝘢 𝘥𝘢𝘵𝘦: June 12 robo-taxi reveal in Austin could mark Tesla’s first real step toward autonomous ride-hailing at scale.
𝘏𝘪𝘨𝘩 𝘱𝘳𝘪𝘤𝘦, 𝘩𝘪𝘨𝘩 𝘩𝘰𝘱𝘦𝘴: Tesla's valuation has always priced in the future. This time, the future might show up in a self-driving Model Y.
$NQ_F NASDAQ:NDX NASDAQ:QQQ NASDAQ:NVDA NASDAQ:AAPL AMEX:SPY NASDAQ:SOX CBOE:ARKK #Tesla #Robotaxi #FSD #ElonMusk #Stocks

Elliot Waves on the daily timeframeWave 5 should wrap up by tomorrow, and BTC should be set to hit new highs.
