XAU/USD Wave CountWave (B) of ((ii)) suggested to have ended as Expanded Flat Correction ABC and right now price is to expected to decline to complete Wave (C) of ((ii)) before moving up again in at least 3 waves.
Elliott Wave

CRV is Getting Ready For a Skyrocket Move (1D)CRV has formed a Cup & Handle pattern — a well-known structure that typically signals a bullish reversal.
From a broader technical perspective, there's additional confluence suggesting a potential trend shift.
If the most recent dip holds, it may confirm that CRV has completed its bearish cycle and has now entered a new five-wave bullish structure. Based on the current price action, it's likely that wave 3 is unfolding at the moment.
Interestingly, the depth of the Cup & Handle formation aligns well with typical wave 5 targets, offering additional validation for this setup.
In this scenario, the wave 3 target sits around $0.78, which also coincides with a previously untapped order block — adding further credibility to the level.
For a longer-term outlook, wave 5 could extend above the $1.00 mark, depending on market conditions and overall momentum.
Moreover, the Ichimoku Cloud is currently reflecting a bullish bias, with price action moving above the cloud and supportive Tenkan-Kijun alignment — reinforcing the overall bullish outlook.
Achieving this target may take time — but as we all know, in crypto, time often behaves differently.
— Thanks for reading.

EURJPY → False breakout of resistance. Reversal?FX:EURJPY is testing the resistance of the trading range as part of a distribution movement, but the situation ends with a false breakout and price consolidation within the flat.
Against the backdrop of the falling dollar, the Japanese yen is strengthening and thus exerting a corresponding influence on the currency pair. EURJPY is forming a false breakout of resistance within a distribution movement formed after a retest the support of the flat. The price returns to the channel. After a false breakout of resistance and a return of the price below a strong key level, a base is forming in the form of support at 163.2 (trigger).
Resistance levels: 163.4, 163.6
Support levels: 163.2, 162.7
A breakdown of the 163.2 trigger and price consolidation below the key level could intensify the sell-off, triggering a further decline.
Best regards, R. Linda!

A look at monthly Chart of BTCIf we count Elliot Wave at weekly or monthly, we see we are at the ABC Correction of the Primary Impulsive wave, that the ABC might create an Irregular or Expanded Flat. I think the chart is going to create a C wave of the ABC Primary wave, and those numbers might be a target, but according to Fibbonaci Levels, 0.618, which is 40,000. Other targets can also be seen on the chart.

Dollar At Resistance; Will Lower CPI Cause New Drop? We had a volatile start of a new trading week.
The dollar moved higher across the board as the US and China appear to be moving toward lowering tariffs, suggesting progress toward a potential trade deal. As a result, stock futures are also trading to the upside. However, keep in mind that sharp moves on Monday can easily be reversed through the rest of the week, possibly even today, after US CPI came out lower than expected, which can cause some weakness on yeilds, and possibly FED will be ready to cut rates after-all.
So, I think that USD can still come under pressure, especially if we also consider that rise on DXY is in three legs and that a lot fo gaps from this weekend are still unfilled.

USDJPY Faces An Intraday Corrective RecoveryUSDJPY Faces An Intraday Corrective Recovery after a bearish impulse, which can later send the price lower from technical and Elliott wave pespective.
USDJPY is sharply bouncing after reaching May lows within the wedge pattern for wave »v« of an impulse, so it can be now trading in a higher degree abc correction, which can recover the price back to 145 – 146 resistance area before bears return.
Basic bearish Elliott wave pattern shows that a five-wave impulsive decline indicates for more weakness after a corrective three-wave pause.

AVAX/USDT Potential UpsidesHey Traders, in today's trading session we are monitoring AVAX/USDT for a buying opportunity around 22.00 zone, AVAX.USDT is trading in an uptrend and currently is in a correction phase in which it is approaching the trend at 22.00 support and resistance area.
Trade safe, Joe.

USDJPY Shooting Star + Elliott Wave Spells TroubleUSDJPY bounced higher from a horizontal support shelf created from August - September 2024.
The bounce is a second wave. The bearish shooting star candle on the daily chart spells reversal for USDJPY. The bearish wave count using Elliott Wave Theory as our guide as suggests deep cuts may be on the horizon for USDJPY.
We are considering the next decline to be a third wave at multiple degrees of trend. Additionally, the trend lower would break the support shelf and eventually make it to 122 and possibly lower levels.

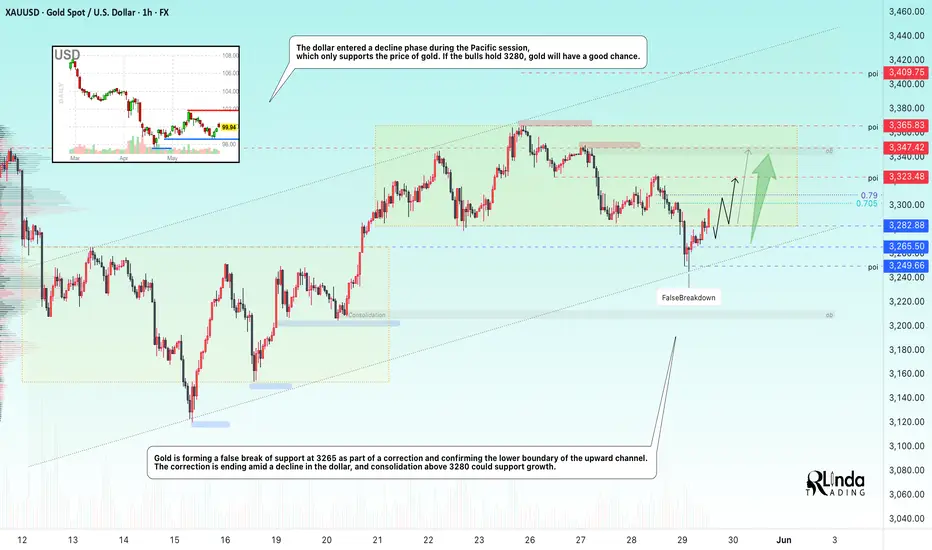
GOLD → False breakdown and support from the falling DXYFX:XAUUSD , as part of a correction, confirms the upward trend line and returns to the consolidation (range), making a false breakdown of support amid the dollar's correction...
The US dollar remains stable thanks to the Fed's hawkish minutes and the court's decision to block Trump's tariffs. Investors are waiting for Friday's inflation data (PCE), which could weaken the dollar and give gold a chance to rebound. Additional influence will come from US GDP data, jobless claims, and geopolitical news.
On D1, gold is rebounding from strong support and heading towards resistance at the rising trend line. If economic risks remain high, gold could continue its rally despite conflicting bearish patterns...
Resistance levels: 3300, 3310, 3325
Support levels: 3290, 3285, 3265
Gold is forming a false breakdown of support at 3265 as part of a correction and confirming the lower boundary of the upward channel. Consolidation above 3280 will confirm that bulls are holding the market amid high economic risks. Gold may test 3300-3310 and form a correction before continuing its growth towards 3325.
Best regards, R. Linda!
DOGEUSDT → Long squeeze before growth?BINANCE:DOGEUSDT.P is consolidating. A range with clear boundaries has formed. Before a possible breakout, a liquidation (false breakdown) may form
On D1, the structure is quite positive. Earlier, the price tested the downward resistance, but there was no reaction (fall) as such. Instead, the price is consolidating within the range of 0.211 (0.205) - 0.23 - 0.253.
Bitcoin, like the entire crypto market, is consolidating within fairly clear boundaries. Based on the current situation, it would be logical to wait for one part of the market to be liquidated before the price can move in either direction. Based on the bullish market, there may be a retest of support in the form of a false break...
Resistance levels: 0.2308, 0.253
Support levels: 0.213, 0.2116, 0.205
DOGE is consolidating with a focus on the 0.23–0.211 range. Against the backdrop of a bullish trend, a liquidation (long squeeze) relative to the lower boundary of the 0.23–0.205 range is possible before growth continues. A false break of support and liquidity capture would be useful maneuvers before implementation. However, if the market is aggressive enough and resistance at 0.23 is broken with subsequent consolidation above this level, it could trigger premature growth.
Best regards, R. Linda!

HLI: Four Boxes, One TruthEvery chart tells a story, but sometimes... you need boxes to make sense of the chaos. Here's how the price action of HLI unfolded through four carefully framed boxes, each revealing a new chapter of this market narrative.
Box 1: The Fall Begins
The first act opens with a classic five-wave impulse decline from the high of $191.99 to $164.05. Textbook.
Every wave fits: clean subdivisions, sharp acceleration in wave 3, and a modest wave 4.
This structure confirms one thing: this was no correction — it was the beginning of something bigger.
I labeled it as Wave A of a possible zig-zag. Or… maybe the start of a complex W?
Box 2: The Deceptive Pause
Enter Box 2: a tricky A-B-C correction (3 waves up) peaking at $187.93 .
Classic fakeout setup — just enough strength to draw in bulls, but not enough to erase the previous drop.
The form and proportion suggest it was just a connector, not a trend changer.
I tagged this one as Wave B — or the (X) in a WXY structure. A pause, not a pivot.
Box 3: The Deep Cut
Next, the market tumbles in another five-wave impulse, bottoming at $137.99.
This leg confirms the pattern: it mirrors Box 1, creating the signature 5-3-5 of a zig-zag — or the W-Y of a complex correction.
Final labeling:
If Box 1 was Wave A, this was Wave C — and together they form a Zig-Zag .
If Box 1 was Wave W, this became Wave Y, closing a potential WXY correction .
A clear bearish tale. Or was it?
Box 4: The Mystery Unfolds
The current rally — from 137.99 to 182.99 (and counting) — is the real wildcard.
Structurally, it’s looking like a clear 5-wave impulse, with sub-waves i-ii-iii-iv-v all marked and playing out.
But wait — if this is just another corrective X wave, it's way too aggressive… isn't it?
Here’s the plot twist:
If price gets rejected below $191.99, this might be Wave X2 in a massive WXYXZ correction.
But if it extends beyond 192 and pushes toward $200, then forget the correction — this rally is likely a new trend, and Wave Z may never arrive.
Key Invalidation Levels
$191.99: The upper limit for X2 — breach it, and the entire corrective scenario collapses.
$161.00: The lower guardrail for the impulse — drop below this, and the impulsive interpretation gets voided.
Indicators I Trust (But Still Watch Closely)
MACD: Momentum slowing.
RSI: Hovering near 50. Neutral, but bears need a breakdown.
Closing Thoughts
Four boxes.
Three corrective legs.
Two competing counts.
One impending breakout — or breakdown.
The price may lie, but the structure doesn’t.
So traders — keep your wave counts tight and your invalidation levels tighter.
Part of the ongoing #WaveTracker series

Bitcoin is correcting to support. Possible growth to 110.000Bitcoin failed to hold above 110000, but at the same time the price is forming a flat. The support has not been tested yet (the cascade of orders below the level has not been touched) and within the uptrend the area of 106700 plays an important role.
Based on bitcoin is inside the flat you can consider trading between its boundaries.
Scenario: Within the current movement, the price is likely to form a retest of the 106700 support with the aim of liquidation and accumulation inside the flat. False break of support may attract buyers and in this case bitcoin may test 110000 again.

Amazon UpdatePrice has re-entered the target box. I mentioned last week that price could still try to target the 1.618 @ $220.01. Judging by the ES, I think it is highly likely that is what is going on. We're still currently trading on hidden bearish divergence which doesn't bode well for a sustained move higher. I think it more likely that we make another slight high towards the 1.618 on neg div setting up the larger move lower for minor C.
The key support price we need to breach that will point us lower is $196. If we can get below that, the momentum will change to the downside. First, we will likely make OMH though. We manage to breach $196 though, and sub $140 comes into view. This will take time. Don't think that it will happen tomorrow or even next week. Minor C will take weeks if not months to complete.

Gold long again: Completion of Double CombinationYesterday's long gold idea was invalidated and turns out that Gold has decided to do a double combination instead of a single A-B-C correction.
Now that I've seen a completion of a Double Combination, I think it is time to try to long gold again.
The stop is below $3240.

Waiting for the Golden Reversal!After a clean 5-wave bearish impulse, gold has finally tapped into a high-probability reversal zone! Here's what I'm seeing:
🔹 Break of structure confirmed at 3337.46
🔹 Price extended all the way to the 4.236 – 4.786 fib zone (3244–3228)
🔹 Landed perfectly in the SNR zone (3238–3231)
🔹 Bullish divergence spotted on the Awesome Oscillator (AO)
🔹 Now printing a bullish engulfing right at demand? 👀
📍 This is a textbook reversal setup.
💡 Waiting to Buy:
If price shows continued bullish intent or lower timeframe confirmation, I’m looking to enter long from the 3238–3231 area, targeting back to the Fib retracement zones and potentially the structure break at 3337.46.
🛡️ SL just below the 4.786 fib extension for safety.
🔥 Summary:
✅ Structure broken
✅ AO divergence
✅ Engulfing at SNR + fib confluence
🎯 Buy zone activated – now waiting for confirmation!
📌 Let the market come to you. No rush. Just watching for that golden reversal.
#XAUUSD #GoldReversal #FibExtension #AOdivergence #ElliottWave #BullishSetup #BuyZone #SmartTrading #ForexAnalysis

LTC - the path to 1k$The path to 1k$/ltc … when btc.d collapses wave 5th will overextend reaching the 2.6 and sometimes the 3.2 fob extension.
Even in normal conditions it could ez go to the 2.2 fib.

Microsoft’s Market Puzzle — The X2 ConundrumAfter a corrective decline from Microsoft’s All-Time High at $467.70, we’ve been tracking a potential complex structure unfolding — and the recent price behavior fits right into a well-formed W–X–Y–X–Z pattern .
In this latest move, we may be witnessing the final stages of the second X-wave (X2) — a sharp and extended rally that reached $462.52, pushing marginally above the first X-wave at $456.16.
Now before that raises eyebrows — yes, X2 is allowed to extend above X1 . In a complex correction, X-waves are connectors, not trends. They can retrace deeply or even overshoot previous pivot highs — especially in the form of an expanded zigzag or running correction. It’s rare, but perfectly legal in Elliott’s chaotic universe.
But this leads to a question:
Is this rally impulsive… or is it bait?
If the move from $344.79 is truly impulsive, then we’re potentially mid-way through a new bullish leg — with wave 3 ending at $462.78, and a mild wave 4 correction into the $437–$421 zone (0.236–0.382 retracement) expected before another pop higher. This view only holds as long as price remains below the ATH at $467.70 — our immediate invalidation level .
However, momentum indicators raise suspicions:
RSI is showing a clear bearish divergence — price made a new high, but RSI didn’t confirm it.
MACD has started rolling over, with a fading histogram — signaling potential exhaustion in this move.
This sets the stage for an alternate, and perhaps more compelling, scenario:
The rally from $344.79 to $462.78 is not a new trend — it’s the X2 wave in a still- unfinished W–X–Y–X–Z combo correction .
If this is the case, then what comes next is Wave Z — the final leg down to complete the entire corrective structure.
And here’s the Elliott rulebook:
Wave Z must be a 3-wave structure (likely a zigzag)
It often mirrors the size of Wave Y or contracts modestly
Projection for Z from the X2 top targets the $393–$351 zone, which represents a 0.618–1.0 retracement of the Wave Y decline
This zone becomes the primary downside watch area, should price reject from this level and fail to break above $467.70.
Summary:
We’re at a critical junction.
The rally from $344.79 could either be:
An impulsive move needing a wave 4 pullback
Or a complex X2 wave — ready to hand over the baton to Wave Z
Both scenarios require careful tracking of structure, MACD, RSI, and price action near the retracement zone and the ATH invalidation level.


Bitcoin - Hardcore pump 125k and dump 49k (must see!)In this very detailed and unique analysis, we will look at the most important Bitcoin fundamental analysis of halving cycles. I predict Bitcoin will crash to 49k in 2026, so if you are buying now for the long term as an investment (buy and hold), you can probably wait for a better price! We can statistically predict Bitcoin moves with this simple chart because it's always right and never wrong. What can we say with certainty?
Statistically:
Bitcoin's bull markets last for 742 to 1065 days
Bitcoin's bear markets last for 364 to 413 days
Correction is every time weaker, but still huge
Statistically, Bitcoin crashes every 4 years by 86% to 77%. The market cap is getting bigger as institutions step in, so this time I expect a weaker crash (around 65%). Still, it's a huge crash, and many investors will sell at a loss as usual. Knowledge of the Bitcoin cycles will save you a lot of money.
We are in the final stage of the bullish cycle, and this cycle should end between September and December 2025. When you draw a trendline on the linear monthly chart, you will get a target of around 125,000 USD. This is a good level to sell Bitcoin. I would never listen to moon boys that are screaming that Bitcoin will never go down and Bitcoin will reach 500k or 1M in the next months. That's due to an already big market cap, pretty much impossible. After we finish this bull cycle, we can expect a massive crash to 49k in 2026. For people who are prepared, this may be an incredible investment opportunity. Also, you can short Bitcoin at the top and ride the investment in the opposite direction, plus you will make money on funding fees every 8 hours.
Bitcoin halving is coded to occur once every 210,000 blocks, or roughly every four years, and will continue in this fashion until the final supply of 21 million BTC is reached. It is assumed that the last BTC will be mined in 2140. After that, transaction fees are supposed to be the only source of block rewards for miners.
Write a comment with your altcoin + hit the like button, and I will make an analysis for you in response. Trading is not hard if you have a good coach! It is not a trade setup, as there is no stop-loss or profit target. I share my trades privately. Thank you, and I wish you successful trades!

Bitcoin Overall: Bigger Consolidation PhaseWe're likely in a larger consolidation phase on Bitcoin. I'd expect something like the indicated moves. Looks as if the current support may hold. Regardless, there's a fairly strong one below that would be great for a long trade.

CHECK USDCAD SIGNALS READ CAPTAIN USDCAD Buy signals
TRADE
Entry ponit 1.38313
Take profit Target 1.39540
Stop loss 1.37945

SUI/USDT is Nearing an Important Support!!Hey Traders, in today's trading session we are monitoring SUI/USDT for a buying opportunity around 3.2460 zone, SUI/USDT is trading in an uptrend and currently is in a correction phase in which it is approaching the trend at 3.2460 support and resistance area.
Trade safe, Joe.

GOLD → Consolidation ahead of news. Retest of resistanceFX:XAUUSD remained above the key support level of 3280 and is testing intermediate resistance. Against the backdrop of the dollar's decline, the metal has a chance to continue its growth...
Gold is trading in consolidation ahead of the Fed meeting minutes. Easing trade risks and the dollar's recovery triggered a correction from the recent peak of $3366. Against the backdrop of the dollar's correction, the metal is entering a phase of local rally and testing resistance at 0.5f
The Fed is maintaining a cautious tone, and the market is waiting for signals on interest rates. The escalation of the conflict in Ukraine and the threat of new sanctions from Trump did not cause significant concern in the markets. Investors are waiting for drivers
Resistance levels: 3322, 3348, 3363
Support levels: 3290, 3282, 3265
A small correction may form from 3322 before growth continues. The market is interested in liquidity in the 3348-3363 zone, and the price is likely to test this zone. However, further developments depend on the fundamental background. Rising economic risks or hints of interest rate cuts could support the price of gold.
Best regards, R. Linda!
