NXPCUSDT → The coin is being killed. Searching for a new bottomNXPCUSDT is testing the bottom at 1.1675 while Bitcoin and the top 10 cryptocurrencies are in a global/local bullish trend...
NXPCUSDT is showing its weakness in the cryptocurrency market. There is no potential or driver for the coin, and it continues to be killed... Against the backdrop of a growing market and Bitcoin forming a bullish trend, the NXPC coin is testing the bottom...
After a strong and long-term decline, the NXPC coin is forming a flat (consolidation) in the range of 1.5637 - 1.1675. A pre-breakdown base is forming relative to support, which could lead to the price breaking out of consolidation downwards...
Resistance levels: 1.2532
Support levels: 1.1675
Focus on support for the range and bottom in the current coin at 1.1675. This is a risk zone and a panic zone. If the price breaks out of this consolidation, there are no obstacles below and the fall could be aggressive. A breakout of the consolidation support could trigger a continuation of the rally or a decline with the aim of forming a new bottom...
Best regards, R. Linda!
Elliott Wave

Coca-Cola Wave Analysis – 19 June 2025
- Coca-Cola broke the support zone
- Likely to fall to support level at 68.55
Coca-Cola recently broke the support zone located between the support level 70.35 (which reversed the price twice from May) and the 61.8% Fibonacci correction of the upward impulse 1 from May.
The breakout of this support zone coincided with the breakout of the daily Triangle from April – which accelerated the active correction 2.
Coca-Cola can be expected to fall to the next support level at 68.55 (former monthly low from May and the target for the completion of the active correction 2).

Gold Hits PRZ with RD-! Time for Bears to Take Over?Gold ( OANDA:XAUUSD ) attacked the Resistance zone ($3,445-$3,406) once again, forming an Ending Diagonal at the top of the structure.
Although price reached the Potential Reversal Zone (PRZ) , the presence of Regular Divergence (RD-) between the last two peaks could indicate the weakening of bullish momentum .
In terms of Elliott Wave theory , we can clearly count a completed 5-wave structure , with an Ending Diagonal pattern . This supports the idea of a major correction starting soon .
I expect Gold to attack the lower lines of Ending Diagonal , and if it breaks, it could drop to at least $3,333 . The Second Target could be the Support zone ($3,451-$3,120) .
Do you think Gold will make a new All-Time High(ATH) again in this rally?!
Note: Stop Loss (SL) = $3,463
Gold Analyze (XAUUSD), 2-hour time frame.
Be sure to follow the updated ideas.
Do not forget to put a Stop loss for your positions (For every position you want to open).
Please follow your strategy; this is just my idea, and I will gladly see your ideas in this post.
Please do not forget the ✅ ' like ' ✅ button 🙏😊 & Share it with your friends; thanks, and Trade safe.

ABC or 12345Just a little deeper to finish the wave count and we're all set. If it stays an ABC, it could mean an expanded flat correction, which wouldn't be good since it would mean we'd go deeper later.

BTC Approaching Key Confluence Zone: Pivot + PRZ + LiquidationsBitcoin ( BINANCE:BTCUSDT ) appears to have broken the Support lines and is currently declining .
In terms of Elliott Wave theory , Bitcoin appears to be completing a corrective wave C . The corrective wave structure is a Zigzag Correction(ABC/5-3-5) .
I expect Bitcoin to start rising again from the Support zone($104,380-$103,660) , Potential Reversal Zone(PRZ) , Cumulative Long Liquidation Leverage($104,471-$103,124) , Monthly Pivot Point , Support line , and 50_SMA(Daily) , and the small CME Gap($106,190-$106,150) will also fill.
Note: Stop Loss: $102,520
Please respect each other's ideas and express them politely if you agree or disagree.
Bitcoin Analyze (BTCUSDT), 1-hour time frame.
Be sure to follow the updated ideas.
Do not forget to put a Stop loss for your positions (For every position you want to open).
Please follow your strategy and updates; this is just my Idea, and I will gladly see your ideas in this post.
Please do not forget the ✅' like '✅ button 🙏😊 & Share it with your friends; thanks, and Trade safe.

₿itcoin: Holding steadySince our last update, Bitcoin has traded in a relatively stable range. As expected, there's still a strong case for the crypto leader to climb into the upper blue Target Zone between $117,553 and $130,891. However, a deeper pullback below the $100,000 mark remains a real possibility before that move unfolds. Regardless of the path it takes, we continue to expect Bitcoin to reach this upper zone, completing green wave B. From there, a corrective wave C—also in green—is likely to follow, driving the price down toward the lower blue Target Zone between $62,395 and $51,323. This move would mark the end of the broader orange wave a. For now, we’re watching for a potential b-wave recovery before the final leg lower toward the bottom of blue wave (ii) takes shape. That said, there's still a 30% chance that blue wave (i) isn’t done yet and could extend significantly above $130,891 before any meaningful correction begins.
📈 Over 190 precise analyses, clear entry points, and defined Target Zones - that's what we do.

ELLIOTT WAVE XAUUUSD H4 update
EW Trade Set Up H4
minuette wave (iv) running?
The upside move from 3120a of 150525 to 3439a of 130625 does not seem a motive (sure not impulsive/leading diagonal maybe) wave , so a sideways (flat) correction of the minuette wave (iv) is more likely
key levels (area)
3462
3402
3317 POC
3270
3238

Dow Jones Potential UpsidesHey Traders, in today's trading session we are monitoring US30 for a buying opportunity around 41,900 zone, US30 is trading in an uptrend and currently is in a correction phase in which it is approaching the trend at 41,900 support and resistance area.
Trade safe, Joe.

AUDUSD Potential UpsidesHey Traders, in today's trading session we are monitoring AUDUSD for a buying opportunity around 0.64600 zone, AUDUSD is trading in an uptrend and currently is in a correction phase in which it is approaching the trend at 0.64600 support and resistance area.
Trade safe, Joe.

USDCAD – Bullish Reversal After Completed Wave 5 and AO DivergenAnalysis:
The USDCAD daily chart shows a textbook completion of an Elliott Wave 12345 sequence. Wave (5) has just completed, supported by clear bullish divergence on the Awesome Oscillator (AO) – a classic signal suggesting exhaustion of bearish momentum.
What strengthens the bullish reversal bias is the presence of a bullish engulfing candle at the end of Wave (5), right at a key structural low. This candle formation, combined with the divergence, provides strong evidence that a corrective wave (likely Wave A or a larger reversal) may be underway.
🔍 Key Confluences:
Wave 5 ends in a falling wedge structure.
AO shows higher low on Wave 5 compared to Wave 3 → Bullish Divergence.
Bullish engulfing candle confirms momentum shift.
Price action breaking out of the wedge pattern.
🎯 Trade Plan:
I am waiting for a pullback toward the breakout zone to find an optimal buy entry. The ideal entry would be a retest of the bullish engulfing candle low or broken wedge resistance, turning into support.
📈 Targets:
Initial short-term target: ~1.3850 (previous Wave 4 region).
Mid-term potential: ~1.4050 depending on structure development.
🛑 Invalidation:
A daily candle closing back below the low of the bullish engulfing will invalidate the bullish outlook.

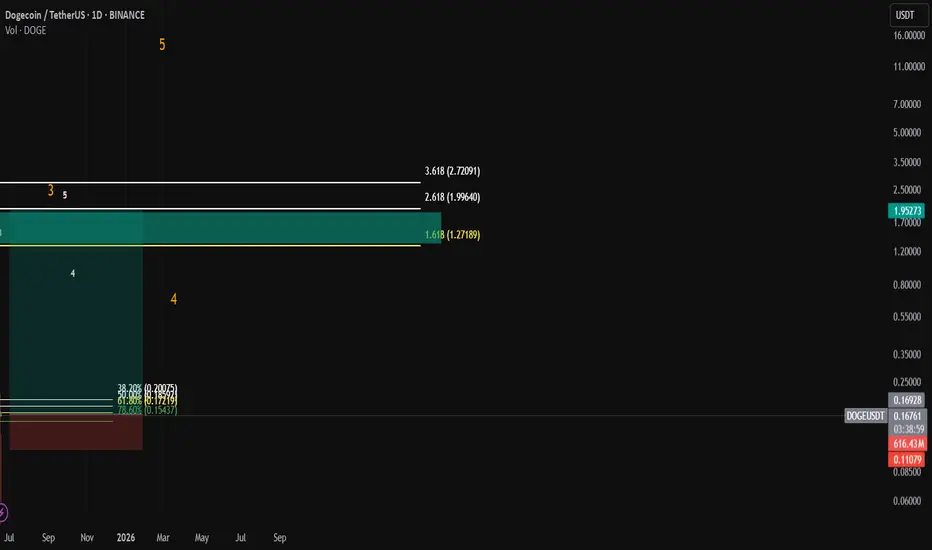
DOGE/USDT trade planThe chart shows a completed WXY correction followed by a triangle (ABCDE), marking the end of the larger correction at Wave 2.
Currently, Wave 3 is underway, with potential to enter the explosive sub-wave 3 of 3 soon. it will be the runner don't forget this coin
32RR trade setup
Entry Zone (Buy Area):
Between 0.154 – 0.172 USDT
Supported by:
61.8% Fib retracement: 0.172
78.6% Fib retracement: 0.154
Strong structural support from previous breakout zones.
🟥 Stop Loss (SL):
Below 0.110 USDT
A break below this invalidates the bullish impulse wave count.
TP1 ~$1.27
TP2 ~ $1.99
TP ~ $2.72
⚠️ Risk Note: Not financial advice. Use proper risk management
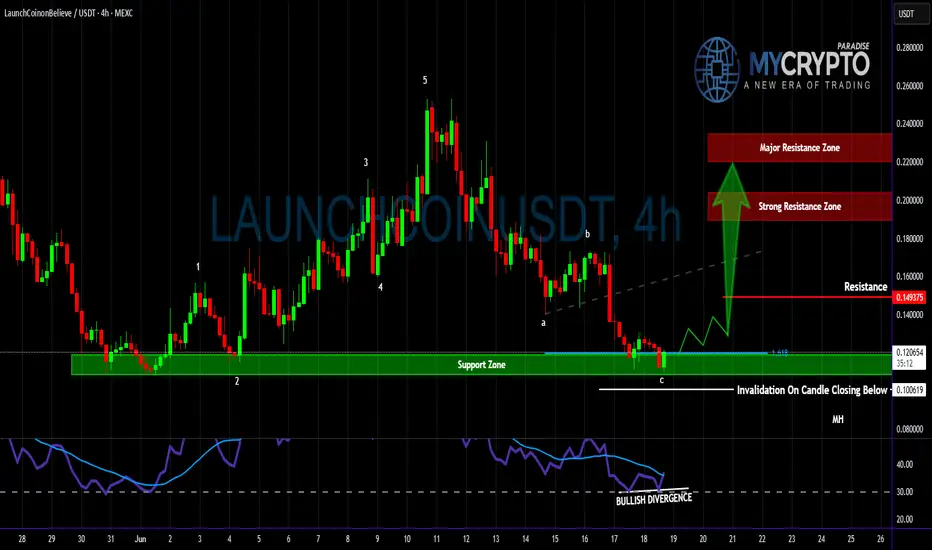
Wave C Complete — Time for the Real Move on LaunchCoin?Yello, Paradisers! Is #LaunchCoin about to reverse from its brutal downtrend? After completing a probable ABC correction right at key support, the conditions are setting up for a potential bounce — but only for those patient and prepared.
💎#Launchcoinusdt ,We’re most likely looking at the final leg of a Zig-Zag correction pattern, with wave C landing precisely within a well-defined support zone between 0.1006 and 0.1060. This zone has held up well so far, and there’s a clear bullish divergence forming on the RSI, which statistically increases the probability of a short-term reversal from this level.
💎The structure suggests we’re near a local bottom, but follow-through is essential. A sustained reclaim of the 1.618 Fibonacci extension level could act as a confirmation trigger for further upside. If that occurs, we expect price to approach the next resistance at 0.1493, followed by a strong resistance zone between 0.1900–0.2000, and eventually the major resistance around 0.2200–0.2350.
💎However, invalidation remains clear: any 4-hour candle closing below 0.1006 would reduce the probability of this bounce playing out and shift the bias back toward further downside. Until then, the setup remains valid and tradable for those who follow a structured and disciplined approach.
Paradisers! we are playing it safe right now. If you want to be consistently profitable, you need to be extremely patient and always wait only for the best, highest probability trading opportunities.
MyCryptoParadise
iFeel the success🌴
Zambian Kwacha Technical Outlook - A Wave Analysts PerspectiveUSDZMW seems to have reached what appears to be a major market top after completing a classic 5 wave Elliott impulse cycle on the monthly timeframe. This marks the end of a multi-decade bullish structure and signals the beginning of a corrective phase potentially reshaping Zambia’s FX landscape in the medium term.
Key Technical Insights:
The final Wave 5 peaked at 28.97, followed by a sharp decline to 23.90 (at the time of this publication).
A corrective ABC structure is now likely underway with fibonacci based downside targets around:
Target 1: $1 = K22.31 – minor correction (23.6%)
Target 2: $1 = K18.30 – medium correction (38.2%)
Target 3: $1 = K15.05 – deep retracement (50% of the main wave on monthly TF)
While various fundamentals, copper prices, debt restructuring and prevailing fiscal policies play a role, this technical setup suggests a strong medium to long term appreciation of the Kwacha is on the cards.
We may be witnessing the early stages of a multiyear FX shift.
Disclaimer:
This analysis is for informational and educational purposes ONLY and does not constitute financial advice in any way. Market conditions are subject to change and all trading involves risk.

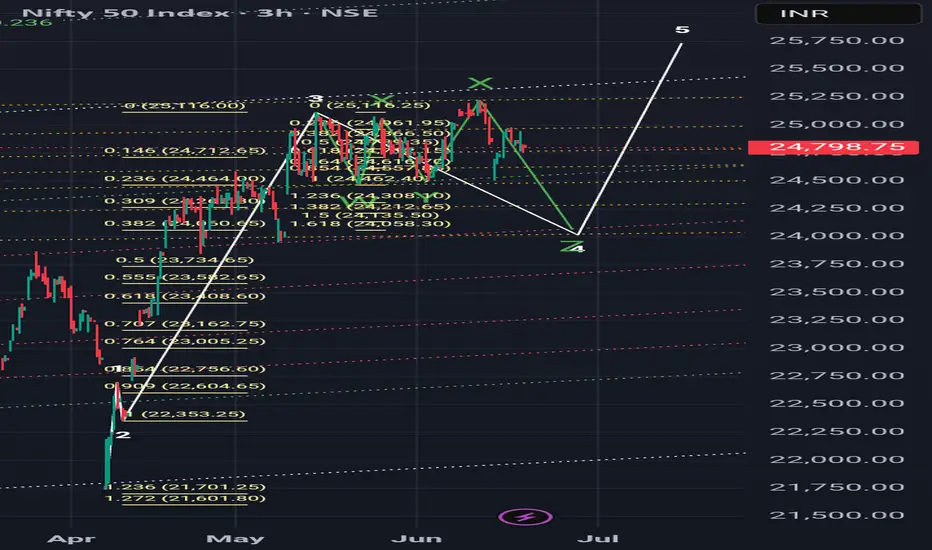
June's end and 24060.There is a slight change in my previous view. Nifty is in a complex correction of wave 4 and it is going to correct wave 3 rd by June's end upto 24060 as shown in snapshot.
Dollar In Fifth Wave-Reversal In Trend May Not Be Far Away.The Fed will announce its latest policy decision later, and expectations are that Powell will keep rates on hold, especially after last week's slightly higher inflation print and still solid US jobs data. We can see some stabilization in the US dollar ahead of this event, but we have to keep an eye on geopolitical tensions in the Middle East, which coudl also play a key role in driving safe haven flows.
Meanwhile, the stock market continues to trade sideways, and I don't expect any major breakouts or strong moves ahead of the Fed. Also, tomorrow is a holiday in the US, so that could contribute to slower market conditions into the end of the week, unless, of course, the situation in the Middle East gets worse.
Looking at the DXY waves structure, I see athree-wave move from the most recent lows, so the fourth wave I highlighted a few days ago could now be approaching completion near this week’s key resistance around the 99 level. That’s definitely a level to watch for a potential fresh, but possibly final sell-off toward new lows around 97, maybe even 96.
That’s where the DXY could stabilize, as ending diagonal pattern signals that we are likely in the late stages of wave five, meaning this bearish cycle could soon come to an end.

IOLCP – Multi-Year Breakout Setup Forming? | Inverse H&S in FocAnalysis:
IOL Chem & Pharma is showing signs of life after years of consolidation. A potential inverse Head & Shoulders pattern is forming with a neckline around ₹90–91.
📍 Key Levels:
✅ ₹91 – Breakout level on daily close
⚡ ₹111 – Multi-year breakout confirmation
🛡️ SL: ₹75 (below recent structure)
Volume confirmation is critical for breakout sustainability. RSI is nearing bullish territory, supporting possible upside.
🎯 Breakout Target (on confirmation): ₹135–₹150 zone
📌 Watchlist stock – Needs confirmation. Stay alert for price action around ₹91–₹111.

Distribution Zone Triggered⏰ Timeframe: 15-Minute (M15)
💱 Pair: EUR/USD
📍 Event: Distribution Zone Triggered ‼️
🔍 Market Structure Breakdown: 1️⃣ Accumulation Phase 🟨
📌 Smart money builds long positions
📌 Stops hunted below support
2️⃣ Manipulation Phase 🟦
📌 Liquidity grab above resistance
📌 Trap set for retail buyers
3️⃣ Distribution Phase 🟥
📌 Entry for institutional sellers
📌 Shift in order flow to bearish bias
📊 What’s next?
🔻 Price likely heading to lower demand zones
🔄 Expecting continuation move post-distribution
🧠 Powered by Smart Money Concepts + Wyckoff Logic
🎯 Trader's Tip: Always wait for confirmation inside distribution to avoid false entries!
#EURUSD #DistributionZone #SmartMoney #WyckoffLogic #LiquidityGrab #SMCTrading

DeFi Index Completes Irregular Flat Correction; Bulls Back?DeFi Index may have a completed irregular flat correction within an uptrend, which may cause another rally this year, according to Elliott wave theory.
Cryptocurrencies are recovering and DeFi Index is now bouncing back above EW channel, so a five-wave impulse into wave (C) of an irregular (A)(B)(C) flat correction in blue wave B can be finished. It means that a higher degree blue wave C can now be in play, which can rally this year all the way back to March 2024 highs. Is this the beginning of an ALTseason?
A basic bullish irregular flat correction is a three-wave (A-B-C) pattern where wave B exceeds the start of wave A and wave C dips below wave A before the overall bullish trend resumes.

GOLD → Consolidation. Awaiting the FOMC meetingFX:XAUUSD is consolidating in the range of 3403 - 3373. The problem is that there is news ahead. FOMC and interest rate meeting. The market may react in any unpredictable way...
On Wednesday, the price of gold retreated from $3,400 as sentiment stabilized and investors focused on the upcoming Fed decision. Tensions in the Middle East remain high, but there is less panic in the markets. The Fed is expected to leave rates unchanged. The focus is on forecasts for rates, growth, and inflation. Dovish signals could support gold and weaken the dollar. If the Fed is more cautious due to oil and the conflict in the Middle East, the dollar could rise and gold could fall.
Technical nuances are irrelevant in this case, as price behavior depends on the market's interpretation of fundamental factors.
Resistance levels: 3403, 3420
Support levels: 3373, 3339
BUT! Technically, I would say that there is pressure from the bears. The price is compressing towards the support level of 3373.
The market remains unbalanced in favor of buyers, and it is logical that market makers will be interested in testing the trend support zone or the 3339 level (due to the liquidity pool) before continuing to rise (gold may continue to rise both if rates are lowered and if they remain at the same level. However, the tone of the Fed will play a major role here)
Best regards, R. Linda!

A map of PepeusdtA right and left shoulder is made + head + Elyot waves analysis. This is a corrective rise and not a motive .. The movement
It is expected to land on the area specified below in the coming weeks
*In principle, I am not a supporter of any direction, but I am only giving my point of view, which may be right or wrong. If the analysis helps you, then this is for you. If you do not like this analysis, there is no problem. Just ignore it. My goal is to spread the benefit. I am not one of the founders of the currency.

ELLIOTT WAVE EURUSD H4 update
EW Trade Set Up H4
minute wave ((ii)) is running.
the
The upside move from 1.1070a of 120525 to 1.1635a of 120625 does not seem a motive wave , so a sideways (flat) correction of the minute wave ((ii)) is more likely
key levels (area)
1.1590
1.1538
1.1366 POC
1.1169
1.1080

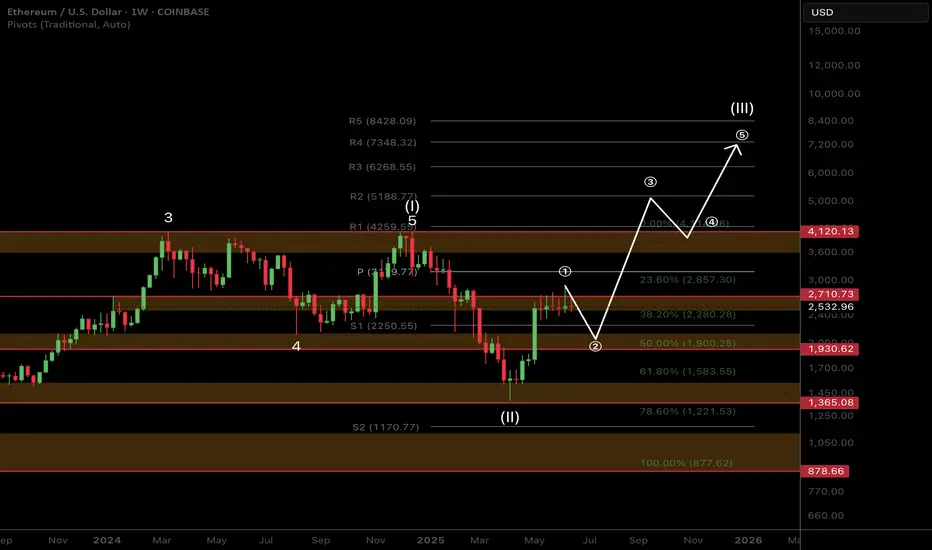
ETH Macro Analysis☕ 𝙂𝙈. CRYPTOCAP:ETH Macro analysis update...
📈 𝙇𝙤𝙣𝙜 𝙩𝙚𝙧𝙢 outlook remains unchanged and recent price action printing a doji. Target is still $7k for this cycle.
📉 𝙎𝙝𝙤𝙧𝙩 𝙩𝙚𝙧𝙢 outlook has investors looking lower towards the $1900 target but this isn't guaranteed to be reached and price action may front tat $2200.
War escalation's and retail selling are keeping price suppressed. ETF inflows and staking continue to grow!
The time for patience continues. Money is made in the sitting, weathering volatility, not flipping in and out of trades on every bit of news and price movement
𝙏𝙚𝙘𝙝𝙣𝙞𝙘𝙖𝙡 𝘼𝙣𝙖𝙡𝙮𝙨𝙞𝙨
Price is consolidating at its recent highs. Consolidation under resistance has high probability of breaking out, the longer it remains the higher the probability.
Elliot Wave (EW) analysis suggests a motif wave ended at the $2700 resistance, with a wave 2 retracement underway, likely a shallow one.
Safe trading
BTC Macro Analysis☕ 𝙂𝙈. CRYPTOCAP:BTC macro analysis update...
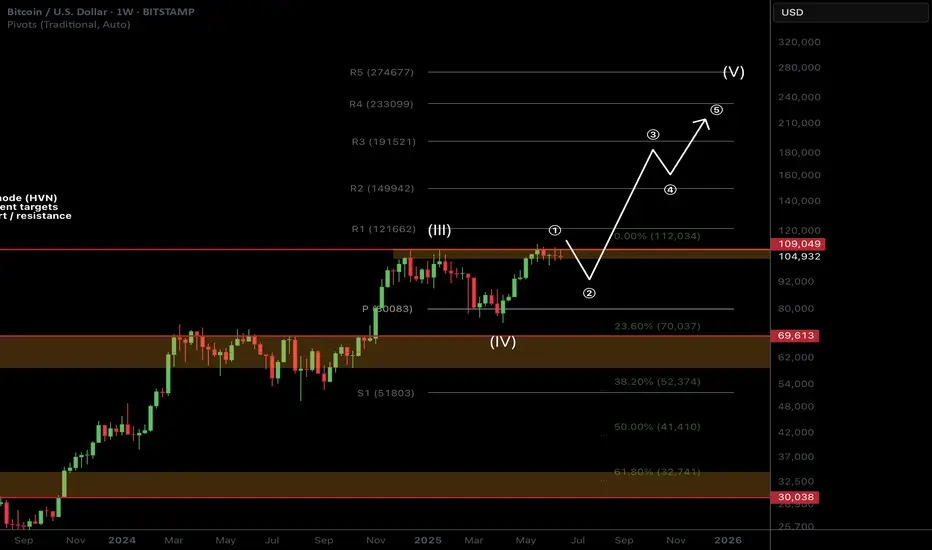
📈 𝙇𝙤𝙣𝙜 𝙩𝙚𝙧𝙢 outlook remains unchanged and recent price action is barely a blip on the weekly chart. SD+2 target is still $211k as a blow off top.
📉 𝙎𝙝𝙤𝙧𝙩 𝙩𝙚𝙧𝙢 outlook has investors looking lower towards the $92K target but this isn't guaranteed to be reached and price action may front those who wait.
War escalation's and retail selling are keeping price suppressed as price changes hands to private companies and large wallets.
The time for patience continues. Money is made in the sitting, weathering volatility, not flipping in and out of trades on every bit of news and price movement
𝙏𝙚𝙘𝙝𝙣𝙞𝙘𝙖𝙡 𝘼𝙣𝙖𝙡𝙮𝙨𝙞𝙨
Price is consolidating under all time high resistance. Consolidation under resistance has high probability of breaking out, the longer it remains the higher the probability.
Elliot Wave (EW) analysis suggests a motif wave ended with the poke above all time high (per the EW rules), with a wave 2 retracement underway. Price remains above the daily pivot (bullish) but below the DEMA (bearish). A triangle could still be forming but this is not my preferred EW count.
Safe trading