AI Chip Stocks NVDA and AMD Showing 5 Wave RiseNASDAQ:NVDA and NASDAQ:AMD are both showing 5 wave rise in weekly chart after a correction in WXY. I haven't checked but other AI related stocks also might be doing something similar.
Once the 5 waves are over, we can expect some correction but the 5-wave rise post a correction typically signals fresh uptrend so it might be worth keeping an eye on these stocks. Waiting till retracement/correction of this rise is complete.
Elliott Wave

BTC/USD: 12 JUNE, 2025 - IS THE SECOND WAVE UNFOLDING?Conclusion: The 1-grey wave may have just completed at the 111,965 high, and the 2-grey wave is unfolding to push lower, targeting the low around 95,872.01.
I counted a five-wave within the 1-grey wave, which suggests that it may have ended, and we are entering the 2-grey wave. This decline could target around the 95,572 low in the form of a Zigzag labeled a,b,c))-navy.
While the price must remain below 110,617 to keep this Bearish view valid.

CRUDE OIL: 12 JUNE, 2025 - BOTTOM AND TAKE OFF!?Conclusion: The ABC)-orange correction may have just completed, and a five-wave is pushing much higher, targeting the nearest target at the high around 94.19 or 130.50.
Details: Since the high of 130.50, a decline with A,B,C)-orange has unfolded as a Zigzag. I counted a five-wave within the A)-orange, and a triangle within the B)-orange, and finally the C)-orange has completed as a five-wave. So, perhaps that ABC has ended with convincing evidence.
So crude oil is likely to rise in the medium term, even though the alternative scenarios with relatively high probability in another development also show increasing bullish weight. And it is aiming for the nearest target at 94.19. While price must always remain above 55.30 to keep the Bullish market view valid.

S&P 500 Short Update 2: Shifting wave degreeHi all,
As I explained in this video, the previous idea was invalidated because of an issue with "degree" of wave that a fellow watcher of my idea rightly pointed out in the comments section. I did the change on this video and explain the mistake I made in the previous idea.
In this video, I also talked about the last wave, how it can still be the peak but on the bigger picture, it is still too small compared to wave 1 and 3.
I then recommend 3 "safer" entry points:
1. One reversion trade at the top of the trendline.
2. One breakdown from the diagonal trendline.
3. One breakdown from the 4th wave support price.
Which entry point(s) you choose depends on your personal preference and opportunity. The stop will be above where you identify as the peak at your point of entry.
Good luck!

GOLD → Strengthening and return to range. Focus on 3340FX:XAUUSD is forming a fairly strong support zone (a cascade within an upward line). The price is returning to the range, with bulls storming 3330-3340.
Markets are awaiting US inflation data (CPI), which may affect expectations for a Fed rate cut in September (chances are about 52%). Optimism following progress in US-China trade talks is supporting sentiment, but uncertainty remains due to a court ruling allowing Trump to maintain tariffs. This is holding back the dollar and helping gold. CPI forecast: 0.2% growth, core inflation 0.3%. Lower inflation, on the other hand, will support expectations of lower rates and strengthen demand for gold as a safe-haven asset.
Technically, gold is stuck between the boundaries of a symmetrical triangle. Overall, this situation is reflected in all markets. Consolidation is forming and the price could break out in either direction...
Support levels: 3301, 3330, 3340
Resistance levels: 3349, 3361, 3375
Focus on the boundaries of the previous range - 3330 - 3340. If the bulls, after the assault, manage to hold their ground above this zone, the market may take the initiative due to support and continue its growth towards areas of interest.
Best regards, R. Linda!

AUDUSD → Correction after a false breakout before growthFX:XAUUSD continues to rise amid uncertainty surrounding the dollar, which continues to consolidate. The currency pair is preparing to test resistance at 0.6537
The dollar is stuck in place due to market uncertainty. At the same time, the Australian dollar is strengthening and is ready to test the liquidity zone
Within the current trend, the currency pair is heading towards resistance and the liquidity zone. We opened far away, and as we move towards the target, the potential for further growth may end. A false breakout of 0.6537 could trigger a correction
Resistance levels: 0.6537
Support levels: 0.6509, 0.6479
A sharp move towards resistance without the possibility of further growth could cause a false breakout of 0.6537. Price consolidation below this level could trigger a correction before growth.
Best regards, R. Linda!

NASDAQ Potential UpsidesHey Traders, in today's trading session we are monitoring NAS100 for a buying opportunity around 21,700 zone, NASDAQ is trading in an uptrend and currently is in a correction phase in which it is approaching the trend at 21,700 support and resistance area.
Trade safe, Joe.

S&P500 is Nearing an Important Support of 5,960!!!Hey Traders, in today's trading session we are monitoring US500 for a buying opportunity around 5,960 zone, US500 is trading in an uptrend and currently is in a correction phase in which it is approaching the trend at 5,960 support and resistance area.
Trade safe, Joe.

Dow Jones Potential UpsidesHey Traders, in today's trading session we are monitoring US30 for a buying opportunity around 42,100 zone, US30 is trading in an uptrend and currently is in a correction phase in which it is approaching the trend at 42,100 support and resistance area.
Trade safe, Joe.


ETH Bullish Setup: Pullback to 200_SMA(D) May Launch Next Rally Ethereum ( BINANCE:ETHUSDT ) seems to have finally managed to break the Resistance lines and the 200_SMA(Daily) in the fifth attack . However, the number of Resistance lines inside the Heavy Resistance zone($2,929_$2,652) is high, and Ethereum will find it difficult to break through them.
In terms of Elliott Wave theory , it seems that Ethereum is completing microwave 4 , and we should wait for this wave to complete. Microwave 4 could act as a pullback to the resistance lines and 200_SMA(Daily) .
I expect Ethereum to start rising from the Support zone($2,745_$2,650) again and rise to at least the Potential Reversal Zone(PRZ) .
Note: If Ethereum touches $2,537 , we can expect further declines.
Please respect each other's ideas and express them politely if you agree or disagree.
Ethereum Analyze (ETHUSDT), 1-hour time frame.
Be sure to follow the updated ideas.
Do not forget to put a Stop loss for your positions (For every position you want to open).
Please follow your strategy and updates; this is just my Idea, and I will gladly see your ideas in this post.
Please do not forget the ✅' like '✅ button 🙏😊 & Share it with your friends; thanks, and Trade safe.

BTC.D(based one NEowave)the Z wave of this branch shown as a triangle and I think its finished but for confirmation breaking the 61.9 is important.
its a green light of Altseason.

WTI: Need a Breakout the STOP.DISCLAIMER : All labelling and wave counts done by me by manually and i will keep change according to the LIVE MARKET PRICE ACTION. So don't bias, hope on my trade plans...try to learn and make your own strategy...Following is not that much easy...I AM NOT RESPONSIBLE FOR ANY LOSSES IF U TOOK THE TRADE ACCORDING TO MY TRADE PLANS....THANKS LOT..CHEERS

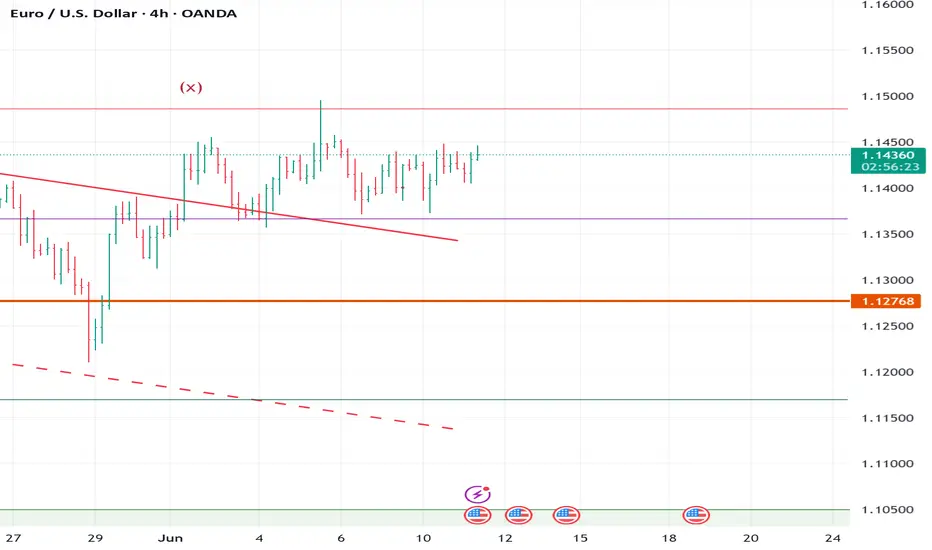
EUR/USD Weekly Outlook | Harmonic Butterfly PatternHere is a professional TradingView publish description for your EUR/USD Weekly Butterfly Pattern Analysis:
---
🦋 EUR/USD Weekly Outlook | Harmonic Butterfly Pattern
Pair: EUR/USD
Timeframe: 1W (Weekly)
Strategy: Harmonic Pattern Recognition – Butterfly Pattern
Bias: Bearish Reversal Setup
---
🔍 Pattern Analysis:
Butterfly Harmonic Pattern completed with precision at the 1.272–1.414 extension zone, forming the critical D-point near 1.14700.
Price has reacted sharply from the PRZ (Potential Reversal Zone), aligning with a historical supply zone.
Confluence from Fibonacci extensions:
AB = 0.786 retracement
BC = 0.382 to 0.886 retracement
CD = 1.618 to 2.618 extension
📉 Bearish rejection expected from this high-probability reversal zone.
---
📌 Key Levels:
PRZ (Potential Reversal Zone): 1.14500 – 1.15000
First Target Zone (Support Block): 1.11500 – 1.10500
Invalidation (Pattern Failure): Close above 1.15500
---
📅 Projection: This weekly harmonic butterfly suggests a potential trend reversal or deep pullback. We may see EUR/USD targeting lower support as D-point gets respected. Watch for signs of weakness such as long-wick rejections, bearish engulfing patterns, or RSI divergence confirmation.
---
💡 Conclusion: EUR/USD is at a critical juncture. If the butterfly holds, this could be a high RR short opportunity for swing traders. Patience is key—confirmation on lower timeframes will validate entry.
---
📊 #EURUSD #ButterflyPattern #HarmonicTrading #ForexAnalysis #TechnicalAnalysis #SwingTradeSetup

Crude Oil Technical Analysis 🛢 Crude Oil Technical Analysis (Weekly Structure & 2H Chart Confirmation)
Chart Reference: Based on your 2H chart, crude has completed an A-B corrective structure and is likely entering the impulsive C leg, which typically unfolds in 5 waves (I, II, III, IV, V).
🔍 Elliott Wave Interpretation
Wave A: Likely the initial leg down — corrective but strong.
Wave B: Completed near the recent top ~66.5–67 zone (acts as resistance).
Wave C: Beginning now; a clear impulse structure (5-wave down expected).
🟣 Wave Count Breakdown on 2H Chart
Wave I: Likely completed near 64.5 — key level to confirm downside continuation.
Wave II: Minor retracement to ~66.5 (double top zone).
Wave III: Expected to be sharp and impulsive — projected towards 60 zone.
Wave IV: Small pullback/retrace near 57.5–58.5.
Wave V: Final push down — projected to 52–54 range.
🎯 Key Price Levels
Level Significance
66.5–67.0 Wave B high / Resistance Zone
64.5 Breakdown Confirmation (Wave I Low)
60.0 First Major Support / Wave III end
55.0 Likely Wave V Extension area
52.0 Potential C-Wave Completion Zone
🧠 Observations & Trade Notes
If 64.5 breaks, the C-leg is active and impulsive selling should follow.
RSI/Momentum indicators (not shown) should confirm bearish divergence or breakdown if this analysis holds.
Wave III is usually the longest; hence, fast drop expected after 64.5 breach.
Keep an eye on volume spikes and wide-body red candles post-64.5 for entry triggers.
📉 Short-Term Trading Strategy
Below 64.5: Initiate short with SL above 66.7
Target 1: 60.2
Target 2: 55.3
Target 3: 52.0
SL Trail: Once below 60, trail SL above 62.
🛑 Risk Considerations
A strong close above 67.2 invalidates the current wave count and may call for re-evaluation (possibly extended Wave B or triangle).
📌 Conclusion
Crude has likely entered a Wave C downtrend which is impulsive in nature. A clean break below 64.5 confirms that Wave III is active, and targets of 60–52 remain valid. The structure aligns with a larger time frame correction. Strong caution is advised above 67.
📢 Disclaimer:
This analysis is for educational and informational purposes only and should not be construed as investment or trading advice. Trading in commodities, stocks, futures, and options involves substantial risk of loss and is not suitable for every investor. Past performance is not indicative of future results. Always do your own research or consult with a qualified financial advisor before making any trading decisions. The author shall not be held responsible for any losses incurred from the use of this analysis.

ELLIOTT WAVE EURUSD H4 update
EW Trade Set Up H4
minute wave (ii) running
is not already clear wheter it will develope in a sideway or sharp correction usually wave 2 is sharp in a zigzag to 0.618 retracement value.
short term key levels (area)
1.1445
1.1425
1.1365 POC
1.1320
1.1220
SUI is building momentum!📈 CRYPTO:SUIUSD After a three-swing corrective pullback into the $3.3 - $2.7 buying zone, price is bouncing and setting up for the next upside move.
The structure is in place—let’s see if the breakout confirms!

GBPUSD → Countertrend retest of support before growthFX:GBPUSD is forming a countertrend correction to the zone of interest and liquidity while the dollar is stagnating. The market is waiting for a fundamental driver.
Within the uptrend, a countertrend correction is forming towards the liquidity zone at 1.342. Against this backdrop, the dollar is correcting and contracting towards support. The currency pair's price continues to decline, but within the uptrend, breaking the local structure but not the market character. The focus is on the current trading range of 1.342 - 1.359. A retest of support could bring the price back to resistance.
Support levels: 1.3421, 1.339
Resistance levels: 1.3507, 1.3593
A quick retest of the liquidity zone at 1.3421, the inability of GBPUSD to continue falling, a false breakdown, and the price consolidating above 1.3421 would be a good indication that buyers are trying to hold the market. In this case, we could see the price strengthen.
Best regards, R. Linda!

Bitcoin - Pump will continue! Sell here, thank me later.Bitcoin has been pumping in the past few days pretty massively. Why? There are 2 main reasons - the first reason is that Bitcoin has finished a major WXY corrective wave, and the second is that Bitcoin swept liquidity below a triangle (see my previous post for details). That was a very good opportunity to buy/long Bitcoin at that specific level I described in the previous analysis. But let's focus on the present and future!
We always want to find strong levels on the charts so we have a great entry point/take profit target. The next strong level is definitely the 0.618 FIB, which Bitcoin can hit in the very short term. Also, below the 0.618 FIB, we have a strong horizontal zone, which can also act as a strong resistance. Bitcoin should definitely go there and retest this zone.
We want to see how Bitcoin is going to react in the zone and FIB, but you can create a new limit order to short Bitcoin there so you don't miss anything. So currently I am temporarily bullish on Bitcoin, and in the next update I will make a big analysis on Bitcoin and a very likely scenario for the next months. What will the price of Bitcoin be in December? Please like/boost my idea right now.
Write a comment with your altcoin + hit the like button, and I will make an analysis for you in response. Trading is not hard if you have a good coach! This is not a trade setup, as there is no stop-loss or profit target. I share my trades privately. Thank you, and I wish you successful trades!

Posibility of Short in USDJPYAccording to this wave count, we could be at the beginning of wave C, based on Elliott Wave theory.
If the price respects the resistance level, we can enter a short position toward the support.

btc ready to reach for the stars...Elliot wave for btcusd showing upside targets. shallow retracement indicates strong pump incoming.


