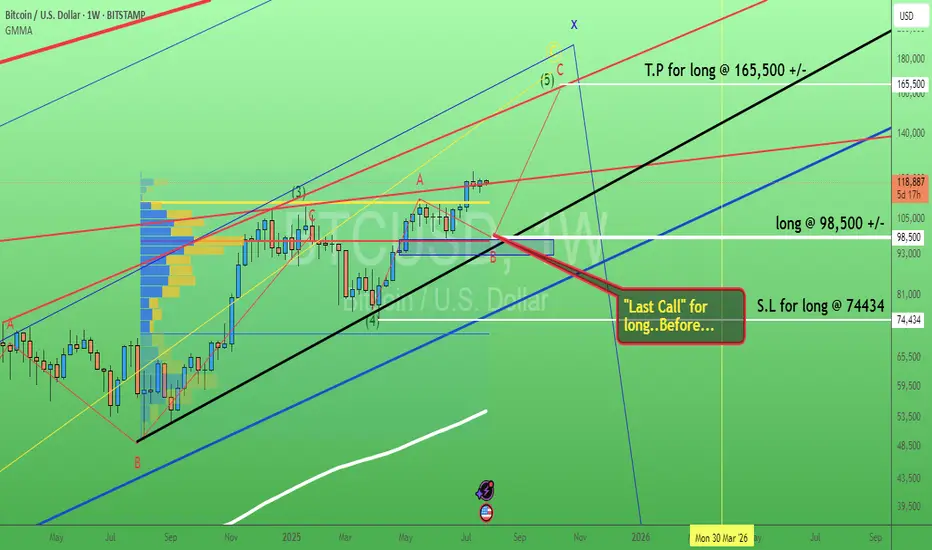
Bitcoin. Last call buy level? 29/July/25BTCUSD probably will have pullback toward confluence zone of 1) Trendline Support 2) Order Block 3) POC of volume before hitting ATH again
Elliott Wave
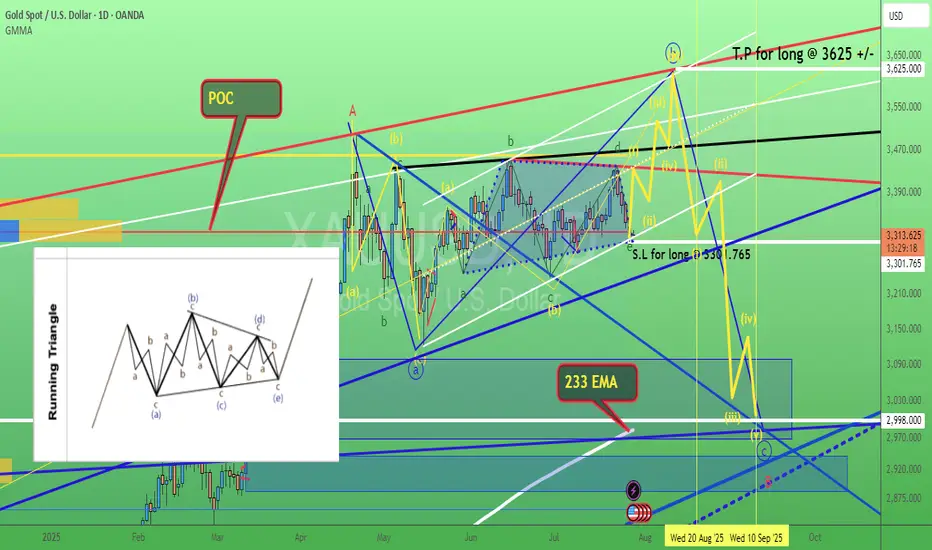
Gold. wave e (green) of triangle possible reached. 29/July/25XAUUSD based on speed of chart + confluence zone 1) Channel Support 2) POC of volume profile 3) Trendline support. Gold probably completed its wave e (green) of triangle.
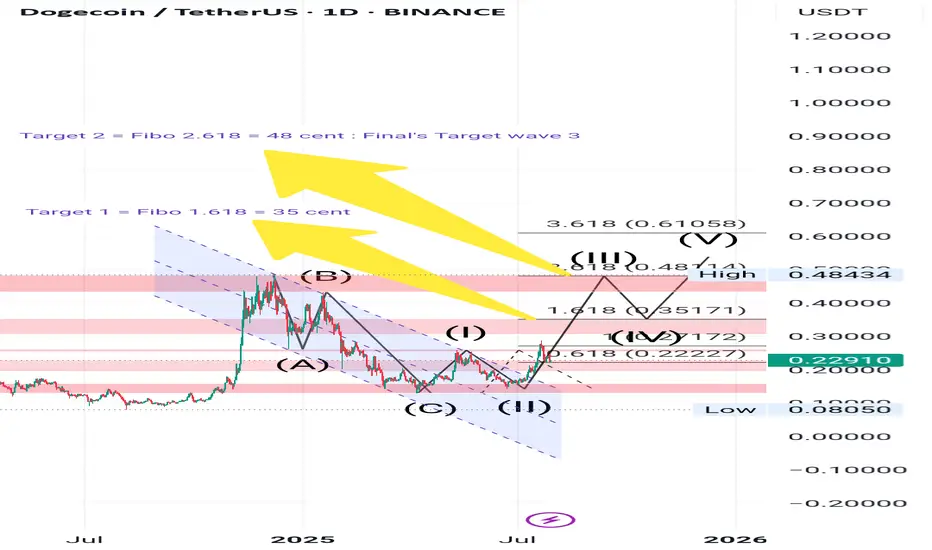
Doge: Daily TimeFrame: wave 3 ?! MaybeDogecoin chart on Daliy Timeframe.
Price is completing wave 3.
The targets are clearly visible on the chart.
Target 1 = 35 cent
Target 2 = 48 cent
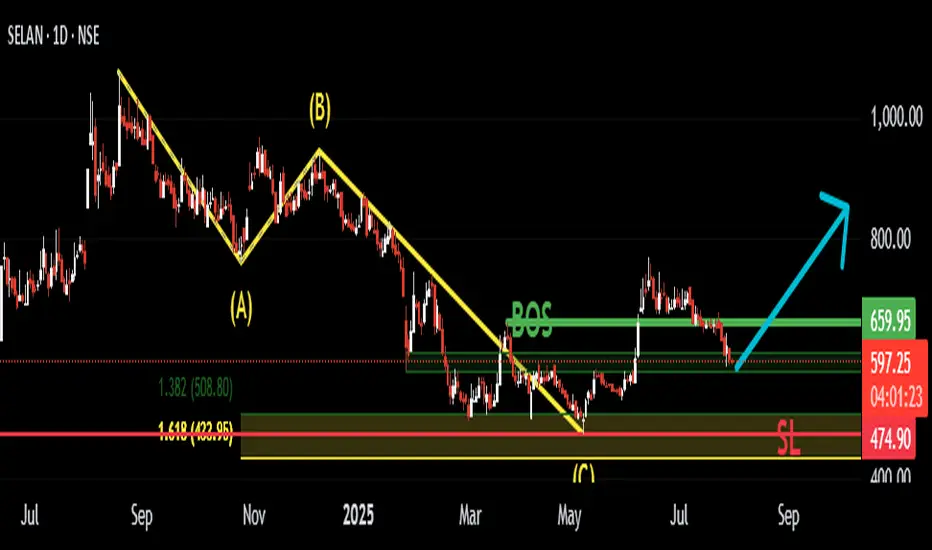
Petronet Long Setup: Wave C Ends at 1.382 of A–Breakout + RetestThis is a trend continuation setup on Petronet, based on Elliott Wave correction structure, Fibonacci confluence, and price action confirmation.
The stock recently completed a clean A-B-C corrective pattern, with Wave C terminating around the 1.382 extension of Wave A — a common Fibonacci exhaustion zone, often signaling the end of corrections.
Key factors supporting the long bias:
🌀 Wave C = 1.382 of Wave A, indicating potential completion of the correction.
🔍 A Break of Structure (BOS) was observed, confirming the shift in trend.
📈 Importantly, the BOS was marked by a strong bullish candle, adding conviction to the move.
🔁 Entry was planned on the retest of the broken resistance, which is now acting as support.
📊 Structure suggests we may now be entering a new impulse wave upward.
Risk Management Plan:
🛑 Stop-loss just below the Wave C low / support zone.
🎯 Targeting a minimum 1:2 Risk-to-Reward, aligned with the next impulse projection.
This trade favors confirmation over anticipation — by waiting for BOS + bullish candle + retest, the entry is more structurally reliable.
Elliott Wave Update: EURUSD Favors Weakness In To Support ZoneThe EURUSD favors upside in 3 swings from September-2022 low & should extend towards 1.1929 or higher against 1.13.2025 low. In 4-hour, it favors double correction lower from 7.01.2025 high to correct 5.12.2025 low. It favors short term pullback into 1.1512 – 1.1340 area in 7 swing pullbacks before continue rally in cycle from 1.13.2025 low. Above January-2025 low, it ended (1) at 1.0533 high, (2) at 1.0210 low, (3) at 1.1573 high, (4) at 1.1065 low & favors higher in (5). Within 4-hour, it placed 1 at 1.1830 high & correcting in 2 as double three correction before two more highs. It placed ((w)) at 1.1559 low in 3 swings zigzag correction. In ((w)), it ended (a) at 1.1659 low, (b) at 1.1714 high & (c) at 1.1559 low of 7.16.2025. Later, it unfolded expanded flat correction in ((x)) that ended at 1.1788 high of 7.24.2025. Within ((x)), it placed (a) at 1.1721 high, (b) at 1.1554 low & (c) in 5 swings at 1.1788 high.
Currently, it favors downside in ((y)) of 2 & expect sideways to lower in to support zone. It favors zigzag correction lower in ((y)) to finish 2 into extreme area before resume rally. Short term, it favors downside in (a) of ((y)) since 7.24.2025 high. In (a), it placed i at 1.1700 low, ii at 1.1771 high & favors downside in iii of (a) towards 1.1576 – 1.1569 area before bounce in iv. It expects a bounce soon in iv followed by one more push lower in v to finish (a) in 5 swings. Wave (a) of ((w)) should end near 1.1578 before bounce in (b) in 3 or 7 swings connector. The bounce in (b) should fail below 1.1788 high to extend lower in (c) into 1.1512 – 1.1340 area to finish correction. It should find next support into that area to rally higher as the part of daily sequence targeting 1.1929 or higher. We like to buy in to that area for next leg higher or at least 3 swings bounce. If it breaks above 7.01.2025 high, it expects two more highs to finish cycle from January-2025 before next pullback start.

XAU/USD – Current Wave Count & Potential ScenariosOANDA:XAUUSD
We are currently moving from (white) wave 3 to (white) wave 4.
So far, I am leaning towards the white count where the waves labeled (A), (B), (C) form a larger corrective wave A, which leads to wave B, and then to (white) wave 4.
Up to now, we have only completed (A) and (B).
Now, in the yellow bracket, we can interpret a 1-2-3-4-5 structure leading to (white) wave C 🟡.
Alternatively, one could interpret a triangle pattern (pink count):
Waves A, B, C, D, E, which would then form our wave 4.
In that case, we would expect bullish targets afterwards 🚀.
We need to watch closely if the price reverses or breaks through our yellow Fibonacci zone 🟡.
For now, we are primarily looking for upside potential 🔼.
From our yellow wave 2, we saw a downward push, which could theoretically be our yellow wave 1 leading into yellow wave 2 and the yellow Fibonacci zone — essentially a five-wave move from wave 2 to wave 3.

BTCUSD lower toward <113,000-ishI think we are in an Elliotwave A-B-C-D-E pattern, whereas E is delevoping. Price target toward $112,319 - $113,925
From a daily perspective, we can go as lower towards the $95k's...but let see where the next few days takes us.
I'm wrong is we break/close $119,826

NASDAQ Potential UpsidesHey Traders, in today's trading session we are monitoring NAS100 for a buying opportunity around 23,140 zone, NASDAQ is trading in an uptrend and currently is in a correction phase in which it is approaching the trend 23,140 support and resistance area.
Trade safe, Joe.

NASDAQ Potential UpsidesHey Traders, in today's trading session we are monitoring NAS100 for a buying opportunity around 23,300 zone, NASDAQ is trading in an uptrend and currently is in a correction phase in which it is approaching the trend at 23,300 support and resistance area.
Trade safe, Joe.

GBPNZD BullishAfter exiting a correction, the first impulse (Wave 1) appears. I expect a retracement of at least 50% of the Fibonacci.

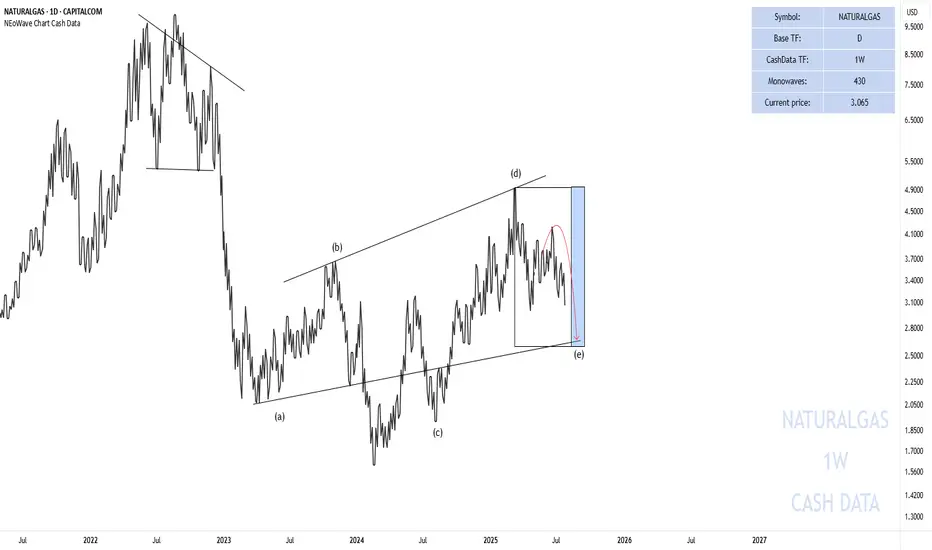
End of the Wave-(e) Natural Gas
In the previous analysis I said that:
Currently, wave-(e) is forming and I do not expect a strong upward movement until August 12-September 12 and this wave can take time until the time range I specified for it.
In the picture you can see that the price has started to decline again exactly from where we specified and has fallen by 27% so far. The price is not necessarily going to fall to 2.66 but time must pass and the price must enter the specified time range.
Good luck
NEoWave Chart
EURUSD_1D_SellEurodollar Analysis Medium-term Time Elliott Wave Analysis Style The market can enter a downtrend due to the completion of five ascending waves, which will be in the form of three ABC waves Important and main resistance number 1.1666 Target 1.0800

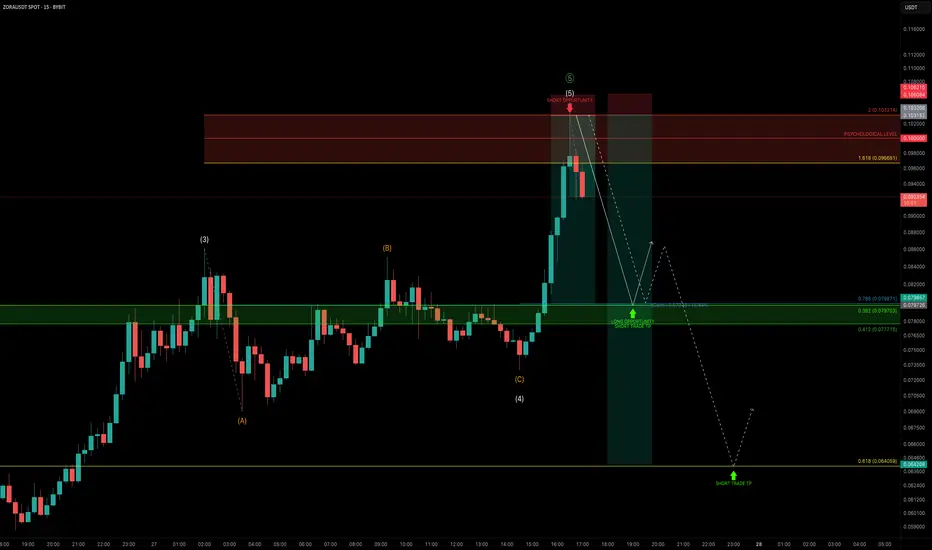
ZORA — Parabolic Rally Nearing ExhaustionZORA has been on an explosive run, pumping +1239% in just 20 days. But after such a vertical move, the question is:
Is this rally nearing exhaustion?
Let’s dive into the technicals 👇
🧩 Elliott Wave Structure
Looking at price action through the lens of Elliott Wave Theory, ZORA appears to be completing its 5th wave:
➡️ Wave 3–4 zone: Held around the $0.05 trading range
➡️ Wave 5: Now pushing into the $0.097–$0.103 zone
This area aligns with:
The 1.618–2.0 Fib extension pocket — a typical exhaustion zone for wave 5s
The $0.10 psychological level
🔴 Short Trade Setup
This zone between $0.097–$0.103 is the ideal reversal area to consider shorting, with clearly defined targets and confluence:
Entry: $0.097 – $0.103
Stop-Loss: Above the 2.0 Fib Extension
TP1: Around $0.08
TP2: Around $0.064
Confluence: TP1
Daily Open (dOpen)
0.786 Fib of the local move
0.382 Fib of the 5-wave structure
TP2 (Lower Target):
0.618 Fib retracement of the 5-wave move at $0.064
Risk-to-Reward:
TP1 gives an R:R of 1:8
TP2 offers potential 1:13+
Watch for signs of weakness.
_________________________________
💬 If you found this helpful, drop a like and comment!
Want breakdowns of other charts? Leave your requests below.
DXY bullishDXY is in the early stage of a bull market, so no one want dollars but in my view but the trend is your friend.
This could be a impulsive 5 of 5 or a B of ABC but both are bullish, another view is that the EURO have been a bad day when the US and EU reach tariff agreement??
The lagging indicators are changing or I hope, but this bullish trend for the Dollar could continue for weeks...

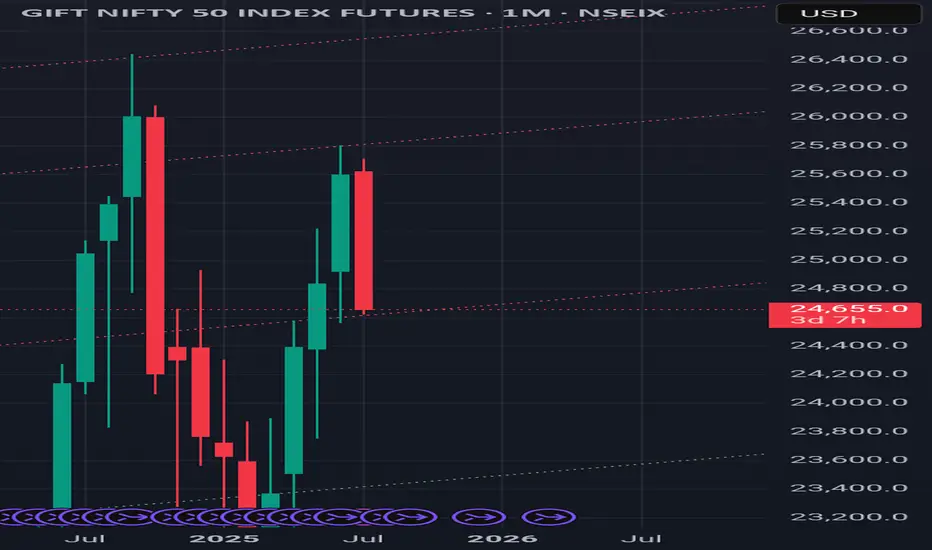
I think it's today.I admit that today's Nifty surpassed below yesterday's 24800 level, and my rash assumption that this level would act as a strong reversal support was wrong. But my overall opinion hasn't changed: there's a good chance the market will correct this whole wave 1 decline if the GIFT Nifty support level of 25620 isn't broken by tomorrow.
Elliott wavefollow abc wave structure to complete big wave A, enter 3290 area
buy limit 3290-3295, stoploss 3285, tp 3330

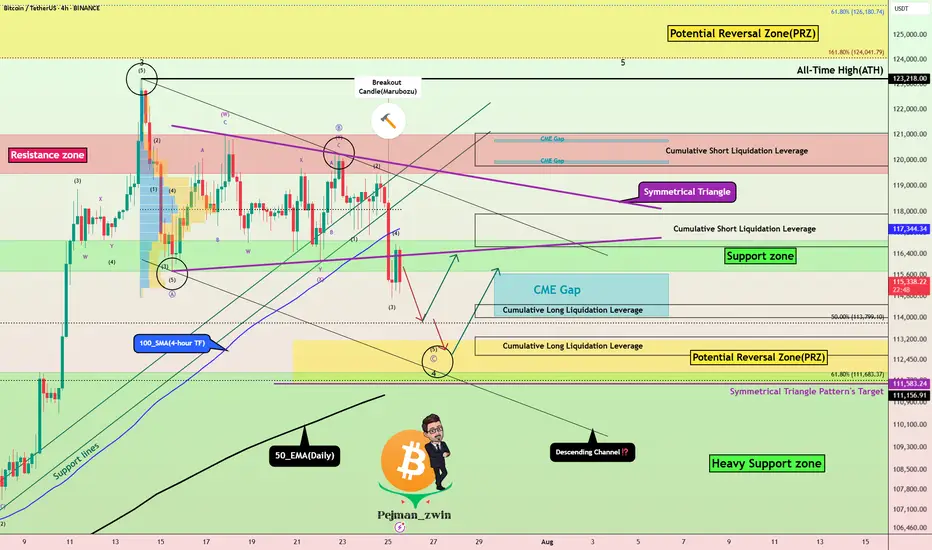
Bitcoin Correction Maturing – Long Setup Brewing!Bitcoin ( BINANCE:BTCUSDT ) has fallen by more than -4% over the past day.
Let's take a look at the reasons for the decline.
One of the key reasons behind Bitcoin’s decline in the past 24 hours ( July 25 ) could be the reduced likelihood of Jerome Powell being replaced as Chair of the Federal Reserve.
In recent days, market participants were speculating that Donald Trump might replace Powell — a scenario that was considered bullish for risk assets like Bitcoin. However, recent reports of a meeting between Trump and Powell, and signs that Powell might not be dismissed, have weakened this fundamental narrative.
This meeting may signal a truce or reduced tension between Trump’s team and Powell , which could imply a continuation of current Fed policies. That’s bad news for Bitcoin, as it removes a potential psychological tailwind from the market and dampens speculative sentiment.
As a result:
Over $500 million in liquidations(Long Positions) occurred
Weak inflows into Bitcoin ETFs
A stronger U.S. Dollar Index ( TVC:DXY )
And declining Gold( OANDA:XAUUSD ) prices over the past two days
all added additional selling pressure on BTC. Now let's take a look at Bitcoin's conditions on the 4-hour time frame .
Bitcoin currently appears to have broken the Support zone($116,900-$115,730) , Support lines , 100_SMA(4-hour TF) , and the lower line of the Symmetrical Triangle Pattern with a bearish Marubozu candle .
Note : In general, trading was difficult when Bitcoin was inside a symmetrical triangle (about 10 days).
It also seems that the pullback to these zones has ended and Bitcoin is waiting for the next decline .
In terms of Elliott Wave theory , Bitcoin appears to be completing microwave 5 of microwave C of major wave 4 . There is a possibility that main wave 4 will create a descending channel and complete at the bottom of the descending channel (at Potential Reversal Zone(PRZ) ).
I expect Bitcoin to start rising again after completing the CME Gap($115,060-$114,947) from Cumulative Long Liquidation Leverage($114,480-$114,000) or Cumulative Long Liquidation Leverage($113,284-$112,603) near the PRZ and Heavy Support zone($111,980-$105,820) .
Cumulative Short Liquidation Leverage: $117,904-$116,665
Cumulative Short Liquidation Leverage: $121,046-$119,761
Do you think Bitcoin has entered a major correction, or does it still have a chance to create a new ATH?
Please respect each other's ideas and express them politely if you agree or disagree.
Bitcoin Analyze (BTCUSDT), 4-hour time frame.
Be sure to follow the updated ideas.
Do not forget to put a Stop loss for your positions (For every position you want to open).
Please follow your strategy and updates; this is just my Idea, and I will gladly see your ideas in this post.
Please do not forget the ✅' like '✅ button 🙏😊 & Share it with your friends; thanks, and Trade safe.
Gold. Bull Trap "triangle". 28/July/25XAUUSD, by checking gold latest speed of chart with its cycle. we might have a bull 'trap" triangle. A base for rallying to ATH again before a very deep pullback toward 233 Daily EMA which have not been "touched" for long time...

USDJPY Potential UpsidesHey Traders, in today's trading session we are monitoring USDJPY for a buying opportunity around 147.800 zone, USDJPY is trading in an uptrend and currently is in a correction phase in which it is approaching the trend at 147.800 support and resistance area.
Trade safe, Joe.

Elliott waveAccording to the bearish structure, the ABC wave is completed, there are 5 more bearish waves.
Sell 3334, stoplos 3344, tp 3310

EURJPY → Retest support before growthFX:EURJPY has been correcting since the opening of the European session. The movement was triggered by yesterday's news related to the trade deal between the US and Europe...
EURJPY is reacting to news related to the deal between the US and Europe. A correction is forming amid the fall of the euro, but against the backdrop of the dollar's growth, the currency pair has a chance to rise if the bulls keep the price in the buying zone relative to the support level of 173.08.
The dollar is rising, and against this backdrop, the Japanese yen is falling. Bulls have every chance of holding their ground above the previously broken resistance. If the market confirms support, we will have chances for growth.
Resistance levels: 173.87
Support levels: 173.082, 172.47
The currency pair may form a liquidity trap relative to the previously broken consolidation resistance. A false breakdown of support and price consolidation in the buying zone (above 173.1) could trigger further growth.
Best regards, R. Linda!

Gold (XAU/USD) Daily Trading Plan - 28th July 2025🔺 Technical Analysis
Gold opened the Asian session this week with a slight retracement, testing the 0.382 Fibonacci Retracement level before bouncing back strongly to last week's closing price around 3339. This move further solidifies the price action from a technical perspective.
Notably, gold has broken through a minor resistance on the M15 timeframe, invalidating the bearish structure and forming a full-bodied H1 candle. This sets the stage for a potential corrective uptrend to unfold.
On the Daily timeframe, the initial session's decline retested the bullish trendline and bounced back within the boundaries of the flag pattern. It's likely that this week, the price will continue towards the end of this pattern, providing a clearer confirmation of the medium-term trend.
🔺 Key Macroeconomic News
This week promises to be volatile with several crucial economic announcements, particularly as it marks both the end of the month and the start of a new one. Two key events that traders should pay close attention to are:
FOMC Interest Rate Decision: Always a focal point for the market, with significant impact on safe-haven assets like gold.
Non-Farm Payroll (NFP) Report: Vital US labour market data, capable of triggering substantial movements in both the USD and gold.
Therefore, be prepared for potential market shocks and exercise careful risk management.
📈 Trading Strategy & Considerations
Given the technical setup and upcoming macroeconomic events, consider the following:
Potential Corrective Uptrend: The invalidated bearish structure on M15 and the strong H1 candle suggest a short-term bullish bias for a corrective move.
Daily Flag Pattern: Monitor price action as it approaches the end of the flag pattern on the Daily timeframe for medium-term trend confirmation.
High Volatility Ahead: Exercise extreme caution around the FOMC and NFP announcements. These events can lead to significant and rapid price swings.
Risk Management: Prioritise strict risk management. Consider reducing position sizes or employing wider stop-losses during high-impact news events.
Disclaimer: This analysis is for informational purposes only and does not constitute financial advice. Trading involves significant risk, and you should only trade with capital you can afford to lose.

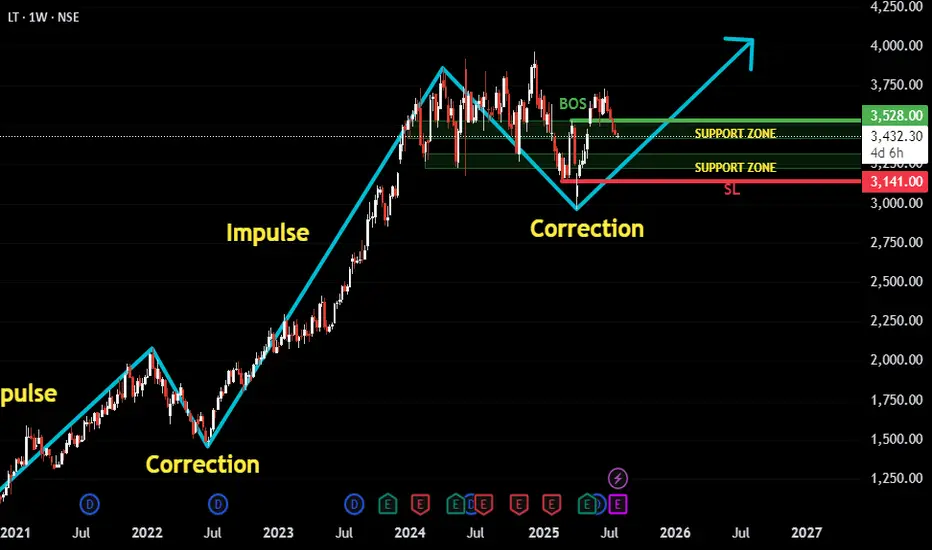
LT Following Classic Impulse-Correction Rhythm.This is a trend-following setup on LT (Larsen & Toubro) where we’ve observed a clear repeating pattern of Impulse → Correction → Impulse. The recent price action suggests that the latest correction has matured, and the structure now hints at a potential next impulse wave beginning.
Here’s the thought process behind the setup:
✅ The stock has been trending upward in a clean impulse-correction rhythm.
🕒 We waited patiently for the correction phase to develop fully and mature.
🔄 A Break of Structure occurred, signaling potential trend continuation.
🔁 Retest on support zones further strengthens the bullish case.
🧭 Support zones are drawn from the Daily chart for precision, though this post is based on the Weekly timeframe for broader trend visibility.
🛡️ Stop-loss can be maintained near ₹3141, just below key support.
🎯 Target is based on a 1:2 Risk-to-Reward setup, aligning with disciplined trading strategy.
Overall, this is a classic example of waiting for confirmation after correction before re-entering in the direction of the dominant trend.
As always, risk management is key. Watch how price behaves around the recent structure and support zones for validation.