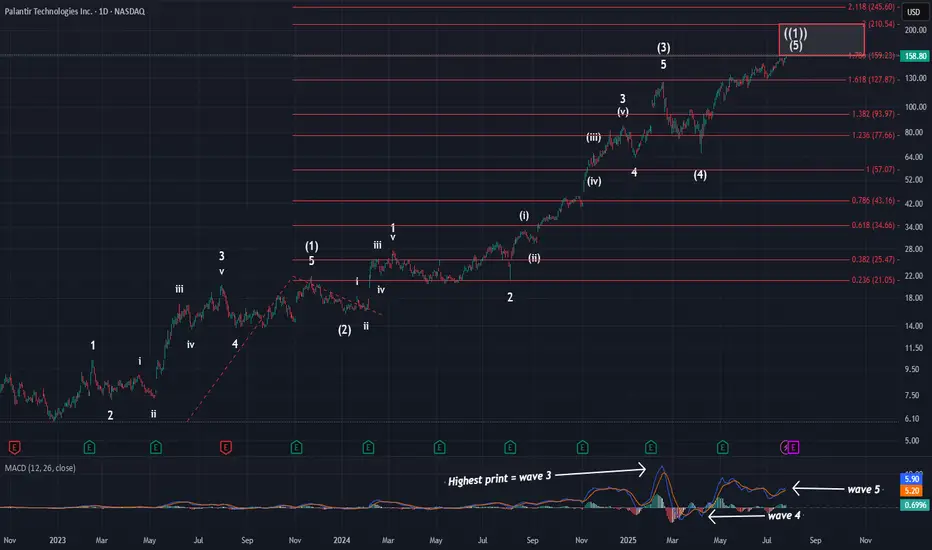
PalantirOn Friday, price hit the 1.236 extension and the larger red 1.786 extension @ $159. Tonight, I wanted to zoom out to show you where price is in the grand scheme of things. As you can see, we have all of the needed waves in place to consider this larger pattern complete. We have finally hit the standard target box for primary wave ((1)), and almost finished on what I am calling a smaller degree ED. This means that the reversal is soon at hand and that the initial move lower will be swift.
This primary wave ((1)) has lasted over 2.5 years. However, there is no way to predict exactly how long primary wave ((2)) will last. It could be short, or it could be long. Primary waves typically last months to even years to complete. Given the length of wave ((1)), I think it is safe to say wave ((2)) is likely to last over 1 year at the minimum. When our consolidation does kick off, we should be targeting the $50-$80 range for completion. Again, that won't happen fast. I will very likely take at least a year to complete.
For now, though, in the short term this pattern is putting the finishing touches on. Seeing this zoomed out picture again hopefully puts into perspective exactly how close we are to completion.
P.S: Looking at MACD, you can see I have labeled the larger waves. You can also see how much hidden bearish div we have at this time.
Elliott Wave
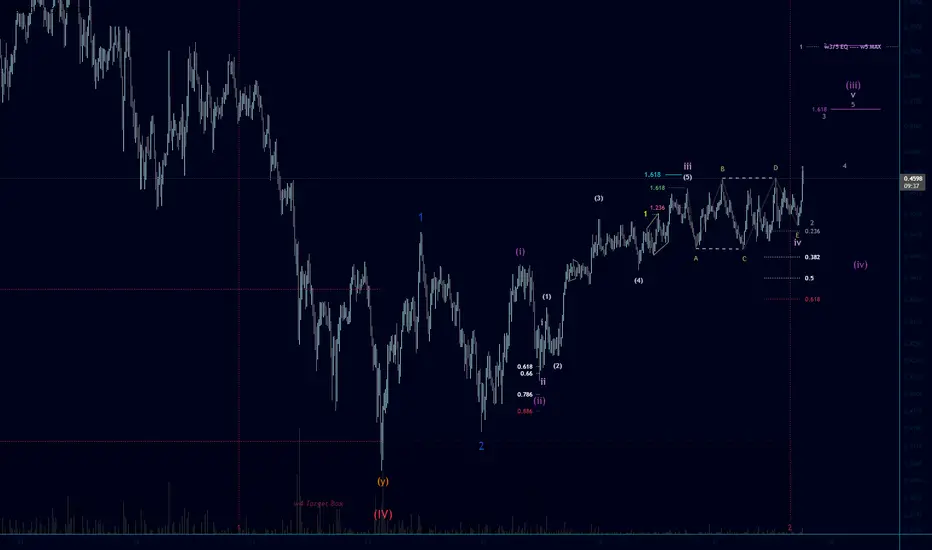
Arbitrum Bullish Elliott Wave Scenario! It seems the wave 4 Expanding Flat correction idea (previous post) played out well with our fib time and price targets! Always a good thing to have the right look in your wave count, fib time and price projections paired with the Elliott Wave rules and guidelines... its a whole other feel to my trading psychology and it gives me more confidence in the end. Breaking to the upside in the first of a few nested wave 3s, so i expect a bullish run up. (Keep in mind we finished red wave 4 just past the 1:1 fib time), if we are in a complex wave 4 still, it could easily extend to the 4 fib time without affecting probabilities. Starting to love this haha. Happy Trading 🌊🧙♂️
Bitcoin could go up again nowHi traders,
Last week Bitcoin made a Zigzag (break of previous low into the bullish Daily FVG) as I've predicted in my outlook.
After it came into the Daily FVG, price went up again.
Now if we see a small correction down, we could see the next impulsive wave up to a new ATH.
Let's see what the market does and react.
Trade idea: Wait for a correction down to finish.
Then after an impulse wave up, a small correction down on a lower timeframe and a change in orderflow to bullish you could trade longs.
NOTE: the next three weeks I'm on holiday so I will not post any outlooks publicly.
If you want to learn more about trading FVG's with wave analysis, please make sure to follow me.
This shared post is only my point of view on what could be the next move in this pair based on my analysis.
Don't be emotional, just trade your plan!
Eduwave

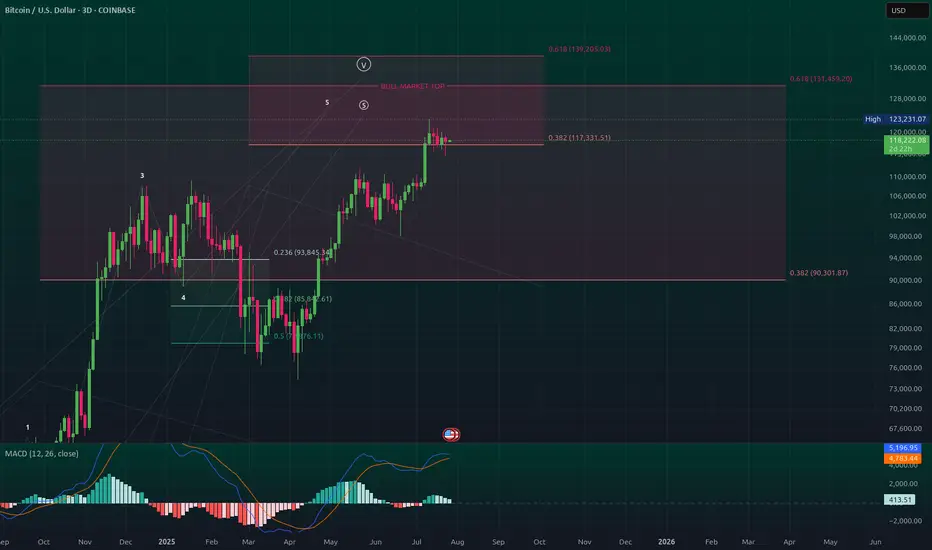
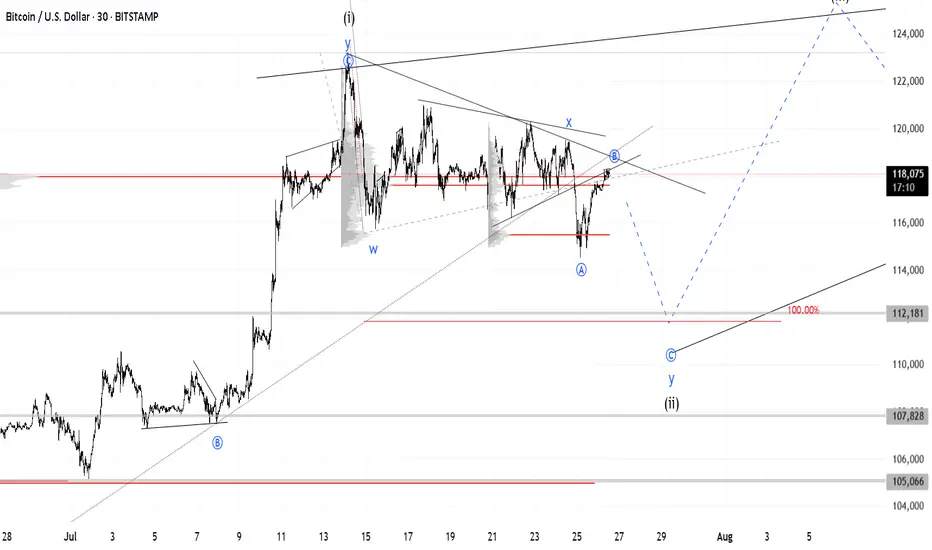
Pessimistic scenario for BITCOINAfter Bitcoin touched the price of 123,218, it entered a corrective phase. According to previous analysis, we expected the price to touch the range of $115,000-113,000. With the formation of more waves, it seems that the recent correction that started on July 14, 2025 is a diametric (bowtie) where waves f and g of this diametric are not yet complete and this pattern is part of a higher degree diametric and after this pattern is completed I expect a move towards the range of 140,000-150,000
Pessimistic scenario:
The pessimistic scenario is that this wave becomes a double pattern and enters the price range of wave-b (marked with a red dashed line) of the higher degree diametric. The probability of this scenario occurring is low and I consider the first scenario more likely, but we must be prepared for all market movements.
Good luck
NEoWave Chart

It still looks like a Triangle on goldHi traders,
Last week gold made an impulsive wave up but after that it dropped very hard.
If gold is still in a Triangle we could see a correction up and one more move down for wave E. But if price closes below (orange) wave C then the pattern is changed.
Let's see what price does and react.
Trade idea: Wait for the pattern to finish. Then wait for an impulsive move up and a small correction down on a lower timeframe and a change in orderflow to bullish to trade longs.
NOTE: The next three weeks I'm on holiday so I will not post any outlooks publicly.
If you want to learn more about trading FVG's & liquidity sweeps with wave analysis, please make sure to follow me.
This shared post is only my point of view on what could be the next move in this pair based on my technical analysis.
Don't be emotional, just trade your plan!
Eduwave

SPX500USD is on a riseHi traders,
Last week SPX500USD started the next impulse wave 5 (grey) as I've said in my outlook.
Next week we could see more upside for this pair.
Let's see what the market does and react.
Trade idea: Wait for a small pullback and a change in orderflow to bullish on a lower timeframe to trade longs.
NOTE: the next three weeks I'm on holiday so I will not post any outlook publicly.
If you want to learn more about trading FVG's & liquidity sweeps with Wave analysis, then please make sure to follow me.
This shared post is only my point of view on what could be the next move in this pair based on my technical analysis.
Don't be emotional, just trade your plan!
Eduwave

More upside for EUHi traders,
Last week EU went higher for the start of the next (impulsive or corrective) wave up as expected.
Next week we could see price go higher to finish (red) wave 5 but price is slowing down.
So the next big impulsive wave down is coming soon.
Let's see what the market does and react.
Trade idea: Wait for the finish of a correction down and a change in orderflow to bullish on a lower time frame to trade longs.
NOTE: the next three weeks I'm on holiday and I will not post any outlook during this period publicly.
If you want to learn more about trading with FVG's, liquidity sweeps and Wave analysis, then make sure to follow me.
This shared post is only my point of view on what could be the next move in this pair based on my technical analysis.
Don't be emotional, just trade your plan!
Eduwave

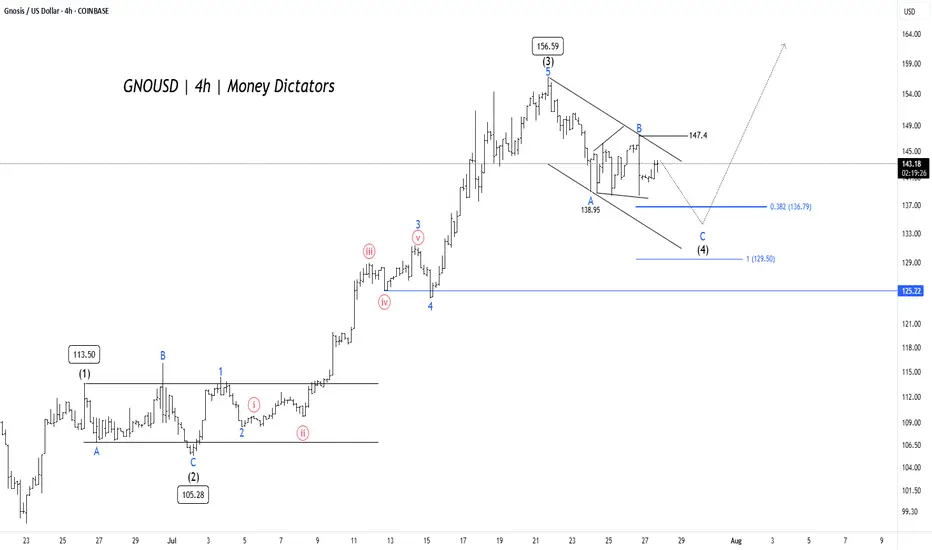
GNO/USD Price Action Aligns for Final Wave 5 PushGNO/USD pair is unfolding a clean Elliott Wave impulse pattern on the 4-hour chart. The rally began with Wave (1) reaching 113.50, followed by a corrective Wave (2) that bottomed near 105.28. This set the stage for a powerful Wave (3) that surged to 156.59, aligning well with Elliott Wave theory where Wave 3 is typically the strongest and steepest leg in the sequence.
Wave (4) is now in progress, taking the form of an A-B-C correction inside a descending channel. Interim support was found at 138.95 during Wave A, and Wave C could extend toward the 0.382 Fibonacci retracement level at 136.79 or the deeper support zone near 129.5. These levels are crucial, as they often mark the end of a corrective phase and the beginning of the next impulse. A confirmed breakout above 147.4 would signal the start of Wave (5) and the return of bullish momentum.
Short-term targets have the potential to reach 135 – 128 , while 125.22 remains the invalidation level for this bullish setup. After the completion of Wave (4), traders can look for long opportunities targeting 147 – 154 – 172 . As long as the structure holds and price respects key supports, the outlook remains favorable for a fresh push higher in Wave (5).
NIFTY50.....Miss a final sell-off!Hello Traders,
the NIFTY50 is moving within a sideways-range. It ranges from a possible wave ((iii)), with a green high @ 25116 and a low of 24508, the end of a wave z (pink) of a wave (w)/(a) of ((iv)) green!
What can we expect for the coming days?
I think, the final low is not in the cards yet! I miss a final "sell-off" that will take N50 down into the range of the rectangle, sky-blue, for the coming days. That means, a possible finale low would be around the 24473 to 23935 points.
If so to come, a break of the 25250 area probably would open the door to 25580 area in the next 2 weeks. If this high were to occur, it would end wave ((iii), in pink, with a wave (iv), pink, to follow. Seasonally, that would fit well into the structure 'til end of September/ mid-October!
Anyway! As can be seen at the 3h chart, there is a divergence at RSI (standard deviation 14). This, more often than not, indicates a change of trend, in this case to the upside! However, the daily RSI has room to decline for the reminder of the week.
So, again. The structure seems to be not done to the downside, and I expect a new low, below the Friday's low, to come.
Have a great week.....
Ruebennase
Please ask or comment as appropriate.
Trade on this analysis at your own risk.

GBPJPY LONGHello, as you can see on the GBPJPY chart, there is a very strong support zone that price has not broken. In fact, we can also identify a fake breakout below that level, which reinforces the strength of the support.
My first target (TP1) is set at the next strong resistance zone, which aligns with a previous support turned resistance. The second target (TP2) is the Order Block (OB) at the top, which also aligns with where my strategy predicts the price will move. This setup suggests a potential bullish move from the current levels.

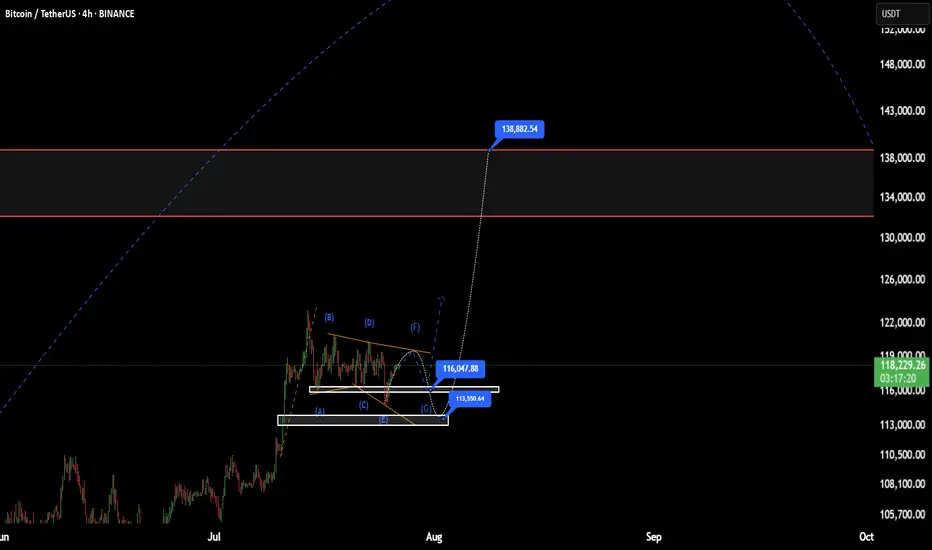
BTC(based on NEo wave)This range price is shown as a bow-tie diametrical.
I think G wave will end at one of those prices, 113 or 116
after this it will start a good bullish wave.
stop loss is 110K and the first target is 138K.
Bitcoin – “topping-zone” update, grounded in the play-book 1️⃣ Big-picture wave count
We are deep inside cycle wave ⑤; sub-wave ③ delivered the textbook power surge, and price has now produced the final “pin” beyond the wedge roof – a move that often marks the last heartbeat of a fifth wave before the engine cools
.
The spike paused almost exactly at a 1-for-1 projection of wave ①, which is one of the three classic objectives for a non-extended wave ⑤ (0.618 ×, 1.0 × or 1.618 × wave ①)
.
Translation: price has reached the textbook exhaustion zone that the slide deck flags as “start thinking about profit-taking”.
2️⃣ What the internals are whispering
The manuals remind us that momentum should start to lag into a wave ⑤ – that’s exactly when bearish divergence appears and warns that the impulse is running out of stamina .
We now have that divergence across the three-day pane, lining up perfectly with the theory. In the past, that signal has kick-started either:
a shallow wave-four-type pullback (23.6 – 38.2 % of the entire leg) if the up-trend is still healthy, or
a full ABC retrace back to the 38 – 50 % pocket when the whole five-wave sequence is complete.
3️⃣ Fibonacci map – unchanged edges, new mid-points
Layer Why it matters (per slides)
117 k – 118 k 0.382 extension cluster and sub-wave ③ peak – first ceiling.
123 k wick 1.0 × wave ① – often the maximum for a regular wave ⑤
.
126 k – 131 k 1.618 overlay of the sub-waves – only reached if wave ⑤ “blows off”.
109 k 23.6 % retrace of the whole advance – first landing pad for a normal pullback
.
103 k – 99 k 38–50 % retrace – where a completed impulse usually rests before the next macro move.
4️⃣ Likely path from here (probabilities courtesy of the slide guidance)
Scenario Odds What you’d expect? How the slides back it up?
Truncated top – the wick was the high ~60 % Price rolls over swiftly; three-leg drop towards 109 k unfolds within weeks. Divergence in a ⑤ is a tired market; truncated fifths are common when wave ③ was extended
.
Mini blow-off to 126–131 k ~30 % Market reclaims the wedge roof quickly, squeezes short sellers, then stalls at 1.618 cluster. Slides label 1.618 × wave ① as the “stretch target” for an extending ⑤
.
Magazine-cover 139 k print <10 % Needs vertical follow-through and no weekly divergence – neither is present. Only seen when sentiment is euphoric and momentum refuses to fade (not the case now).
5️⃣ How to turn this into trades (slide-rule style)
Trail profits, don’t chase: the slide on “profit-taking in wave ⑤” recommends feeding the position back to the market once equality or 0.618 targets print, rather than waiting for a collapse
.
Watch the 23.6–38.2 % retrace band: that zone is the historic sweet spot for a healthy reset after a parabolic run; if price bounces there with improving momentum, the up-trend can restart
.
If— and only if—price vaults the wedge roof again, leave a runner for 126–131 k, but tighten stops using the 78.6 % trailing method highlighted in the slides.
In plain English
Bitcoin has done everything a late fifth wave is supposed to do: overshoot a channel, tag a textbook fib target, and lose its breath while momentum lags. That doesn’t guarantee an immediate plunge, but history – and the curriculum we’ve been working through – say a meaningful pullback is now the path of least resistance. Prepare for a cooling phase toward the low-100 k region; if we sprint instead, treat it as a bonus round, not the baseline.
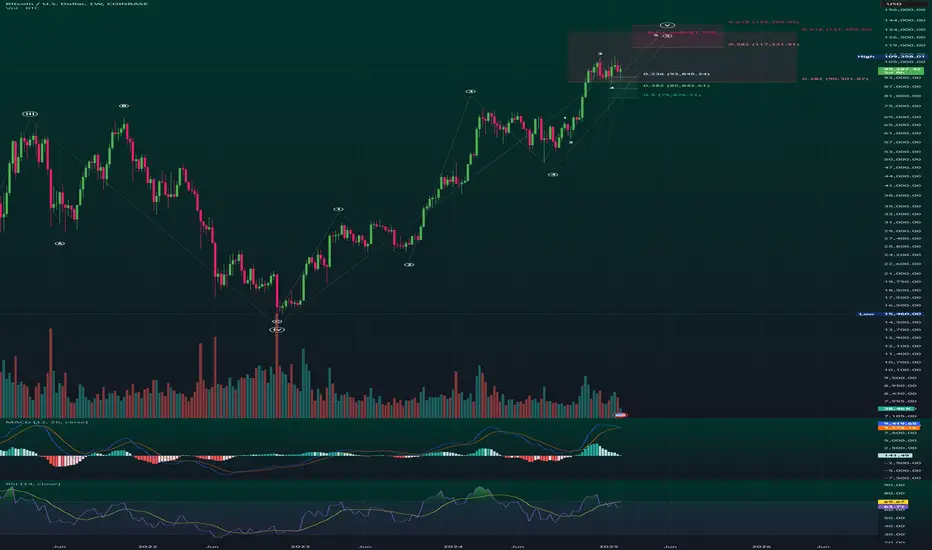
Bitcoin (BTC/USD) Weekly Analysis. Bull Market Top1️⃣ Key Market Structure - Elliott Wave Analysis
📉 Elliott Wave Progression:
BTC is in Wave 5️⃣, which historically marks the last bullish impulse before a potential correction.
Wave 3️⃣ was strong, confirming the trend continuation.
Now BTC is approaching the potential Bull Market Top 🚀.
🟢 Current Market Position:
BTC is forming Wave 5, targeting $117K - $139K as per Fibonacci extensions.
The final Wave 5 completion zone is projected within this range.
2️⃣ Fibonacci Retracement & Extension Levels
📊 Fibonacci Levels to Watch:
📍 0.236 Retracement: $93,845.34 ✅ (Minor pullback support)
📍 0.382 Retracement: $85,842.61 ✅ (Stronger correction zone)
📍 0.5 Retracement: $79,876.11 ⚠️ (Critical mid-level support)
🎯 0.382 Extension: $117,331.51 (Potential first target resistance)
🎯 0.618 Extension: $139,205.03 (Bull Market Top Projection)
📌 BTC Weekly High: $109,358.01
📈 BTC Current Price: ~$99,449.97
3️⃣ Technical Indicators - Confirmation Signals
📊 MACD (Momentum Indicator)
✅ MACD Histogram is still positive ➝ Confirming bullish momentum.
⚠️ Flattening MACD lines ➝ Indicates momentum might be slowing.
📊 RSI (Relative Strength Index):
🔼 RSI is near overbought zone (~69-70)
⚠️ Possible local top - BTC might need a correction before further upside
4️⃣ Key Support & Resistance Zones
🛑 Major Support Levels:
🟢 $93,800 (0.236 Fib - Short-term pullback zone)
🟢 $85,800 (0.382 Fib - Stronger correction zone)
🟢 $79,800 (0.5 Fib - Must hold support for long-term bullish trend)
🎯 Resistance Levels - Price Targets:
🔴 $109,000 (Current High - Short-term resistance)
🔴 $117,000 (First Major Resistance - 0.382 Fib Extension)
🚀 $131,000 - $139,000 (Bull Market Top Zone - 0.618 Fib Extension)
5️⃣ Trading Strategy & Market Outlook
💹 Bullish Bias Until BTC Breaks Below $93,800
🎯 Target Areas for TP (Take Profit):
✅ Conservative Traders: Exit near $109,000 - $117,000
✅ Higher Risk Targets: $131,000 - $139,000
⚠️ Risk Management:
🛑 Stop-loss: Below $93,000 to protect against a deeper correction.
📈 Scaling In: Consider adding positions if BTC retraces to the 0.382 ($85,800) or 0.5 ($79,800) Fibonacci level.
💡 Summary & Final Thoughts:
✅ BTC is in the final Elliott Wave 5 move, targeting a potential Bull Market Top of $131K - $139K based on Fibonacci extensions.
⚠️ However, RSI is overbought, and MACD momentum is slowing, meaning a pullback to $93K or $85K is possible before the next move higher.
🚀 Bullish until BTC breaks below key supports. Watch $109K and $117K for short-term resistance.
📊 Strategy: Hold long positions with profit-taking targets at $117K, $131K, and $139K. Use $93K as a support level for risk management.
#QS - 4HR [Will the last boost last or will it bust? With a new Volkswagen investment and partnership. Quantum Scape’s earnings were far from stellar with a 26% decrease in income compared to same time last year. They have, nevertheless, made advancements with their very promising lithium-Metal battery technology.
With fundamentals aside, I am curious to gauge how long-term investors have priced-in the company's stock price.
Technically, I see price moving to present yet another opportunity by EOY if not sooner. My count shows important levels to watch.
Go #QuantumScape, Go!!!
Check out my other chart ideas @CaxhPrince everywhere.

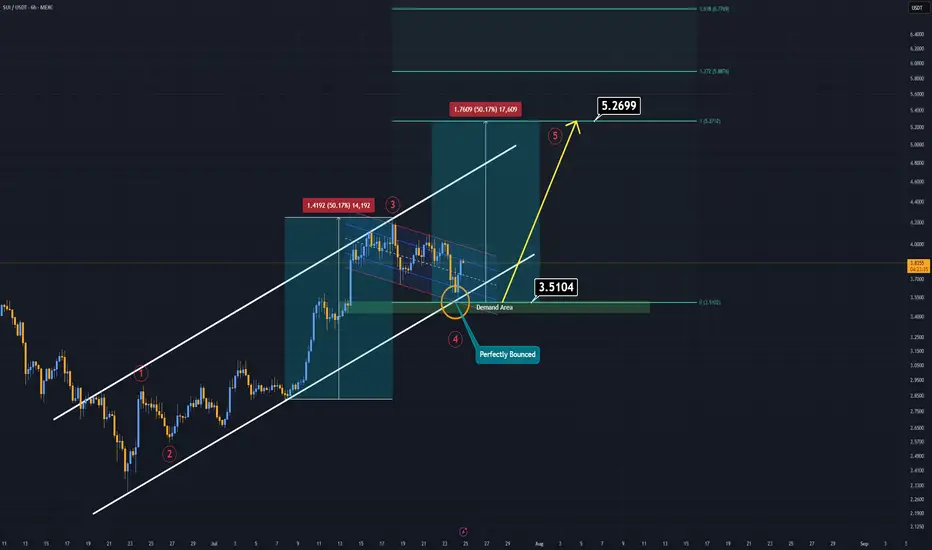
SUI Analysis (6H)If you're on the hunt for extreme risks and potentially high rewards — SUI might be calling your name.
Currently, SUI is trending within a well-respected ascending channel, and just today, it tapped both the demand zone and the lower boundary of this channel.
That’s what we call a double support, and it often signals a strong potential bounce.
SUI now appears to be forming a bullish flag pattern. If this formation breaks to the upside, it could trigger the fifth impulsive wave in line with Elliott Wave Theory.
In such a case, the main target is projected around $5.00–$5.20.
Extreme setups demand extreme conviction.
Good luck.
Long term Bitcoin view: the path to $100kI think Bitcoin will make a correction in the short run. The next target price can be $42k.
However I predict further gains in price in the mid run. The target of $100k may be achieved then. Though it is a far stretched number, I still expect a price move to that level.
If fail, we can expect a complex correction for the next 2-3 years. Final long term target will be above $100k.
#BTCUSDTP

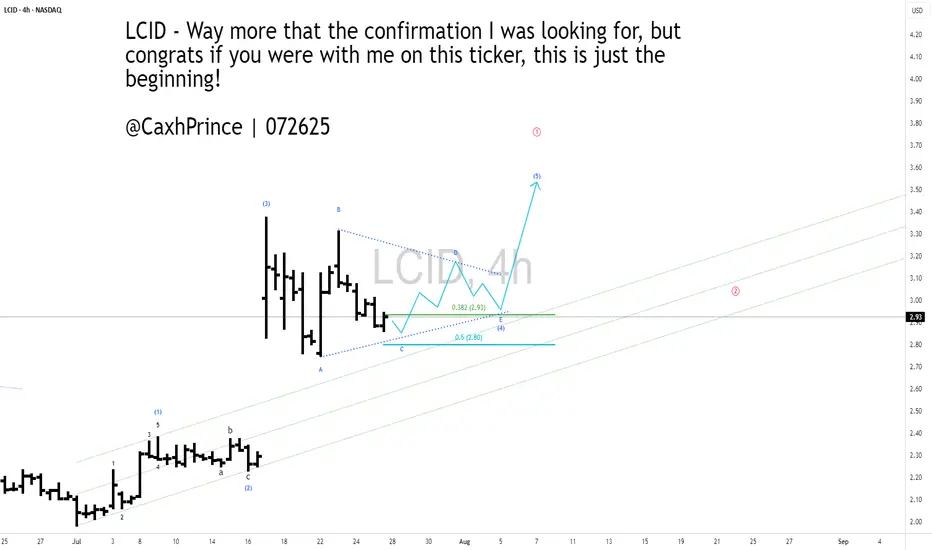
#LCID - 4HR [ A potential bullish view]Lucid blasted off last week with the collaboration of Uber and Robo-taxis. I think that blast infused more investors to the stock and I think it may never come back to take out its lows. If it does, I would load up more on it. I like their designs and the fact that they are now compatible with TESLA's Super Chargers make them even more attractive.
In my count here, I am sensing the current correction could form a triangular pattern for another high before one last correction for ABC down.
Go LCID, Go!!!
Check out my other chart ideas @CaxhPrince everywhere.

A 4HR Bullish view on #Lucid Motors ($LCID)Lucid blasted off last week with the collaboration of Uber and Robo-taxis. I think that blast infused more investors to the stock and I think it may never come back to take out its lows. If it does, I would load up more on it. I like their designs and the fact that they are now compatible with TESLA's Super Chargers make them even more attractive.
In my count here, I am sensing the current correction could form a triangular pattern for another high before one last correction for ABC down.
Go LCID, Go!!!
Check out my other chart ideas @CaxhPrince everywhere.
BTC at Multi-Factor Resistance: Wave Count Hints at Downside BTC is looking increasingly bearish as the price has risen to a resistance zone formed by multiple factors: trendlines, the POC (Point of Control), and moving averages.
The wave count also supports this bearish outlook / the bearish case.
Nasdaq Short: Completion of 5 waves with wave 5=wave 1Over here, I present a short case for Nasdaq (and S&P500 by default since their correlations are high). The main reasons are:
1. Completion of 5 waves structure both on the high degree and on low degree, as shown in the chart.
2. Fibonacci measurement where wave 1 = wave 5.
The stop of this idea is to be placed slightly above the high, in this case, I placed it at around 23320. The take profit target is at the bottom of primary wave 4, around 20685.
Take note that this is a positional short, meaning the strategy is to short and hold and periodically adjust your stop loss based on unfolding on wave structure. Sizing is based on your risk tolerance.
Good luck!

Bitcoin Long: Completion of Sub-wave 4, riding wave 5I updated the Elliott Wave counts for Bitcoin and we should have completed sub-wave 4 and is currently onto sub-wave 5. Based on my counts, sub-wave 3 has extended and is slightly more than 1.618x of wave 1, thus I expect sub-wave 5 to NOT extend. Based on Fibonacci extensions, the price target is around $124,600.
The stop loss for this idea is around $114,600.
Towards to end of the video, I zoomed out for Bitcoin and observed that Cycle level wave 1 and 3 are HUGE (red font) and the current Cycle Wave 5 looks too small. Thus, the entire 5-wave structure of what we are going through now may be just a Sub-Wave 1 of Cycle Wave 5. And that means that longer-term, Bitcoin may really go to $200,000 and beyond. But for traders, keep our foot on the ground and trade what is in front of us.
Good luck!

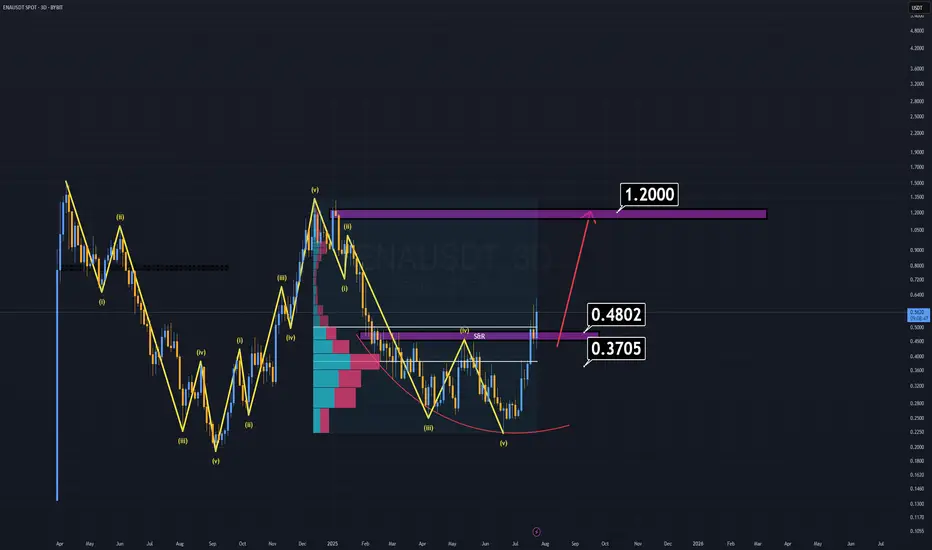
ENA Analysis (3D)ENA has been outperforming many altcoins for weeks, yet it still appears undervalued based on its fundamentals and recent investor interest.
Where to buy?
Right now, buying at current levels is extremely risky, as the ideal buy-back zones are significantly below the market price.
First major support: $0.48 — considered a "cheap" entry.
Dream entry (low probability): $0.37–$0.38 — at that point, ENA would feel almost free.
Notably, BlackRock and its partners are actively investing in ENA, which speaks volumes about its long-term credibility. That alone justifies keeping it on your radar.
Minimum target: $1.00–$1.20
Remember, that’s just the beginning. We may see even more once momentum kicks in.
Sometimes, the best trade is the one you're waiting for.
Good luck.
GBPJPY Potential UpsidesHey Traders, in the coming week we are monitoring GBPJPY for a buying opportunity around 197.900 zone, GBPJPY is trading in an uptrend and currently is in a correction phase in which it is approaching the trend at 197.900 support and resistance area.
Trade safe, Joe.
