PENGU still has room!?If you find this information inspiring/helpful, please consider a boost and follow! Any questions or comments, please leave a comment!
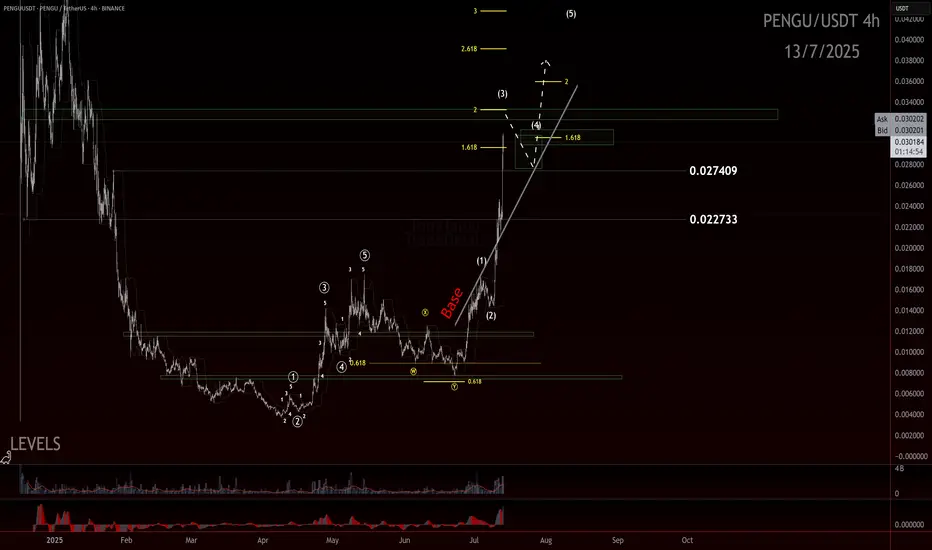
The move off the low looked like a clean, completed impulse—sharp, decisive, and well-structured. After that, we got a double zigzag retracement. It ran a bit deeper than the textbook version, but still landed right in the normal range you’d expect for a healthy correction. From there, we saw another smaller-degree impulse form off the .007 pivot, suggesting bullish momentum was building again.
Since the last update, PENGU has come a long way—more than doubling in price and now hovering around a most likely target for a wave 3. What’s notable is how it got there: not just by breaking above the 0.017 resistance, but by blowing through multiple base channels on solid momentum and healthy volume.
We didn’t get the ideal depth for a retrace for a wave 2 before that breakout, but that doesn’t disqualify the larger count. In fact, from an Elliott Wave perspective, I still believe we haven’t seen a proper wave 4 to balance out the earlier wave (2). So I’m holding off on calling a top to this wave 3 just yet.
Here’s what we’re watching closely now:
The secondary impulse off .007 continues to build structure
Ideally, the next pullback holds above the 0.027 or .022 region, signaling respect for previous support and AOIs
That pullback needs to unfold correctively, not impulsively, to confirm bullish continuation
The next trade setup I’m eyeing is that wave 4 into wave 5 move. I’ll be stalking this ticker closely as structure unfolds.
Trade safe.
Trade clarity.
Elliott Wave
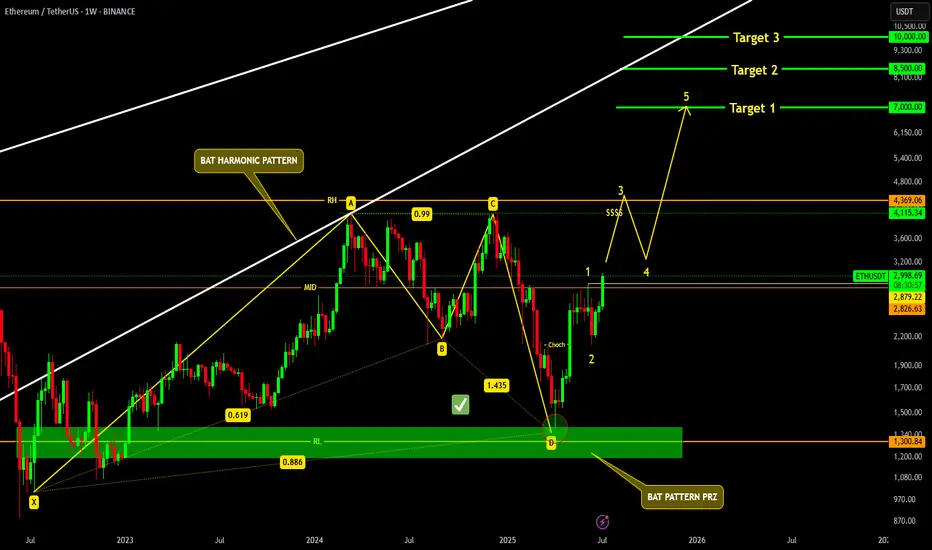
ETHEREUM READY TO SMASH 10K !!!AS per previous Ethereum update, CRYPTOCAP:ETH successfully tapped our Bat PRZ and making it's way to the top.
as per micro elliott wave count, we will see Ethereum slamming 7k, and could potentially smash 10k in coming months.
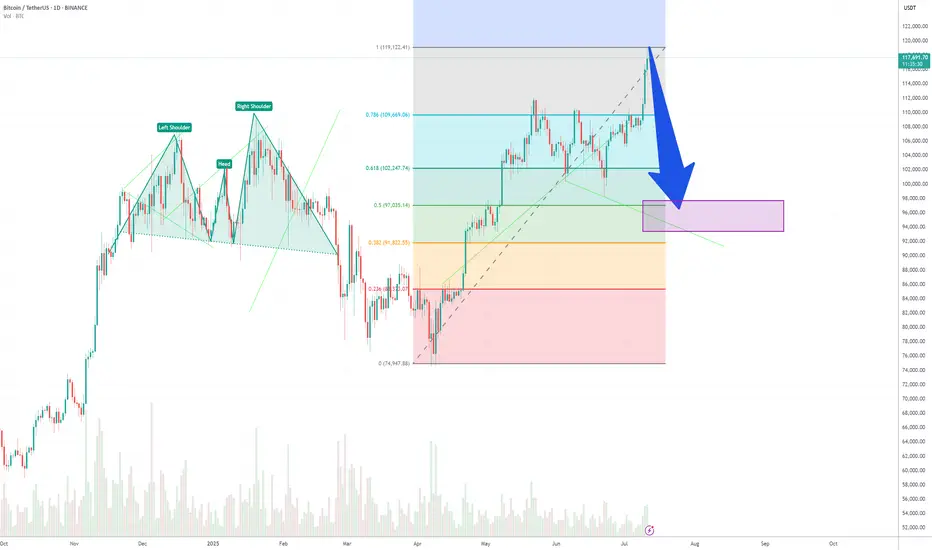
Bitcoin Roadmap=>End of RallyBitcoin ( BINANCE:BTCUSDT ) has gained nearly +10% in the recent weekly candle so far. The question is where this rally could end up. So to get to that zone, let’s go to the weekly timeframe .
Before we start this analysis, let’s take a look at my last analysis on the weekly timeframe , which was well into the Potential Reversal Zone(PRZ) . ( Analysis time: 9 JUN 2025 )
Bitcoin has now entered the Potential Reversal Zone(PRZ) and Time Reversal Zone(TRZ=June 23 to August 4) , and these zones could be the zones where this Bitcoin rally will end. Do you agree with me?
In terms of Elliott Wave theory , Bitcoin appears to be completing a main wave 5 , as the main wave 3 was an extended wave . The main wave 5 could end at the Potential Reversal Zone(PRZ) .
I expect Bitcoin to start a main correction from the Potential Reversal Zone(PRZ) and could continue to support lines and near the $105(at least) .
What do you think about the end of the Bitcoin rally?
Note: Sell orders near $120,000 are very heavy.
Note: Cumulative Long Liquidation Leverage attractive volume for liquidation.
Note: If Bitcoin goes above $130,000, it can continue to rise to the Resistance lines (near $150,000).
Please respect each other's ideas and express them politely if you agree or disagree.
Bitcoin Analyze (BTCUSDT), weekly time frame.
Be sure to follow the updated ideas.
Do not forget to put a Stop loss for your positions (For every position you want to open).
Please follow your strategy and updates; this is just my Idea, and I will gladly see your ideas in this post.
Please do not forget the ✅' like '✅ button 🙏😊 & Share it with your friends; thanks, and Trade safe.

PENGU = ETF Catalyst + Whale Accumulation = +30% More Upside?Today, on the weekend, I want to analyze the Pudgy Penguins project with the PENGU ( BINANCE:PENGUUSDT ) token from a fundamental and technical perspective .
Please stay with me.
Why did PENGU surge nearly 40% in just 48 hours? Here’s what’s driving it:
------------------------------------------
Fundamental Analysis:
1. ETF Momentum via Cboe:
On June 26, Cboe officially filed a 19b-4 form for a new ETF that includes Pudgy Penguins and PENGU as major components.
Although not yet approved, this single move has fueled strong institutional anticipation, similar to what happened with Bitcoin ETFs in early 2023.
The market often prices in future narratives — and this ETF storyline has been a powerful one.
2.Whale Accumulation Signals
According to Nansen data, large holders have increased their balances by 11.37%, and notable wallets linked to public figures by 7% over the last 30 days.
Such coordinated accumulation often precedes major price moves, and that pattern seems to be repeating here.
3.NFT Ecosystem Boost
The Pudgy Penguins NFT collection saw a 400%+ surge in sales volume.
This sharp increase in NFT activity has reignited attention toward the broader Pudgy ecosystem, which naturally benefits its native token, PENGU.
Risk Note:
The ETF is not yet approved — we're still in the hype phase.
Volatility remains high, and strong pullbacks are common in low-liquidity tokens like PENGU.
If whale activity continues and institutional narratives grow, the upside potential remains — but so does the downside risk.
------------------------------------------
PENGU token started to rise from the Support zone($0.01-$0.0076) . One of the signs of a continuation of the uptrend was the break of the upper line of the descending channel .
Educational Note: One of the price targets after a channel break can be as wide as the width of the broken channel.
In terms of Elliott Wave theory , it seems that the PENGU token has completed the Double Three Correction(WXY) , and we can wait for the next impulsive waves .
I expect the PENGU token to attack the Resistance zone($0.0128-$0.0118) again, and if this zone is broken , it can increase to at least $0.0137(+30%) .
What is your idea about the Pudgy Penguins project?
Note: If the PENGU token drops below $0.01, we can expect a break of the Support zone($0.01-$0.0076).
Please respect each other's ideas and express them politely if you agree or disagree.
Pudgy Penguins Analyze (PENGUUSDT), 4-hour time frame.
Be sure to follow the updated ideas.
Do not forget to put a Stop loss for your positions (For every position you want to open).
Please follow your strategy and updates; this is just my Idea, and I will gladly see your ideas in this post.
Please do not forget the ✅' like '✅ button 🙏😊 & Share it with your friends; thanks, and Trade safe.

Bitcoin Long: Expects New High; Target 124,632Over in this video, I update on the Elliott Wave counts for Bitcoin and explain why I think that Bitcoin is going higher for a wave 5 of 3 of 5.
The stop loss will be below the wave 4 and given some leeway, will be around 115,900. There are 2 Take profit targets:
1. 119,251, and
2. 124,632
I made it known that my personal preference is $124,632 but note that once a new high is made, this wave counts will already be validated even if it then drops to our stop.
I talk about the possibility of trailing the stop once a new high is reached but commented that every trader must trade based on their own style and risk preference.
Finally, Good luck in your trading!

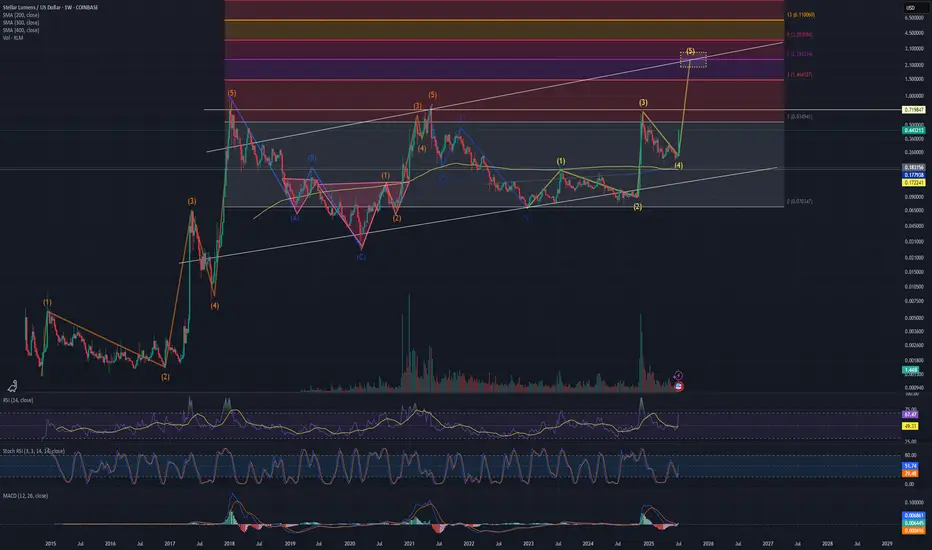
XLM to make a new ATHStellar XLM looks like its on the move to make a new All Time High.
Prediction is that XLM will break out from its 70c resistance and make a new all time high of at least $1.46 and potential to $2.39 with $3.70 being moonshot targets.
Are we on Super Bullish Express Highway ? Elliott Waves RoadmapHello friends,
Welcome to RK_Chaarts
Today we're attempting to analyze Bitcoin's chart, specifically the BTCUSD chart, from an Elliott Wave perspective. Looking at the monthly timeframe chart, which spans the entire lifetime of Bitcoin's data since 2011, we can see the overall structure. According to Elliott Wave theory, it appears that a large Super Cycle degree Wave (I) has completed, followed by a correction in the form of Super Cycle degree Wave (II), marked in blue.
Now, friends, it's possible that we're unfolding Super Cycle degree Wave (III), which should have five sub-divisions - in red I, II, III, IV, & V. We can see that we've completed red I & II, and red III has just started. If the low we marked in red II doesn't get breached on the lower side, it can be considered our invalidation level.
Next, within red III, we should see five primary degree sub-divisions in black - ((1)), ((2)), ((3)), ((4)) & ((5)). We can see that we've completed black ((1)) & ((2)) and black ((3)) has just started. Within black ((3)), we should see five intermediate degree sub-divisions in blue - (1) to (5). Blue (1) has just started, and within blue one, we've already seen red 1 & 2 completed, and red 3 is in progress.
So, we're currently in a super bullish scenario, a third of a third of a third. Yes, the chart looks extremely bullish. We won't commit to any targets here as this is for educational purposes only. The analysis suggests potential targets could be very high, above $150,000 or $200,000, if the invalidation level of $98,240 isn't breached. But again, friends, this video is shared for educational purposes only.
Many people think that the market doesn't move according to Elliott Waves. But friends, here we've tried to analyze from the monthly time frame to the overly time frame. We've definitely aligned the multi-time frame and also aligned it with the principal rules of Elliott Waves, without violating any of its rules.
I agree that the Elliott Wave theory can be a bit difficult, and for those who don't practice it deeply, it can be challenging. But yes, the market moves according to this methodology, following this pattern. This is a significant achievement.
I am not Sebi registered analyst.
My studies are for educational purpose only.
Please Consult your financial advisor before trading or investing.
I am not responsible for any kinds of your profits and your losses.
Most investors treat trading as a hobby because they have a full-time job doing something else.
However, If you treat trading like a business, it will pay you like a business.
If you treat like a hobby, hobbies don't pay, they cost you...!
Hope this post is helpful to community
Thanks
RK💕
Disclaimer and Risk Warning.
The analysis and discussion provided on in.tradingview.com is intended for educational purposes only and should not be relied upon for trading decisions. RK_Chaarts is not an investment adviser and the information provided here should not be taken as professional investment advice. Before buying or selling any investments, securities, or precious metals, it is recommended that you conduct your own due diligence. RK_Chaarts does not share in your profits and will not take responsibility for any losses you may incur. So Please Consult your financial advisor before trading or investing.

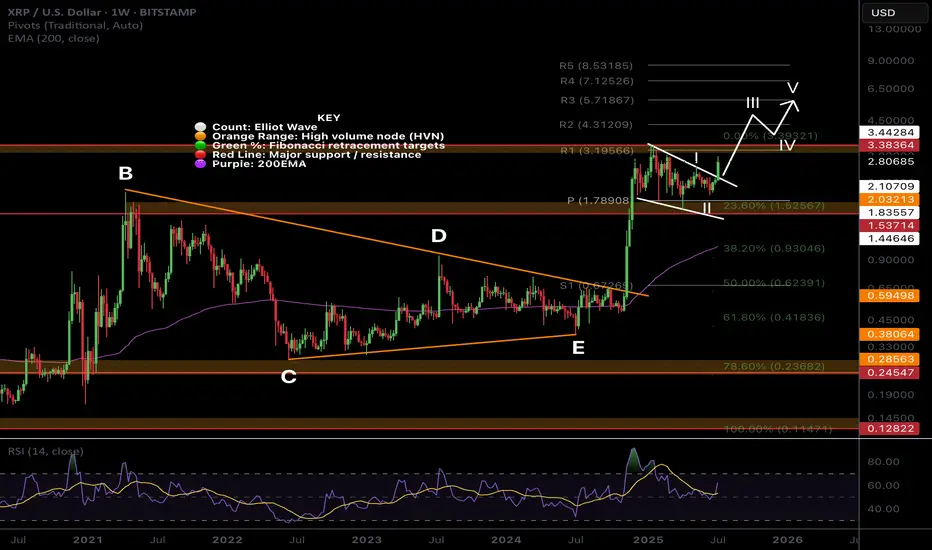
$XRP Macro Tiangle Final Thrust ContinuationCRYPTOCAP:XRP completed a macro triangle pattern last year. Triangles proceed a terminal motif wave which already completed a wave 3.
Wave (3) of (5) is underway with a terminal target around $5.7 after price broke out of the pennant / wedge pattern.
Weekly RSI confirmed bullish divergence.
Safe trading
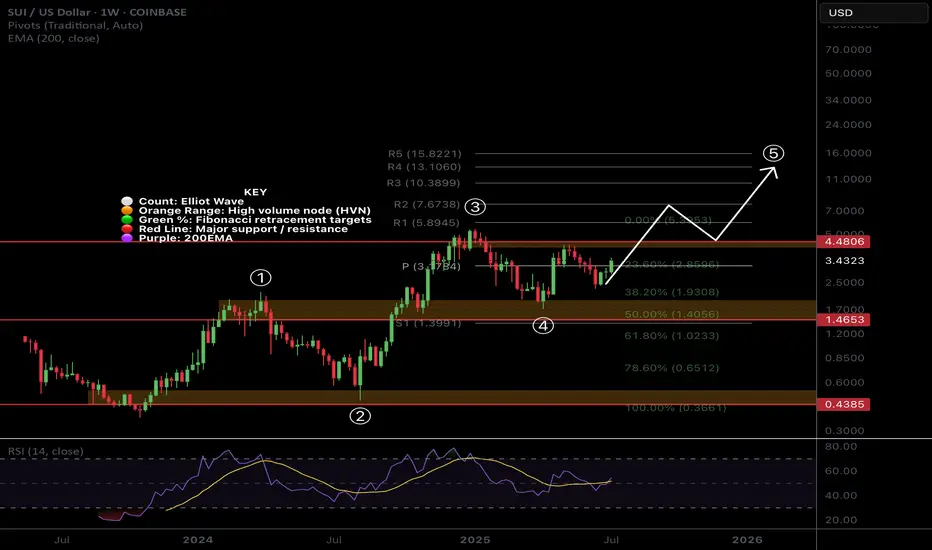
$SUI Wave 3 to Continue with a Strong Weekly CloseCRYPTOCAP:SUI printed a great weekly candle that will be closing today above the weekly pivot point with RSI trying to flip bullishly.
Price found support at 0.5 Fibonacci retracement and High Volume Node.
Wave 4 penetrated wave 1 which we potentially have a ending or leading diagonal Elliot Wave count limiting the potential upside with my current terminal target being around $10-13. Wave 4 could also actually be another wave 2 which would give us ridiculous targets but this is my preferred count for now.
Safe trading
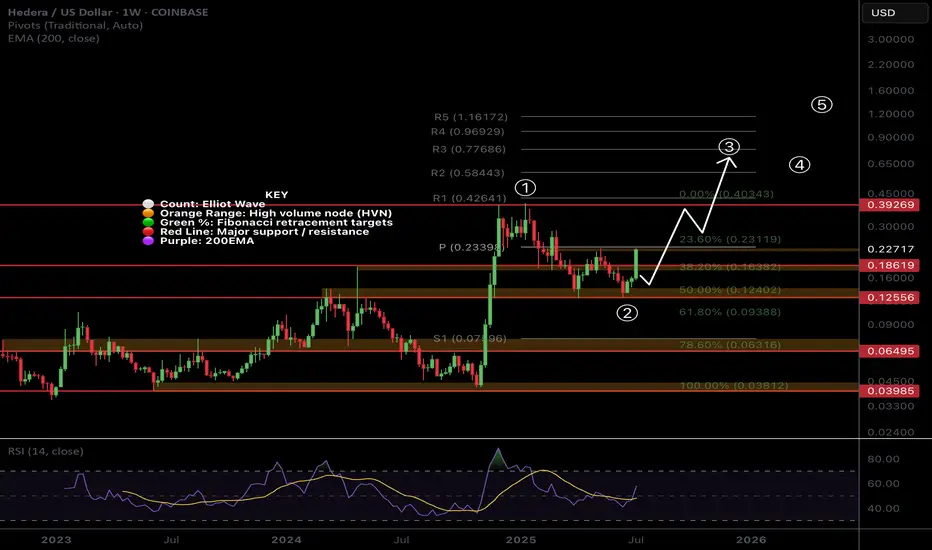
$HBAR Shooting Up in Wave 3CRYPTOCAP:HBAR is flying off the High Volume Node and 0.5 Fibonacci retracement with Elliot wave 3 characteristics keeping the count alive.
Price is testing the weekly pivot point which should act as resistance for the time being but a break straight through will demonstrate a very bullish trend. Traders should be cautious about entering here.
RSI confirmed a weekly bullish divergence
Safe Trading
20 year long BTC analysisTaking into account the halvening and the recent bullish news of countries and big companies wanting to establish a BTC reserve. I think we can see some crazy cycles in the future.
These entities are most likely planning to hold for a minimum of 20 years. And countries won't be shy to print some extra dough for it. Some may see it as an opportunity to finally get rid of their national debt.
As long as fiat exists BTC will most likely keep going up. Its that simple.

Xrp wave countXrp wave count to see where this bull run is going to take us.
Please be realistic and don’t miss out on massive profits by being greeedy!!! Xrp will not be $100 this year.
Probably have to wait a while, like years. So take your profits at $7-10, and then buy back in after the corrective phases.
Be smart.

More upside for BitcoinHi traders,
Last week Bitcoin made a small move down before it shot up again.
It looks like this is wave 3 so we could see a small correction down and more upside for this pair.
Let's see what the market does and react.
Trade idea: Wait for a small correction down on a lower timeframe and a change in orderflow to bullish to trade longs.
If you want to learn more about trading FVG's with wave analysis, please make sure to follow me.
This shared post is only my point of view on what could be the next move in this pair based on my analysis.
Don't be emotional, just trade your plan!
Eduwave

Gold is ready to go up againHi traders,
Last week gold went up again after a correction to finish (orange) Wave D just as I've said in my outlook.
Next week we could see another move down for Wave E and after that the next impulsive wave 5 up.
Or the last correction down was already wave E and gold started the next impulsive wave up.
In both cases gold will shoot up after a correction down.
Let's see what price does and react.
Trade idea: Wait for a small correction down on a lower timeframe and a change in orderflow to bullish to trade longs.
If you want to learn more about trading FVG's & liquidity sweeps with wave analysis, please make sure to follow me.
This shared post is only my point of view on what could be the next move in this pair based on my technical analysis.
Don't be emotional, just trade your plan!
Eduwave

More upside after correction for SPX500USDHi traders,
Last week SPX500USD went a little more up (diagonal) just as I've said in my outlook.
Next week we could see the start of a bigger correction down (grey wave 4) and a break of the dotted trendline. Or the diagonal is a leading diagonal wave 1 and grey wave 3 extends more.
Let's see what the market does and react.
Trade idea: Wait to see if price breaks the dotted trend line (for shorts) or not (for longs).
If you want to learn more about trading FVG's & liquidity sweeps with Wave analysis, then please make sure to follow me.
This shared post is only my point of view on what could be the next move in this pair based on my technical analysis.
Don't be emotional, just trade your plan!
Eduwave

Up again for EUHi traders,
Last week EU went exactly as I've said in my outlook.
It slowly went down to take the liquidity.
Next week we could see price reverse from the Daily FVG below and start the next impulsive wave up.
Let's see what the market does and react.
Trade idea: Wait for the finish of the correction down and a change in orderflow to bullish on a lower time frame to trade longs.
If you want to learn more about trading with FVG's, liquidity sweeps and Wave analysis, then make sure to follow me.
This shared post is only my point of view on what could be the next move in this pair based on my technical analysis.
Don't be emotional, just trade your plan!
Eduwave


from 118k $, I expect a correction to the area of 100k$Somewhere from the current levels of 118k $, I expect a correction to the area of 100k$
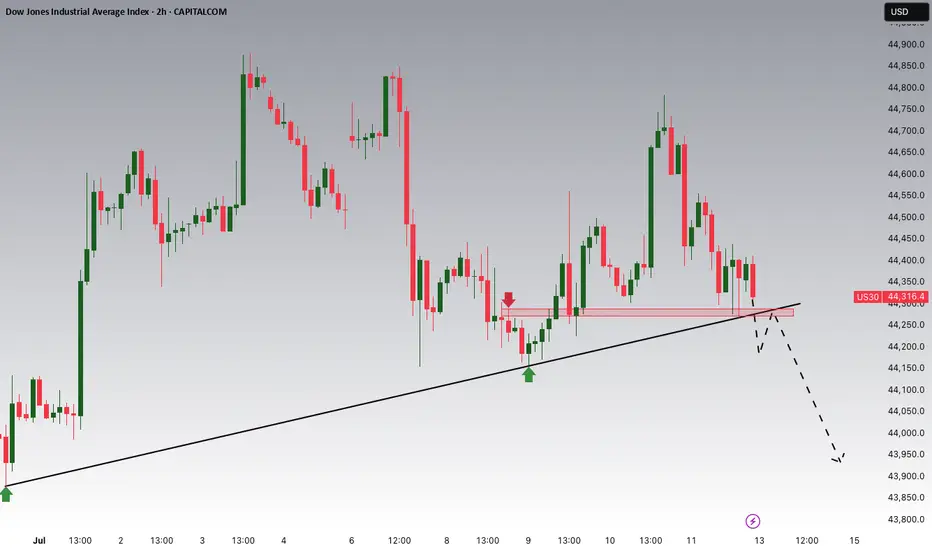
Dow Jones Potential DownsidesHey Traders, in the coming week we are monitoring US30 for a selling opportunity around 44,270 zone, US30 is trading in an uptrend and currently seems to be attempting to break it down, if we get dips below the trend we will be looking for a potential retrace towards further downsides.
Trade safe, Joe.
GOLD → Retest of consolidation resistance. Breakout?FX:XAUUSD is consolidating in a symmetrical triangle pattern. The price is stabilizing amid a falling dollar and uncertainty...
Gold is recovering after falling to $3,283 thanks to a weaker dollar and lower bond yields amid concerns over Trump's new tariff threats. The announced tariffs against seven countries, including Brazil and the Philippines, have heightened tensions, partially offsetting the Fed's hawkish signals. Markets are now awaiting new data from the US and speeches by Fed officials, which could influence the further dynamics of gold.
Technically, gold is squeezed between the resistance and support of a symmetrical triangle. The price is being aggressively pushed away from support within a bullish trend, but at the same time, gold is testing resistance for the fifth time, which only increases the chances of a breakout.
Resistance levels: 3330, 3345, 3358
Support levels: 3308, 3295
If gold continues to storm the local resistance at 3330 and the triangle resistance during consolidation, we will have a good chance of catching the breakout and growth. An additional scenario could be growth after a shake-up of the triangle support and the global trend.
Best regards, R. Linda!

Netflix is going to fall sharply soonNetflix is in the huge 5th wave extension. I expect it to complete wave (v) of 5 very soon, probably within the next week.
RSI divergence on 3-days, weekly frames is quite visible and supports the upcoming trend reversal.
When wave 5 is extended, retracement typically goes to the bottom of wave (ii) of this 5th wave. This would mean 1180-1195 USD to end the wave 5. Also, at this price wave 5 will be 2.168 times bigger than waves 1 and 3 together.

Potential Reversal Ahead: Elliott Wave AnalysisHello friends,
Welcome to RK_Chaarts,
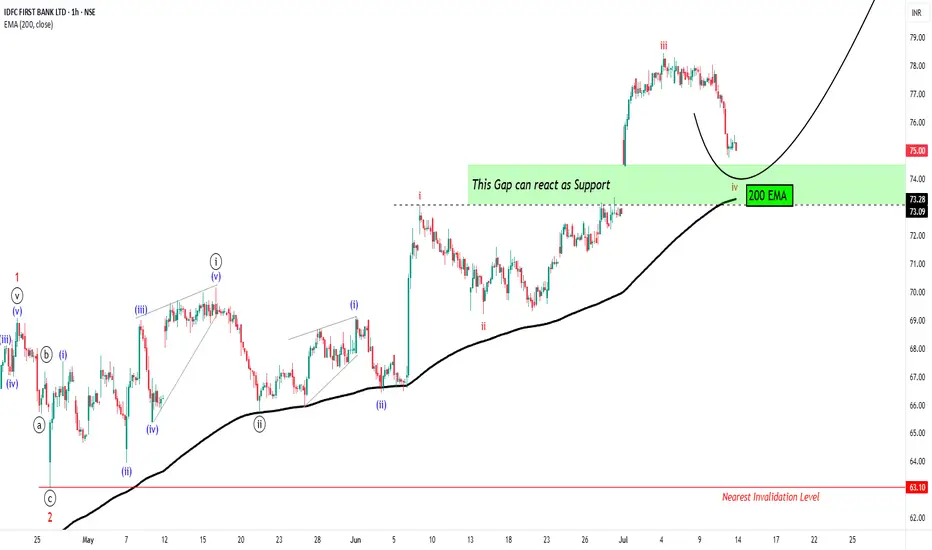
Today we're going to analyze chart of stock named IDFC First Bank, based on Elliott wave theory.
Today, we're analyzing the chart of IDFC First Bank using Elliott Wave theory. On the chart, we've marked the Elliott Waves, indicating that:
- Red wave 1 and 2 (Minor degree) have ended
- Price is unfolding into red wave 3 (Minor degree)
- Black wave ((i)) and ((ii)) (Minute degree) have completed
- Black wave ((iii)) (Minute degree) is ongoing
- Blue wave (i) and (ii) (Minuette degree) have finished
- Blue wave (iii) (Minuette degree) is in progress
- Red wave i, ii, and iii (Subminuette degree) have completed
- Possibly in the correction phase of red wave iv (Subminuette degree)
We observe that the price gapped up, retraced to correct wave iv, and is now supported by the gap zone. Along with 200Exponential Moving Average is also at Gap level which can also provide a good Support to same view.
Our estimate suggests a high probability of a price reversal. However, market uncertainties exist.
Potential price targets: 81, 93, and 100+
Nearest invalidation level: 73.09 (wave iv should not overlap wave i)
Please note that this analysis is for educational purposes only. I'm not a SEBI-registered analyst, and you should consult your financial advisor before trading or investing.
Let's see how the market unfolds. This entire study is shared solely for educational purposes. Thank you so much.
I am not Sebi registered analyst.
My studies are for educational purpose only.
Please Consult your financial advisor before trading or investing.
I am not responsible for any kinds of your profits and your losses.
Most investors treat trading as a hobby because they have a full-time job doing something else.
However, If you treat trading like a business, it will pay you like a business.
If you treat like a hobby, hobbies don't pay, they cost you...!
Hope this post is helpful to community
Thanks
RK💕
Disclaimer and Risk Warning.
The analysis and discussion provided on in.tradingview.com is intended for educational purposes only and should not be relied upon for trading decisions. RK_Chaarts is not an investment adviser and the information provided here should not be taken as professional investment advice. Before buying or selling any investments, securities, or precious metals, it is recommended that you conduct your own due diligence. RK_Chaarts does not share in your profits and will not take responsibility for any losses you may incur. So Please Consult your financial advisor before trading or investing.
Silver Analysis – Potential Top in Place?FXOPEN:XAGUSD
We've now reached the Fibonacci Extension Take-Profit zone from our (4) to (5) move – which is actually part of the larger Wave 3 structure.
The move up unfolded in an ABC structure, which itself formed a smaller 1-2-3-4 (with the 4 again as an ABC).
🚀 So technically, we may have already topped out.
⚠️ What to Watch For:
There may still be some upside volatility, which is why I’m currently watching the yellow trendline closely.
📉 A clean break below it would signal that Wave (5) is likely done, and we’ve started our next move:
➡️ (1) → (2) → (3) → (4) → (5)
This would be the start of corrective Wave (A) of a larger ABC move.
📈 If the yellow trendline holds, we could still see higher highs – but based on current chart structure and momentum…
📊 Indicators are extremely overbought and flashing bearish divergence, supporting the idea that a local top is already in.
