XAU/USD – Elliott Wave Update | Wave (2) in Progress)OANDA:XAUUSD
🔍 Wave Structure Overview
We’re currently in a
Prior impulse (likely 1-2-3-4-5) completed, forming (Circle) wave ①
Current correction unfolding as (A)-(B)-(C) in yellow
↳ Presently in wave (A) or transitioning into (B)
↳ Within (B), structure is forming as A-B-C
↳ Currently tracking 5-wave move from 4 to 5
📐 Fibonacci & Key Levels
Watching 61.8% retracement as a critical support zone ✅
This level also marks a high-probability TP area for short positions
Strong confluence:
🔹 Fibonacci retracement
🔹 Extension alignment (e.g. yellow fib extension to ~4403)
🔹 Trendline reaction expected
🧠 Trade Setup (Scenario-Based)
🔸 Scenario A – Early Entry:
Enter small long near 61.8% Fib zone
SL: Below last swing low
TP: To be refined once C-wave completes
🔸 Scenario B – Confirmation Entry:
Wait for break above red trendline
Add position
SL below Fib zone low
TP around Fibonacci extension / structure resistance (~4403)
⚠️ Key Considerations
Many positions will close in this zone → increase in selling pressure
Possible reversal zone → watch for confirmation (impulse or ABC)
Once wave (C) completes, we’ll likely see entry into a larger bearish move
📎 Conclusion
This is a high-probability reversal zone, supported by Elliott structure and Fib levels. I’m planning to scale in based on price action and confirmation.
📈 Stay flexible, manage risk, and watch the structure evolve.
Elliott Wave

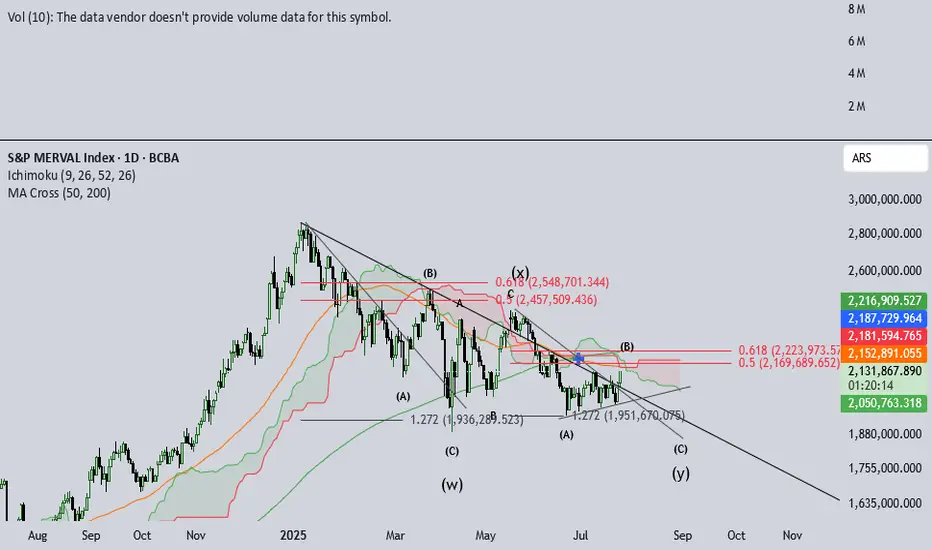
IMV Multiple analysisIMV, Argentina's Merval Index valued in pesos, has been in a downtrend since jan-25. Due to electoral process, noise has been increasing this last week, amidst some shade on what seemed as an easy win for Milei's gov.
The amount of chatter the Merval has brought up is inmense. This psychology is similar to that expected in IVth elliott's waves. Also, jul 2022 - dic 2024 saw huge gains, signaling IIIrd elliot´s wave behavior.
This long and extended IVth can be seen after such huge rallies. Anxiety begins to build up and retail investors begin to be shaken out. This IVth wave seems to be a triple-three type. Volatile and fast, this structure destroys an investor's patience.
Recent developements in the money market seem to have calmed down and peace seems to be partially restored. September elections are around the corner and this little Pax may be threatened.
I'm inclined to believe NOTHING WILL HAPPEN in these elections the govt faces, nor will the gov succeed enourmously, nor will it fail badly. So, I believe the index will likely test previous (W) wave bottoms, to then breakout for a final Vth wave. This analysis is compatible with a triangle-shaped breakout.
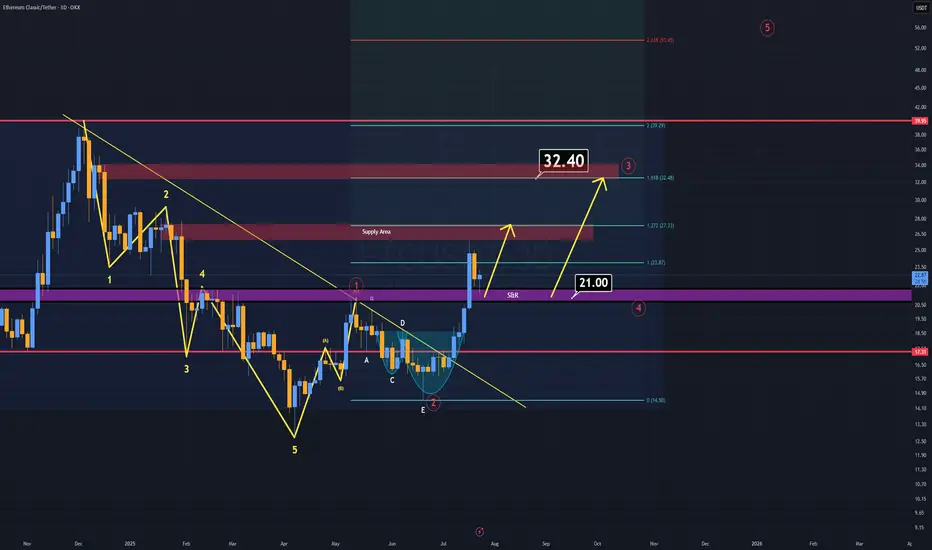
ETC Analysis (3D)ETC is showing a strong bullish structure, just like many other altcoins.
The key difference? ETC has already confirmed its breakout.
As long as ETC holds above the $21 level, I believe the minimum target sits at $32 in the coming weeks.
According to Elliott Wave Theory, that $32 region also marks the end of wave 3, which perfectly aligns with a daily supply block, a strong technical confluence.
Recently, ETC tapped the rebuy zone, highlighted in purple (S/R zone) on the chart.
Lower timeframes also support this bullish continuation scenario.
Momentum is on the side of the bulls.
S wishes you the best of luck!
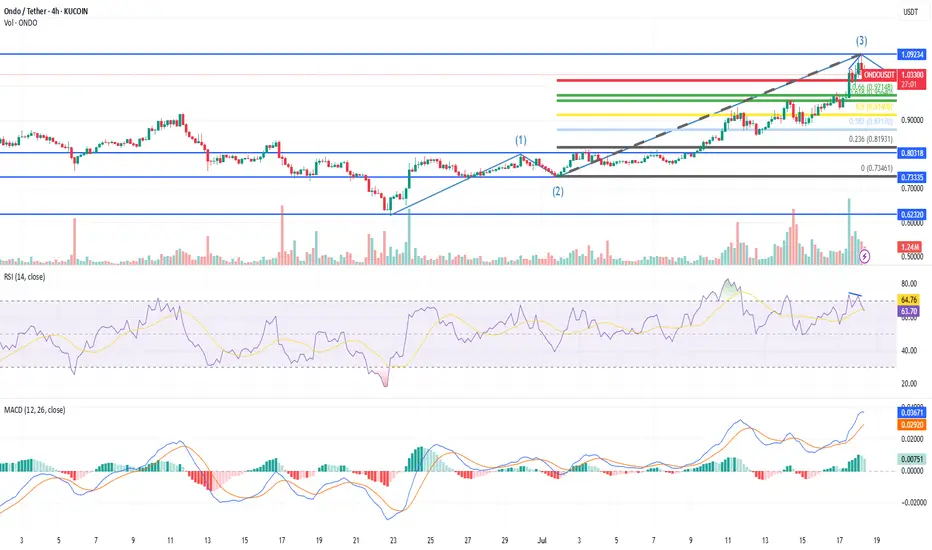
ONDO Elliott Wave AnalysisHi everyone! 👋
I want to share my current ONDO/USDT count on the 4H chart to get feedback from more experienced traders. Any comments, corrections, or tips are very welcome!
🟦 Where I started counting:
Wave (1): Started from around $0.62320 and topped at $0.80318
Wave (2): Retraced to $0.73807, around 36% of Wave 1 — quick and sharp, likely a zigzag
✅ So far, Wave 2 seems shallow and impulsive, which sets up for alternation in Wave 4.
🟩 Wave (3) development:
Wave 3 moved from $0.80318 → $1.09251
Strong volume and price action — fits well with what Elliott Theory defines as a powerful third wave
Wave 3 extension = about 1.6x Wave 1 — matches guidelines
📌 Based on this, I’ve marked Wave (3) completed at $1.09251
🟨 Now: Wave (4) Correction Zone
According to the Elliott Wave alternation rule:
Since Wave 2 was shallow and sharp, Wave 4 is expected to be deeper and more sideways. But BTC ATH bull run panic and hype all can change.
Here are the key retracement zones I’m watching for Wave 4:
| Retracement | Level | Meaning |
| ----------------- | --------------------- | -------------------------------------- |
| **0.382** | $0.98296 | Minor pullback, strong trend continues |
| **0.5** | $0.94884 | Common zone |
| **0.618** | $0.91472 | Deep but acceptable |
| ❌ Below $0.80318 | Invalidates structure | |
🟥 Wave (5) Projection:
Assuming Wave 4 ends shallow or deep, here are potential Wave 5 targets:
| Wave 4 End Price | TP1 (0.618 ext) | TP2 (1.0 ext) | TP3 (1.618 ext) |
| ---------------- | --------------- | ------------- | --------------- |
| \$1.09234 | **\$1.203** | \$1.272 | \$1.382 |
| \$1.04233 | **\$1.153** | \$1.222 | \$1.332 |
I’ll be watching RSI/MACD and volume to confirm when Wave 4 ends before entering Wave 5.
🙏 Open to Feedback!
I’m still learning and really enjoying Elliott Wave theory, so I’d love to hear from the TradingView community:
Do the waves look valid to you?
Would you count this any differently?
Any tips on catching the reversal of Wave 4?
Is the Wave 2 structure truly a zigzag, or am I missing something?
Thanks for reading — and I appreciate any support, corrections, or insights you can share. 📈💬
Let’s learn together!
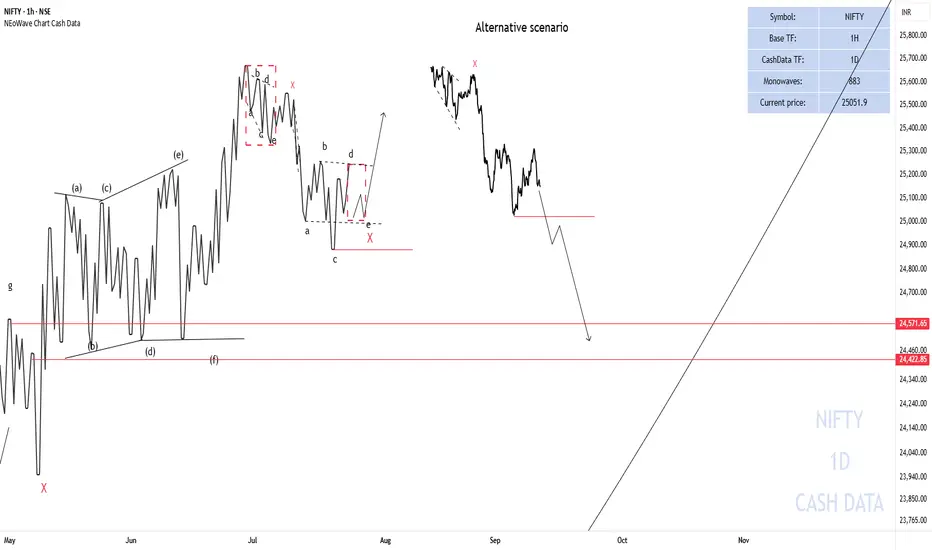
NIFTY50 Analysis ScenariosNIFTY briefly went below 25000 points but could not consolidate so a possible scenario is that X- wave is forming, triangle - X - triangle and then the upward movement starts.
Alternative scenario
If the end of wave-c of the reverse triangle breaks (red horizontal line), NIFTY could decline to the specified range.
Good luck
NEoWave Chart
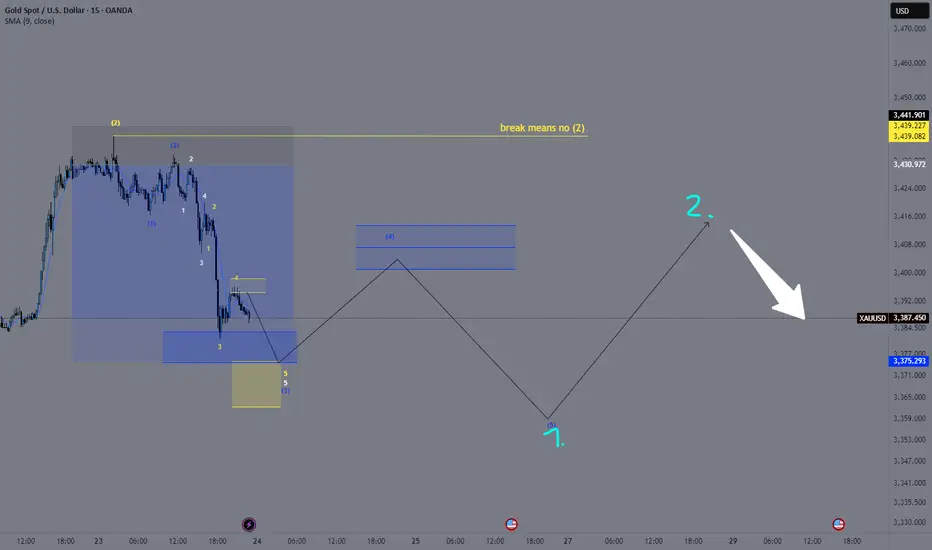
XAU/USD – Wave 2 Breakout Confirmed | Tracking the ImpulseOANDA:XAUUSD
We’ve now seen the first bullish push out of the blue (2) Fibonacci zone.
This allows us to start tracking a potential blue (1)-(2) structure, setting the stage for an impulsive move into blue (3) – although we haven't fully arrived there yet.
Within this blue wave (2) to (3), we can already identify a white 1-2-3-4 in progress, and from white 4, we're seeing a yellow 1-2-3-4-5 impulse forming.
📌 Currently, we are at yellow wave 4, right below the Take Profit zone of the Fibonacci extension projected for blue wave (3).
This level aligns perfectly with the yellow Fibonacci extension zone calculated from yellow wave 2 to 3 to 4, which gives us the expected yellow wave 5 target.
🚀 Once that move is complete, I anticipate a potential upward breakout above 3400, leading to a blue wave (5).
This blue wave (5) would then mark the blue wave 1 of a larger bearish sequence: specifically, the broader move from yellow wave (2) to (3).
META Slows Down For A Correction Within UptrendMeta has seen a strong recovery recently, but barely retested February highs around 740, from where we can see some nice pullback, but it appears corrective, since it’s unfolding in three waves, and forming a potential bull flag — likely wave 4. A breakout above the downward channel on a daily close could signal the start of wave 5 and a push to new highs.
However, keep a close eye on the 666.1; a break below this level would invalidate the bullish view and suggest a deeper consolidation phase may follow.
Highlights:
Direction: Up (pending breakout)
Structure: Wave 4 bull flag; wave 5 possible soon
Support: 680 / 690

SOL Uptrend Update➡️ Solana has been correcting for the last couple of days, but the trend is clearly up.
➡️ There are 2 confluence factors that should give price support: the gray ascending trendline and the green zone.
➡️ Initial Targets (purple lines) are:
218.45 (100% extension)
258.79 (beginning of blue potential supply zone)

AUDJPY BullishAfter exiting a correction, the first impulse (Wave 1) appears. I expect a retracement of at least 50% of the Fibonacci.

Building a Future for RWAs and Multichain DeFi: A Strategic OutlThe intersection of real-world assets (RWAs) and decentralized finance (DeFi) has become one of the most transformative trends in the blockchain space. As traditional financial institutions explore blockchain integration, and DeFi continues to mature, tokenized RWAs—like real estate, bonds, and commodities—are poised to redefine the global financial landscape. Combined with multichain interoperability, this evolution promises greater efficiency, transparency, and accessibility.
The Rise of Real-World Assets on Blockchain
Tokenization is the process of converting rights to an asset into a digital token on a blockchain. For RWAs, this means that tangible assets—such as property, equities, or art—can be fractionalized and traded globally in real-time. This unlocks liquidity in previously illiquid markets, enables 24/7 trading, and reduces administrative overhead.
Use cases are rapidly emerging: real estate funds issuing tokenized shares; commodities like gold being represented on-chain; and even government bonds available on DeFi platforms. These developments democratize access to assets once limited to high-net-worth individuals and institutions.
However, integrating RWAs into DeFi isn't just a technical feat. It requires robust legal frameworks, clear custodianship, and standardized processes for valuation and dispute resolution. Without proper infrastructure, tokenized RWAs risk becoming speculative rather than transformative.
The Role of Multichain Ecosystems
No single blockchain can accommodate the entire spectrum of financial use cases. Multichain architecture—where assets and applications span multiple blockchains—is essential to scale RWA integration effectively.
Cross-chain interoperability enables users to leverage different blockchains for what they do best. Ethereum offers deep liquidity and composability. Algorand and Avalanche deliver scalability and low fees. Polkadot and Cosmos focus on seamless interoperability. Bridging these ecosystems creates a holistic, resilient financial infrastructure.
Protocols like Wormhole, LayerZero, and Chainlink’s CCIP are leading the charge in enabling these connections. By ensuring assets can move securely and efficiently across chains, they support a unified liquidity layer that benefits both RWA issuers and investors.
Challenges and Opportunities
Despite the promise, several hurdles remain. Regulatory compliance is fragmented across jurisdictions, making it difficult for global RWA platforms to operate consistently. Many DeFi protocols are not yet equipped to handle the complexities of asset custody, identity verification, or investor rights enforcement.
Moreover, education is a significant barrier. Institutional investors and retail users alike must understand the risks and mechanisms of DeFi to participate confidently. Projects that prioritize transparency, usability, and regulatory alignment are more likely to gain mainstream adoption.
The opportunity, however, is vast. RWAs could unlock trillions in idle capital, while multichain frameworks reduce friction in global capital markets. Combined, they offer a future where financial products are borderless, inclusive, and programmable.
Conclusion
The convergence of RWAs and multichain DeFi represents a critical shift in finance—from centralized gatekeeping to decentralized participation. It has the potential to create a more accessible and efficient global financial system. While challenges persist, technological advances and increasing institutional interest suggest that this transformation is not only possible, but inevitable. The next few years will be pivotal in shaping the architecture, governance, and standards of this emerging ecosystem.
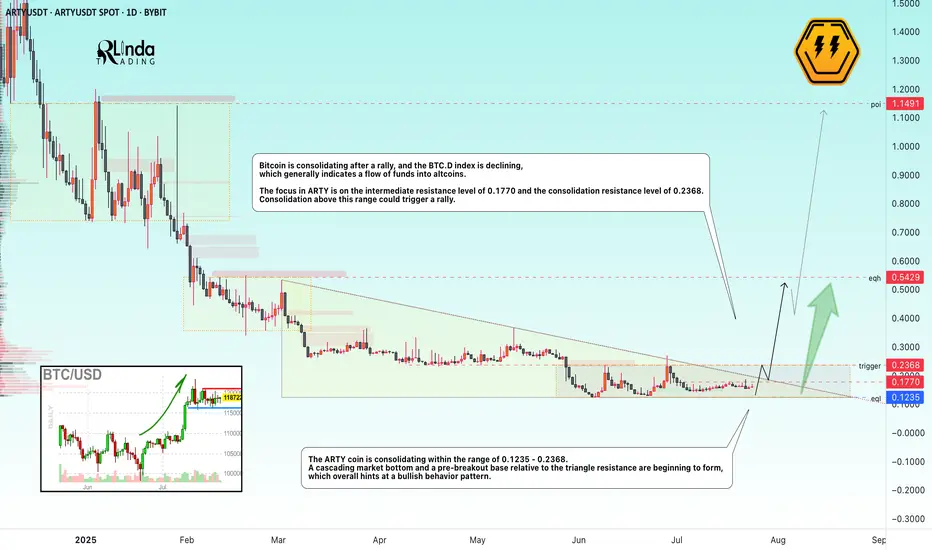
ARTYUSDT → A breakout of resistance could trigger another rallyBYBIT:ARTYUSDT is forming a cascading bottom as part of consolidation before a possible breakout of resistance. The decline in Bitcoin's market dominance gives altcoins a chance.
( (Idea from September 29, 2024!) We previously discussed this coin before its 300% rally. The root causes of its emergence from accumulation and readiness for strong growth were correctly identified).
The dump phase is coming to an end, a cascading market bottom is beginning to form, and a pre-breakout base relative to the triangle resistance is forming, which overall hints at a bullish behavior pattern.
Bitcoin is currently consolidating after the rally, and the Bitcoin dominance index is declining, which generally indicates a flow of funds into altcoins. The situation is such that the altcoin market has another chance for the season. The correction across the entire market may end in the near future, and under favorable conditions (the fundamental background is strengthening, Trump has announced another important event for cryptocurrencies), the market may return to strong movements...
The focus in ARTY is on the intermediate resistance at 0.1770 and the consolidation resistance at 0.2368. Consolidation above this range could trigger a rally.
Resistance levels: 0.2368
Support levels: 0.1235
Technically, a few days ago, the coin tested the consolidation resistance, but the decline did not continue, which generally indicates that buyers are showing interest and holding the market. Consolidation in the near term may end with a retest of 0.1770, 0.2368, a breakout, and further growth.
Best regards, R. Linda!
GBPJPY Potential UpsidesHey Traders, in today's trading session we are monitoring GBPJPY for a buying opportunity around 197.700 zone, GBPJPY is trading in an uptrend and currently is in a correction phase in which it is approaching the trend at 197.700 support and resistance area.
Trade safe, Joe.

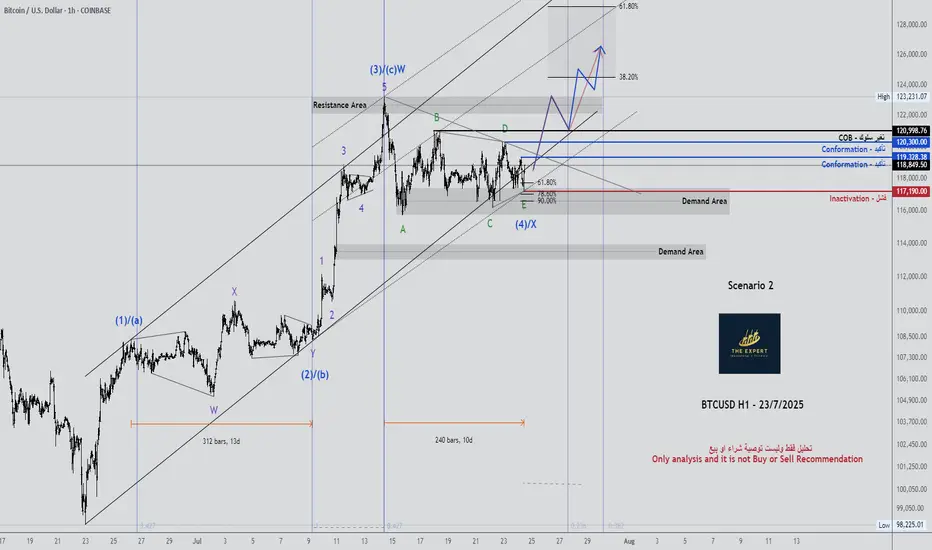
BTCUSD H1 - Updated 23/7/2025BTCUSD H1 - Updated 23/7/2025
chart has language
Only analysis and it is not Buy or Sell Recommendation.
Good-luck.
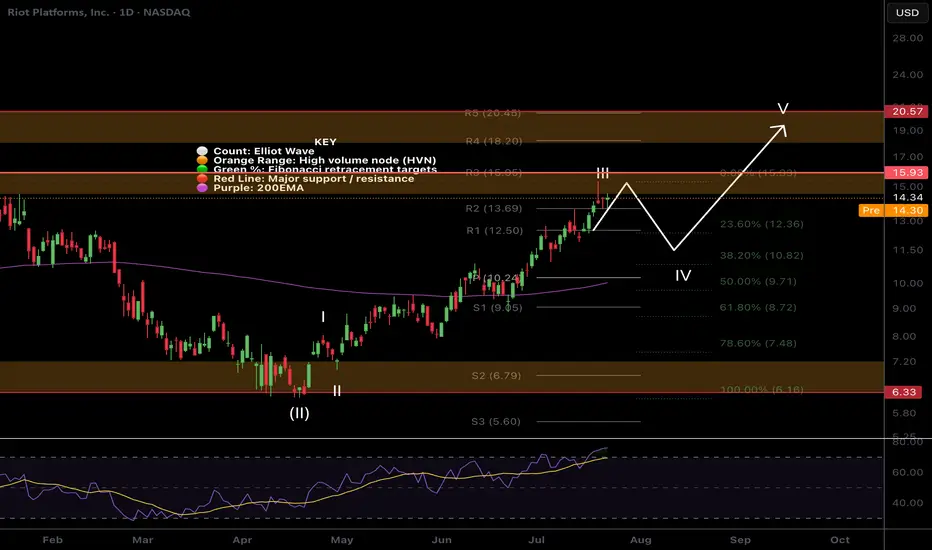
$RIOT Targets hitNASDAQ:RIOT has hit my take profit target at the High Volume Node and R3 daily pivot where it has found resistance.
Wave III appears to be complete with wave IV expected targets being the 0.382-0.5 Fibonacci retracement, also the daily pivot point and ascending daily 200EMA, $10.24.
Analysis is invalidated if we continue to the upside with a new swing high. RSI is overbought no bearish divergence.
Safe trading
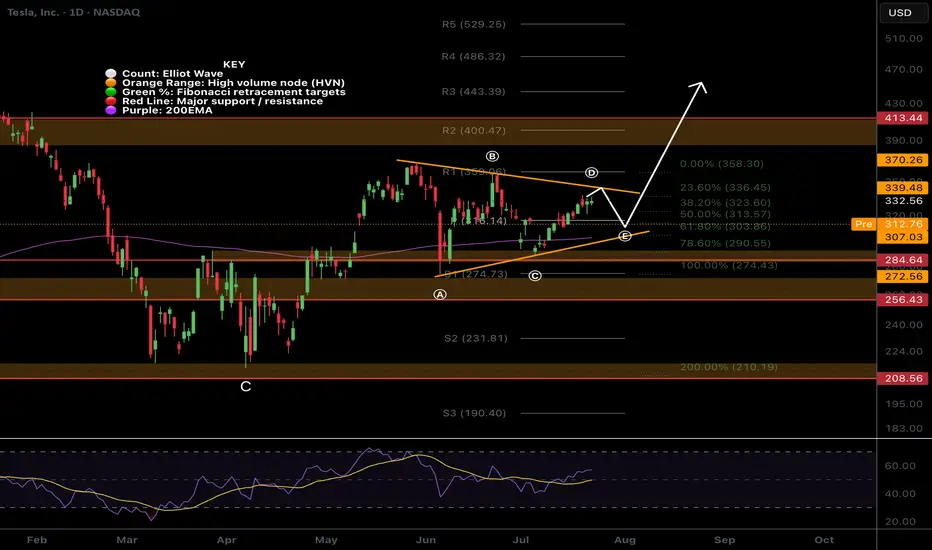
$TSLA Triangle?NASDAQ:TSLA triangle has presented itself with the recent price action. Triangle pattern target is $443 at the R3 daily pivot.
Wave e is expected to end at the daily pivot and wave d break is the signal to go long.
Analysis is invalidated below wave c.
$IREN More downside after huge rally!NASDAQ:IREN is printing bearish divergence on the daily RSI at all tie high resistance.
An Elliot wave motif wave appears complete and wave looks underway with a shallow target of the daily pivot, 0.382 Fibonacci retracement and ascending daily 200EMA.
The daily red wick after printing a 20% start to the day is reminiscent of a blow off top in this asset trapping newbs with FOMO price discovery pump. Market behaviour in action!
Analysis is invalidated if price returns to all time high.
Safe trading

$HBAR Wave 4 finishing soon?CRYPTOCAP:HBAR Hedera appears to have completed wave 4 with the test of the High Volume Node support at the 0.382 Fibonacci retracement.
Wave 5 has an expected target of the High Volume Node resistance at $0.4 before a larger retracement in wave 2 aligning with my summer pump august / September dump view.
Analysis is invalidated below $0.1933 at the 0.5 Fib retracement and will be updated to a wave 2 instead of 4.
Safe trading

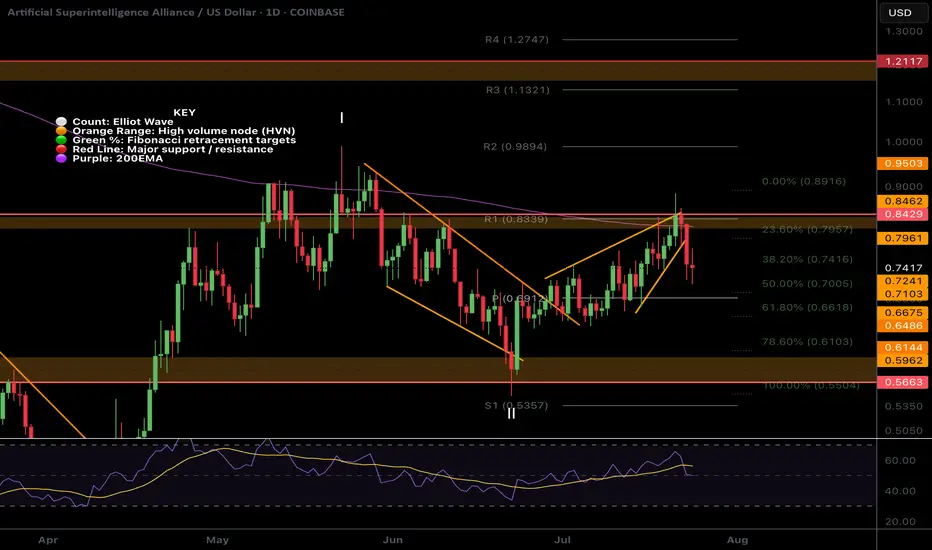
$FET local ending Diagonal and wave 2 near completion?NYSE:FET was rejected for the 4th time at the daily 200EMA! Each time the probability of a breakout increases.
I have adjusted the High Volume Nodes for accuracy.
Locally Fetch appears to have completed a motif wave up with an ending diagonal for wave 5. Wave 2 is expected to find support at the daily pivot and .618 Fibonacci retracement before attempting a breakout of the daily 200EMA once more.
A move below wave II will invalidate this analysis.
Safe trading
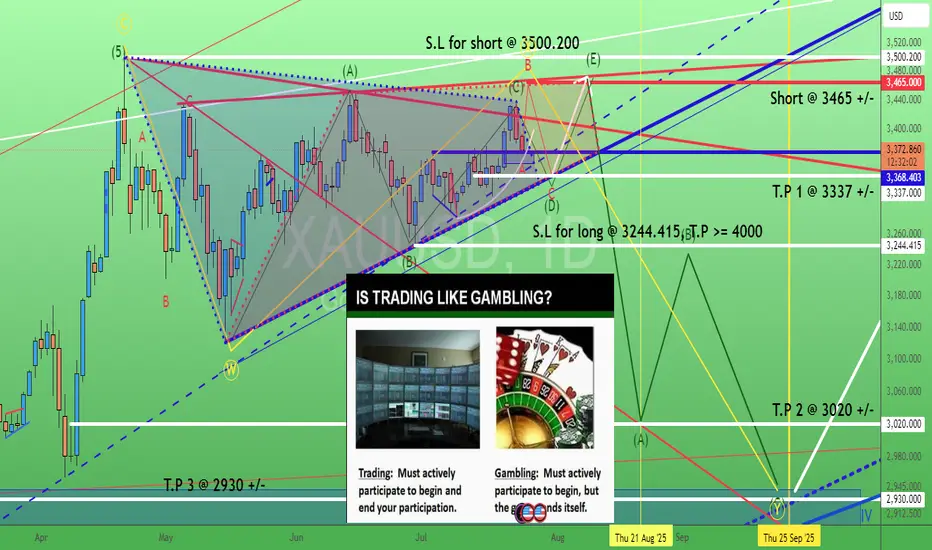
Gold. How to "kill" bull or bear (triangle)? 24/July/25XAUUSD. are you betting (gambling) OR trading for bull/bear triangle? With or without "active lost/cut lost"?.. No stop lost = passive (cut) lost = Let the "gambling" games end for you. Not you end the "trading" any time actively. The "happy ending" always come with good risk management with good risk/reward ratio where ONLY happened when we have T.P and S.L plans.
$ETH Hit Our Targets and was rejectedCRYPTOCAP:ETH hit our signal take profit target at $3820 and was rejected at the High Volume Node EQ to the penny.
That appears to have completed wave 3 of this motif wave. Wave 4 has an expected target of the R2 daily pivot and 0.236-0.382 Fibonacci retracement, $3260 before continuing to the upside in wave 5 with a target of the all time high.
This aligns with my views of a significant pullback at the end of August and September which is typical after a summer rally.
No divergences yet in daily RSI.
Safe trading

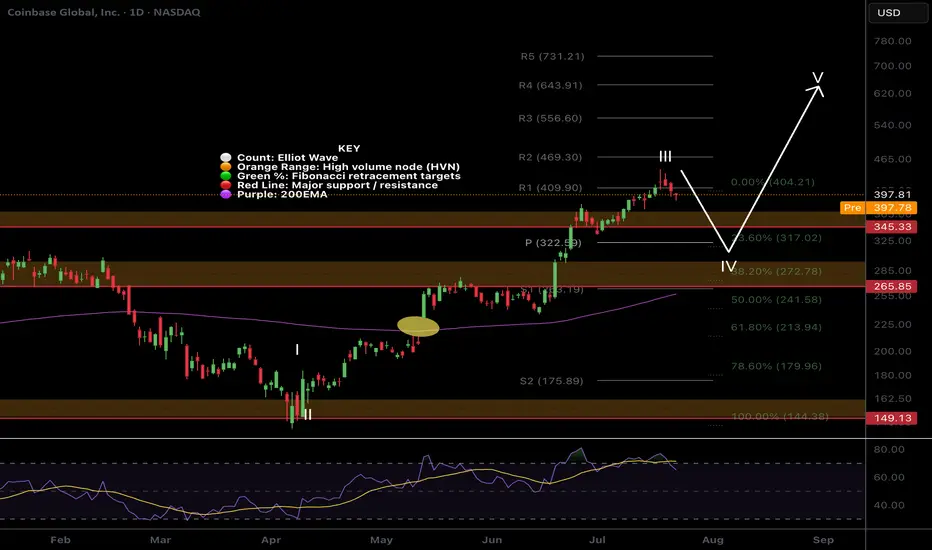
$COIN Wave 4 pullback?NASDAQ:COIN had a tremendous run, a text book Elliot wave 3 but has confirmed bearish divergence on the daily RSI.
The trend is strong so wave 4 could be shallow, only reaching the previous all time high, High Volume Node and 0.236 Fibonacci retracement and daily pivot point between $322-345
Further decline brings up the High Volume Node support at 0.382 Fib retracement and ascending daily 200EMA! Also a highly probable scenario!
Long term outlook remains around $600 target
Safe trading.
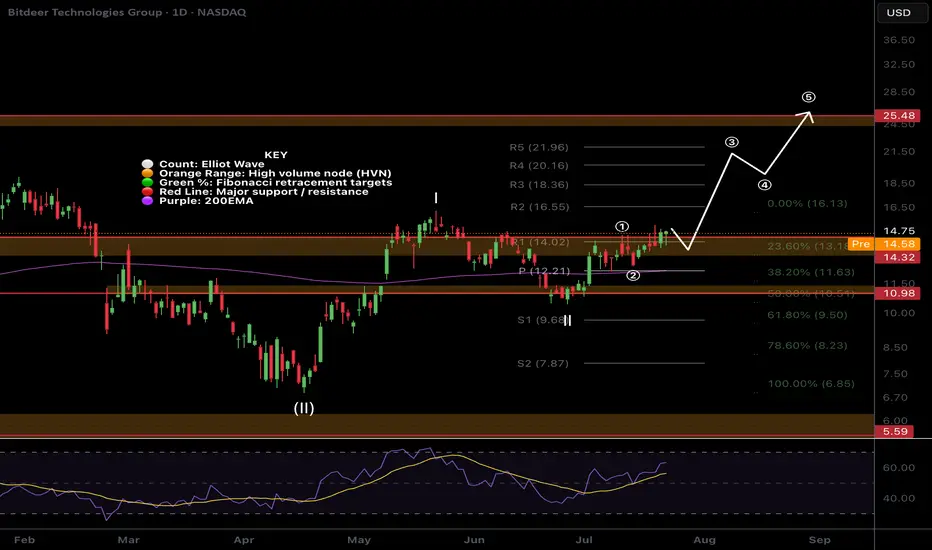
$BTDR Closed above resistance!NASDAQ:BTDR Bitdeer closed above major resistance yesterday, despite BTC and alt coins having a bearish day, triggering our long signal in the Weekly Trade signals substack.
I am looking for price to start to accelerate in wave 3 and resistance now support to hold. If BTC reverses it will add additional tailwinds with a target of the major resistance above the R5 daily pivot $24
Safe trading
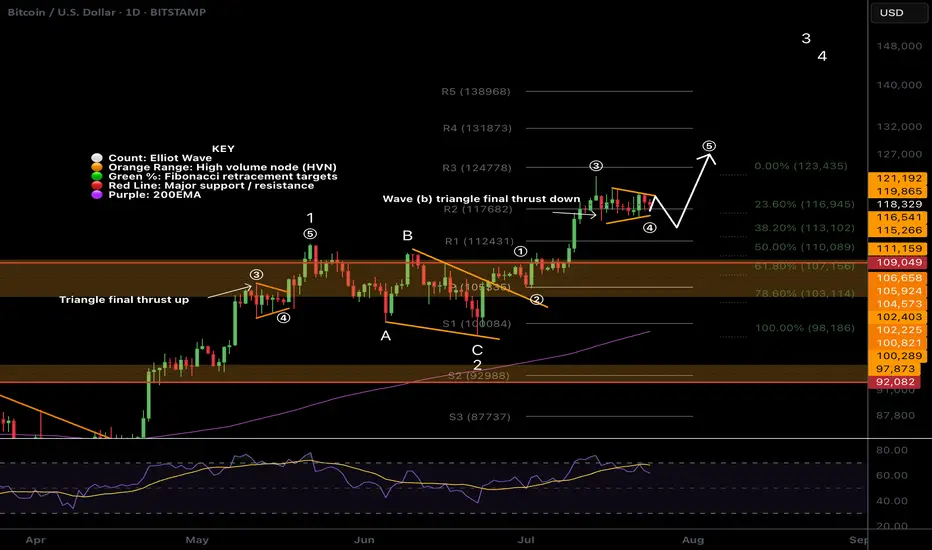
$BTC Wave (b) triangle?CRYPTOCAP:BTC Bitcoin appears to have competed wave 3 up, wave (a) down and now finishing a triangle in wave (b) which would result in a thrust down to around $113k before continuing to the upside in wave (5).
There is slight bullish divergence on daily RSI and wave (4) meets the Fibonacci retracement rules of between 0.236 - 0.382 adding confluence.
Previous all time high is expected to be tested as support on a larger correction, perhaps when the ascending daily 200EMA creeps up to the same level after we blow off.
Safe trading