SET
Apil 2025 since the price is oversold from Feb2025 price still drop contrary with momentum
BigBlack candle followed by exhaustion gap at exactly the end of wave 5 of C
Pattern Double Bottom, Island Reversal
Be careful with the false break out at 1,250. Look closly at the momentum
Around 1,100 is a good buy zone and I do think once it break 1,250 or 1,300 price will never come back to 1,100 again.
Elliott Wave

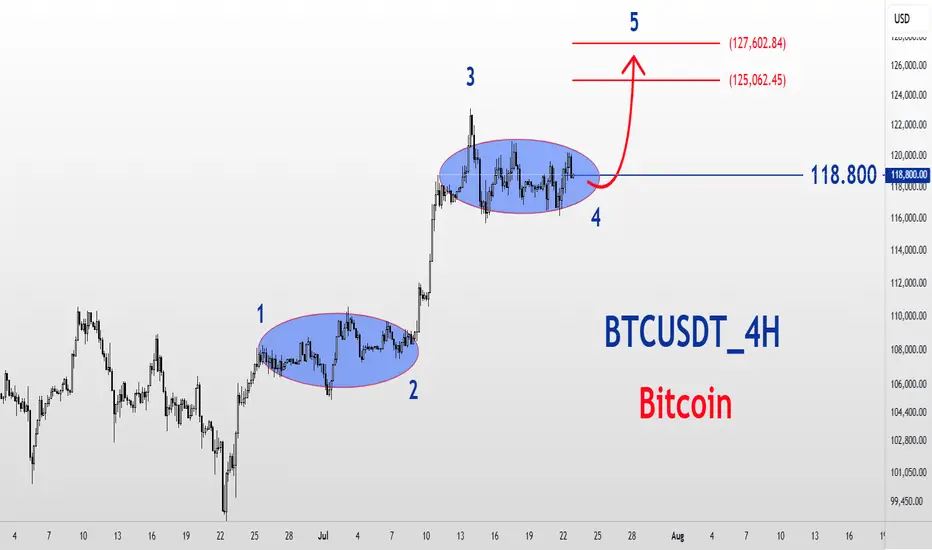
BTCUSDT_4H_BuyBitcoin Analysis 4-Hour Medium-Term Time Frame Elliott Wave Analysis Style The cryptocurrency market leader is rising in the form of five Elliott waves, which we are currently in wave 4 correction and can move up for wave 5 by completing the correction time. Important number $118,800 Target $125,000 to $127,000
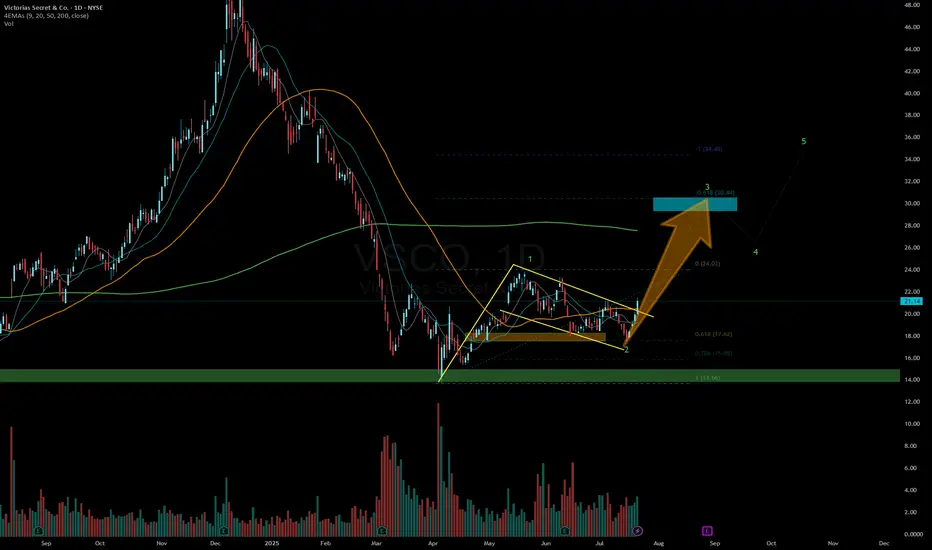
VSS is looking good , can be a double from hereLooks good, ready for a launch. Takes time but can see 30 soon
TEM - what do you see ?I love this stock, so much momentum and good follow through.
I see it's ready for a strong rally. I've huge position via shares and Aug calls

#BankNifty directions and levels for July 23rd:Looking at the chart, the current view suggests:
* If the market sustains the gap-up and breaks the immediate resistance, we can expect the pullback to continue with a moderately bullish tone.
Alternate view:
* If the gap-up doesn’t sustain and the market declines initially, it may reach the immediate support level.
* If a pullback happens from there, we can expect a range-bound market.
* Conversely, if the support breaks, the correction is likely to continue.

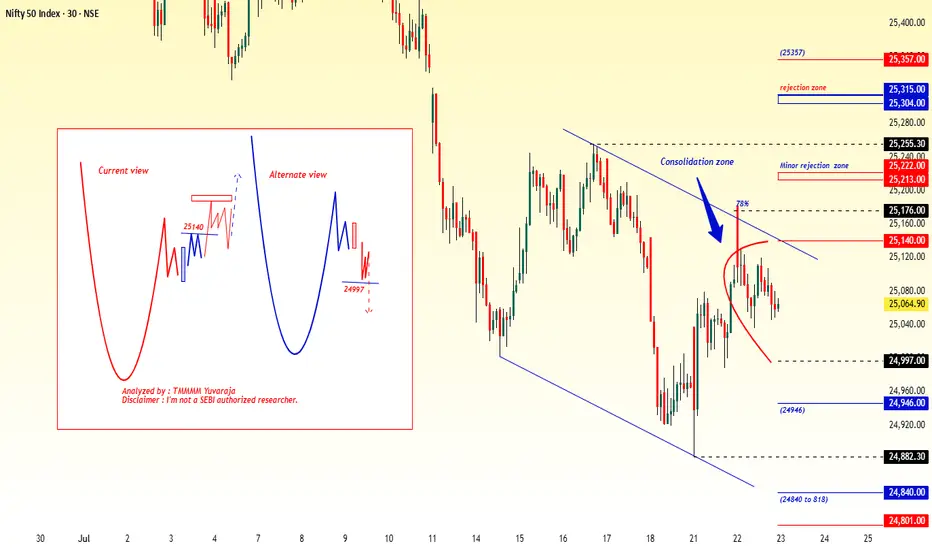
#Nifty directions and levels for July 23rd:Good morning, friends! 🌞
Here are the market directions and levels for July 23rd:
The global market shows no major changes and continues to maintain a moderately bearish sentiment.
Meanwhile, the local market is exhibiting a moderately bullish tone. Today, Gift Nifty indicates a gap-up opening of around 60 points.
What can we expect today?
In the previous session, both Nifty and Bank Nifty couldn't sustain the gap-up start. Structurally, we are still in an unclear zone.
However, my expectation is that today’s market may take some consolidation after the gap-up start.
Looking at the chart, the current view suggests:
* If the market sustains the gap-up and breaks the immediate resistance, we can expect the pullback to continue with a moderately bullish tone.
Alternate view:
* If the gap-up doesn’t sustain and the market declines initially, it may reach the immediate support level.
* If a pullback happens from there, we can expect a range-bound market.
* Conversely, if the support breaks, the correction is likely to continue.
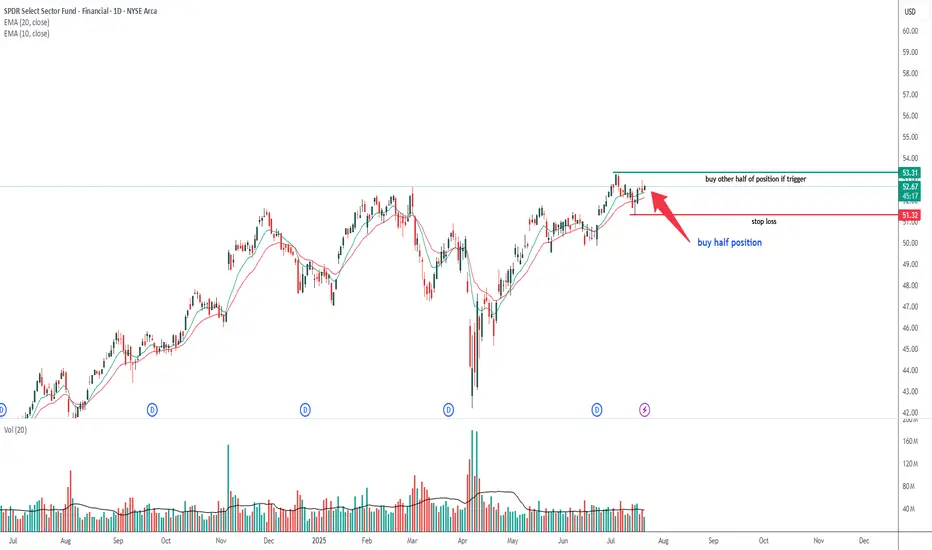
XLF -- Possible trade opportunityXLF -- Possible trade opportunity based of price, volume and chart pattern
GOLD → Correction before continuing the rally to 3450FX:XAUUSD updates its local maximum to 3401.5 and enters a consolidation phase ahead of news. The dollar correction gives speculators a chance...
The price of gold is correcting from 3400. The reason is profit-taking ahead of Powell's speech at 12:30 GMT and waiting for clarity on US trade negotiations with the EU and Japan before August 1.
Gold remains sensitive to the progress of negotiations and the dynamics of the dollar, which is weakening amid political uncertainty, declining yields, and pressure on the Fed from Trump.
Technically, after exiting consolidation and retesting 3400, the price is entering a local consolidation phase.
Focus on key levels: 3401, 3382, 3375. A false breakdown of support could trigger a recovery phase.
Resistance levels: 3402, 3393
Support levels: 3382, 3375, 3362.75
The distribution phase has been halted by resistance, and the price has moved into a countertrend correction due to uncertainty. Markets are waiting for positive signals from the Fed. Local and global trends are bullish, which may support the price overall...
Best regards, R. Linda!

Gold (XAUUSD) D1 - Update 22/7/2025Gold (XAUUSD) D1 - Update 22/7/2025
Please, see the chart to understand.
Regards,

XAU/USD – Likely Wave ⑤ Top In – ABC Correction in Progress!OANDA:XAUUSD
✅ We’ve most likely completed our (Circle) Wave ⑤, and are now entering the first corrective wave of an ABC pattern (marked in 🟡 yellow brackets).
🔹 The (A) wave unfolded as a clean white ABC correction – textbook structure, worked out perfectly.
🔹 From (A) to (B) we saw an impulsive move (likely a 1-2-3-4-5, though not labeled).
🔻 From (B), a strong bearish move broke right through our 🔴 ascending trendline, signaling a potential trend reversal.
👉 We’ve likely completed wave 1 of the new downtrend and are now in a corrective move upward, forming yellow wave 2:
🟡 (A) – (B) – (C), with the (B) once again forming an internal ABC structure.
🎯 We’re now watching for the completion of wave C – this will complete yellow wave 2.
📐 The target zone (TP) lies in the yellow Fibonacci retracement area, with a key level at the 78.6% retracement (marked in white).
🛑 Stop Loss should be placed above the 4-month zone, or just above wave (B).
📊 The Take Profit will be more precise once the top of wave C is confirmed – but expect it to align closely with the 🔵 Fibonacci extension zone.

XAUUSD critical area, both sides are possiblecorrection waves are always complicated and messy often changes direction too often, goes up and down in a wide range either triangle, wedge or some sort of zigzag, internal waves usually goes as abc, wxy, wxyxz type of correction waves and it may seem like ended many times in the subwaves. so often confused with many other ideas. i believe correction continues yet criticals levles to watch 3307-3419 brake side will determen the future of gold.
my 3250 target already achieved but i expect another one, shor term targets 3250-3205 mid term targets 3119-3070-3050
daily candle body above 3420 invalidates short ideas.

Short - AMDTime period for this play : week to months
Analysis : Elliot wave 12345 ABC. Expect hitting .618 and bounce back up to go higher.
Pattern if wave B completed : Head & Shoulder
Price Target: Wave ABC
ETA Timeline for correction. Please refer to the chart.
Upcoming events:
Tariff active on 8/1/25 - Friday
Earning on 8/5/25 - Tuesday
Top is not in yet, so 2 Possible top-in levels:
Top 1 - $163.45 : Retesting to hit 163.45, rejected, and break $158
Top 2 - $173.94 : Breaking 163.45 and reject at 173.94
=> Overall, It begins trading side way and show some weakness now.
The correction may not pull back to .618, which is the best level. Other scenarios:
- 0.5 fib, where it test wave 3
- 0.328 fib, strong bullish level if it doesn't break & go to the upside faster

Weekly Stock Pick: ORCL (Update)Hello Traders!
I'm providing an update to the ORCL trade idea from Monday July 21st. Here's what I'm watching:
- Price to open lower from Monday's close
- Rebalancing in the highest daily Bullish Order Block near $239
- A hammer or dojji candle on higher volume
- Potential confluence with the daily 9 ema, trendline support and higher low on the options chart
Cheers,
DTD
__________________________
Financial Risk Disclaimer |
DISCLAIMER: I am not a financial adviser. The videos on my channel are for educational and entertainment purposes only. I'm just showing you guys how I invest and day trade, but remember, investing of any kind involves risk. Your investments are solely your responsibility and not mine. While day trading can bring substantial gains, it can also bring serious losses! So make sure you do your research to fully understand the market before diving in. The possibility exists that you could sustain a loss of some or all of your initial investment, and therefore should not invest money that you can't afford to lose. The fluctuation of the market can work for you or against you. You should carefully consider your investment objectives and experience before deciding to trade in the market. Again, what you invest in is solely your responsibility.

XAGUSD, Elliott wave analysisOutlook for XAGUSD on 1W chart.
I think we are in sub-wave (3) of the wave (ⅲ).
Sub-wave (3) shown by Green-line will probably be an extension.
If the assumption is correct, the target for wave (3) will exceed 66.4.

Gold (XAU/USD) Elliott Wave Analysis — 4H Chart🟡 Gold (XAU/USD) Elliott Wave Analysis — 4H Chart
As of July 22, 2025
Summary:
The chart shows a completed impulsive 5-wave rally, followed by a complex W-X-Y corrective structure, and a potential larger-degree downward move in progress.
Wave Structure Breakdown:
✅ Completed Impulse (Green Labels):
Wave I → II → III → IV → V structure is clearly defined, marking a major bullish phase.
Wave V completed around the peak (~$3,480 zone), suggesting a medium-term top.
🔁 Complex Correction (W-X-Y in Green and ABC in Red):
After Wave V, a zigzag correction (A-B-C) unfolded (marked in red).
Then a W-X-Y double correction emerged, possibly forming a larger corrective flat/complex pattern.
🔻 Projected Bearish Leg (ABCDE Triangle or Descending Channel - in Pink):
A new ABCDE structure seems to be initiating (marked in pink).
Wave (A) has likely started and is expected to extend towards the $3,180–$3,200 area.
After minor bounces (B and D), final Wave (E) targets the major horizontal support around $2,950–$2,980.
📉 Support Zone to Watch:
$2,950–$2,980 zone (green horizontal line) is the critical level from April lows.
A break below this could lead to accelerated downside movement.
🧠 Strategic View:
Short-Term: Bearish bias towards $3,180–$3,200, with corrective bounces.
Medium-Term: Watch the $2,950 level — likely to act as a decision point.
Long-Term: If $2,950 holds, bullish continuation possible; else deeper retracement to $2,700 or lower.
⚠️ Risk Points:
If price invalidates the (Y) wave high, this bearish structure is likely invalid.
Consider dynamic trailing stops if trading based on this projection.
✅ Conclusion:
Gold has likely completed a major 5-wave uptrend and is currently undergoing a large corrective structure. The chart suggests a high-probability scenario of further decline towards the $2,950–$3,000 region. Tactical traders may explore short setups while maintaining awareness of reversal zones and invalidation levels.
📌 Disclaimer:
This analysis is for educational and informational purposes only and should not be considered financial advice. Trading in financial markets involves significant risk, including the risk of losing your entire investment. Always do your own research or consult with a qualified financial advisor before making any trading or investment decisions. The author is not liable for any financial losses incurred based on the information provided.

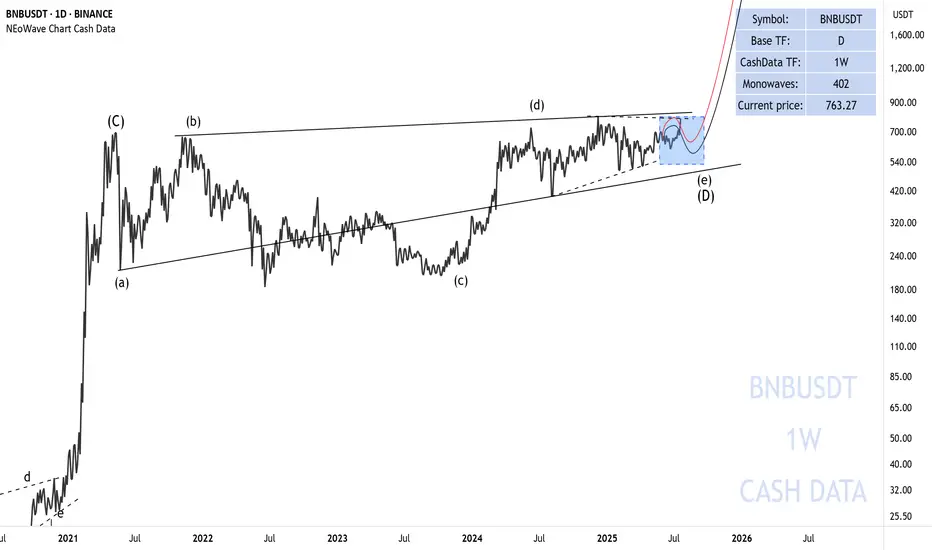
BNB is getting ready to riseThe first bullish move I was expecting for BNB has taken place and it looks like we should be waiting for the formation of wave-e of (e).
After the completion of wave-(e), we expect a big rise for BNB.
Good luck
NEoWave Chart
QNT QUANT is it about lift off and make a new ATH?QNT looks like it has completed its Wave (1) and is mid way through its Wave (3) pump and looks poised to make a new ATH.
The next key level if this was to make a new ATH:
1. $470
2. $750 (likely target this cycle)
3. $1100 (moonshot)
4. $1870

ETH Long Closing July 2025 - Elliot Waves 4-5Elliot Wave setup on the ETH 4h chart. We're now in wave 4, which should be steep since wave 2 was shallow. so targeting the .382 fib for a long entry at $3290 (most likely) - but could go down to the .5 fib for a lower entry ($3115). SL just lower than the DOL on the weekly HTF (end of Nov). Wave 5 should run to $3993 or $4211 (TP at both).
If you're feeling brave, you could also short the rest of wave 4, but be aware this is going against the market upwards momentum and BOS in BTC dominance.

DAG Constellation to make a new All time high?Constellation DAG had a brutal bear market. It looks like an inverse Head and Shoulder Pattern is forming and potentially this coin is about to rocket into stratosphere to see a new ATH for the 2025 bull market.
Key Milestone Targets:
1. $0.20c
2. $0.33c
3. $0.52c (Just a little bit above its last ATH)
4. $0.83c
5. $1.33 (moonshot)

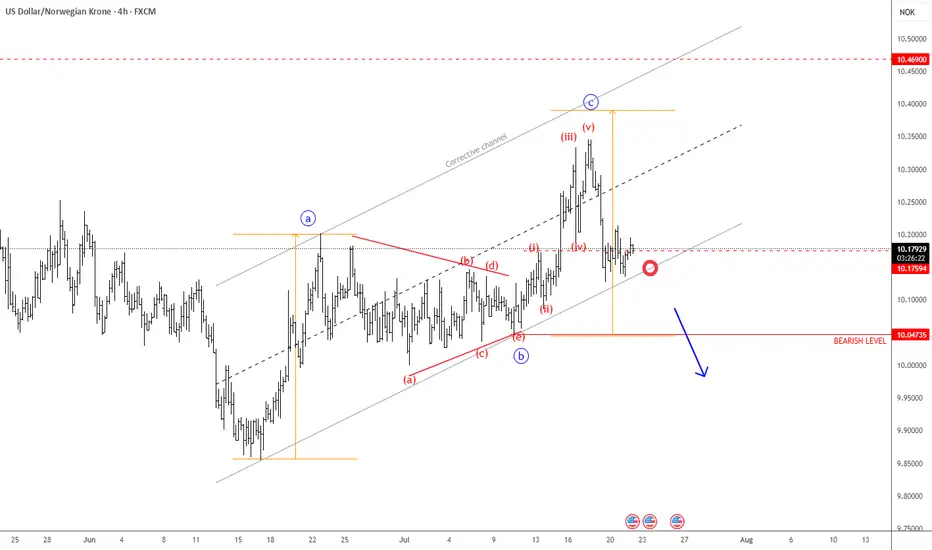
USDNOK Remains BearishUSDNOK made a three-wave rise from the recent low, indicating an abc correction within a downtrend—especially considering the triangle in wave "b" in the middle, and the current sharp decline following a completed five-wave impulse in wave "c". As long as this structure remains intact, there is still a risk of another leg lower. Therefore, we can expect further weakness toward the June lows, especially if it breaks below the channel support line. Just watch out for short-term intraday pullbacks.
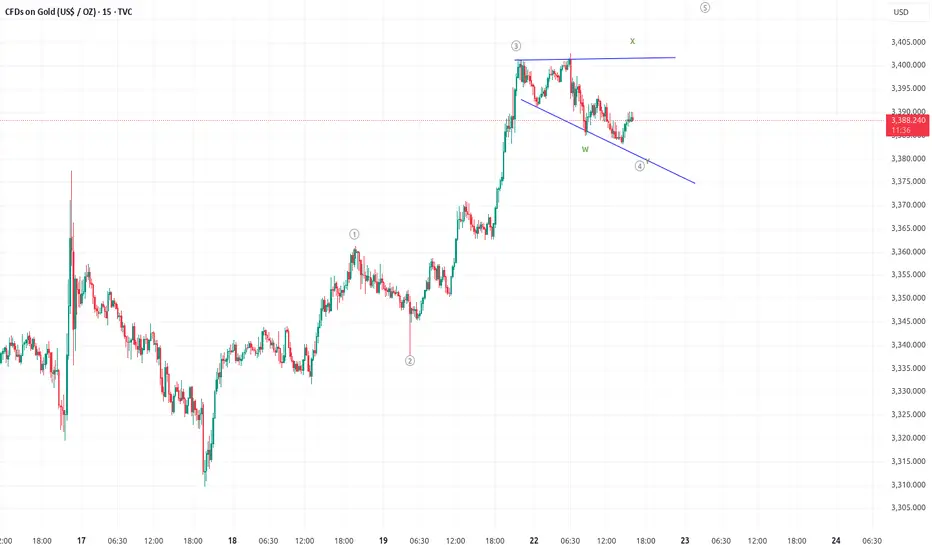
Elliott waveThe market is running the xwz correction wave after running the trend.
Buy zone: 3375-3380, stoploss 3365, tp 3410
BTCUSD H1 - 22/7/2025BTCUSD H1
As shown, we are in wave 4 with 2 scenarios:
1- Wave 4 is triangle.
2- Wave 4 is Zigzag.
Thanks

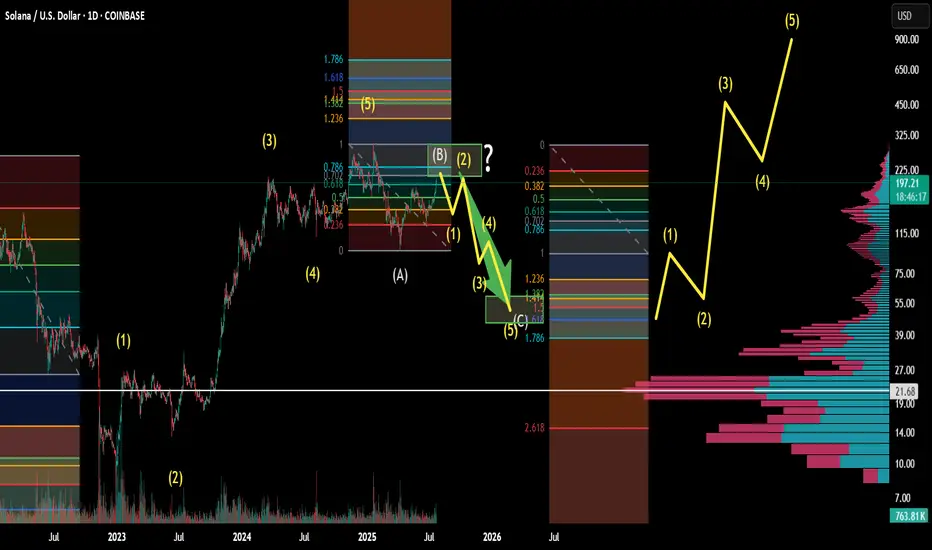
Solana Macro Cycle Elliotwave countTop has been in for solana since going back to ATH. We are in a bear market retrace rally. Looking to scoop between 50-40 about 1 year from now. Let me know what you think below.
Trading alts on solana right now during the retrace rally, then potentially looking to rotate into radix plays or other coins finishing their wave 2's