#GBPNZD more bearish move to comeThis is my prediction for GBPNZD for the next couple of days.
As you can see in the chart, the price seems to be completing a 5-wave bearish impulsive move, which could end by tomorrow.
Following this bearish move, we could assume a bullish corrective ABC formation, which could take us all the way back to the level indicated by the arrow.
From there, we could expect another impulsive bearish move, which could be either wave 3 or wave C.
We do not know this for sure at this point, so we should wait and analyze the price action once the time is relevant.
Let me know if you would like me to publish an analysis in a lower timeframe on this chart to take advantage of this rally.
Elliotwaveanalysis

Polycab in Flag TrendPolycab NSE:POLYCAB in Flag Trend. You can buy above 6850 and 1st target would 7120 and next Target would be 7860, which you can achieve using GTT

#GBPJPY Elliott wave analysisThere is a high possibility that we are approaching the end of wave 3 of a 5-wave bearish impulsive move.
At the end of this current minor bearish move, we could expect a bullish 3-wave corrective move, which could complete wave 4. After this correction, we should anticipate another drop to complete wave 5.
Let me know if you would like me to publish an analysis in a lower timeframe on this chart to take advantage of this rally.

#GBPCAD bearish scenarioBearish divergence in the 4H timeframe, as well as price failing to create a new high, shows potential weakness in the uptrend.
Furthermore, from an Elliott wave perspective, it seems like we are at wave 5 of 5, with a high potential for a bearish move from here.
In the 1H timeframe, we can see that the price managed to break below the previous higher low, successfully changing the structure towards bearish in the 1H timeframe.
Let me know if you would like me to publish an analysis in a lower timeframe on this chart to take advantage of this rally.

Navigating the Waves: Elliott Wave Theory and Key IndicatorsEducational Technical Analysis on example chart of UFO Moviez India
Elliott Wave Analysis and Key Moving Averages
Disclaimer
This study is for educational purposes only and does not constitute trading or investment advice. The analysis presented focuses on one potential scenario based on Elliott Wave Theory and other technical indicators. Trading and investing involve substantial risk, and individuals should consult a financial advisor before making any decisions.
Introduction to Elliott Wave Theory
Elliott Wave Theory is a form of technical analysis that traders use to analyze financial market cycles and forecast market trends by identifying extremes in investor psychology, highs and lows in prices, and other collective activities. The theory posits that stock prices move in predictable patterns or "waves" based on investor sentiment.
Principles of Elliott Wave Theory
1. Wave Patterns: According to Elliott, market prices move in five waves in the direction of the main trend (impulse waves) and three waves in a correction against the main trend (corrective waves).
2. Wave Degrees: Waves are fractal in nature, meaning that smaller waves form part of larger waves, and this pattern repeats on all time frames.
3. Wave Characteristics:
- Wave 1: Usually the smallest impulse wave.
- Wave 2: Corrects Wave 1 but does not exceed its starting point.
- Wave 3: Typically the strongest and longest wave.
- Wave 4: Corrective wave that is usually less severe.
- Wave 5: Final leg in the direction of the main trend.
Current Analysis of example chart of UFO Moviez India
Based on the chart and Elliott Wave Theory, UFO Moviez India is currently suggesting an impulsive and momentum-driven 3rd of the 3rd wave ahead, with an invalidation level at 106.
Key Observations:
1. Wave Count:
- Wave (1): An initial 5-wave impulse has completed.
- Wave (2): A corrective ABC pattern.
- Wave (3): Currently unfolding with sub-waves i, ii, iii, iv, and v marked.
- Wave 3: In the larger context is forming.
2. Breakout:
- There is a breakout above the downward trendline with good volumes, indicating strong bullish momentum.
3. Key Moving Averages:
- Price Trading Above:
- 50 EMA, 100 EMA, and 200 EMA
- 50 WEMA, 100 WEMA, and 200 WEMA
- Crossed above 20 MMA
Technical Indicators and Levels
- Price: 148.54 INR (as of the latest close)
- Support Levels:
- Nearest Invalidation Level: 106 INR
- Major Support: 57.20 INR
- Resistance Levels:
- Immediate Target: 175.58 INR (Wave 1 of larger degree)
- Fibonacci Extension Target: 220.51 INR (1.618 extension of Wave 1)
Conclusion
The Elliott Wave analysis of example chart of UFO Moviez India indicates a potentially strong bullish trend as the stock is in the 3rd wave of a larger impulse. The breakout above the trendline with significant volume further supports this bullish outlook. However, it is crucial to monitor the invalidation level at 106 INR, as a break below this level could invalidate the current wave count and suggest a different scenario.
Educational Purpose Notice
This analysis is provided for educational purposes only. It is not an investment or trading advice or tip. Trading and investing in financial markets involve risk, and it is important to do thorough research and consult with a financial advisor before making any investment decisions.
I am not Sebi registered analyst.
My studies are for educational purpose only.
Please Consult your financial advisor before trading or investing.
I am not responsible for any kinds of your profits and your losses.
Most investors treat trading as a hobby because they have a full-time job doing something else.
However, If you treat trading like a business, it will pay you like a business.
If you treat like a hobby, hobbies don't pay, they cost you...!
Hope this post is helpful to community
Thanks
RK💕
Disclaimer and Risk Warning.
The analysis and discussion provided on in.tradingview.com is intended for educational purposes only and should not be relied upon for trading decisions. RK_Charts is not an investment adviser and the information provided here should not be taken as professional investment advice. Before buying or selling any investments, securities, or precious metals, it is recommended that you conduct your own due diligence. RK_Charts does not share in your profits and will not take responsibility for any losses you may incur. So Please Consult your financial advisor before trading or investing.

GRSE in Flag PatternGRSE NSE:GRSE has formed a flag Pattern. You can Buy above 2400 and Target is 3400

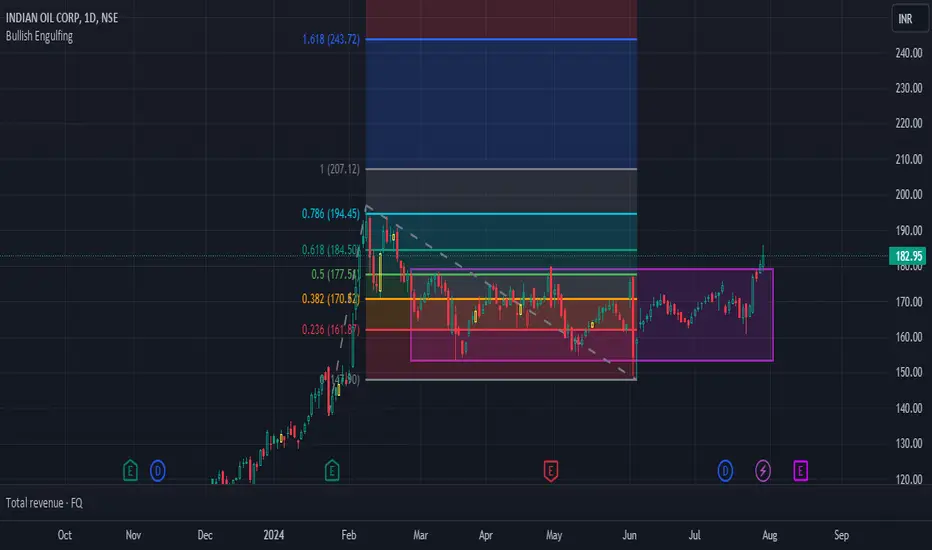
IOC BreakoutIOC NSE:IOC looking for a breakout after Consolidation. Buy above 184 and 1st target would be 207. The Next Target would be 240, however this can be achieved using GTT if you are ready to take Risk!
#GBPUSD begining of a 3wave corrective moveAs can be seen, the price appears to be completing a 5th wave of 5, indicating the end of a bullish impulsive move that reached the upper channel line. Now, we could expect a bearish move in the form of an ABC correction or a reversal.
To open a position, we should wait for a bullish corrective move, which could be either wave B or 2, and then try to catch wave C or 3.
Let me know if you would like me to publish an analysis in a lower timeframe on this chart to take advantage of this rally.

BITCOIN - Don't Miss This Move Hey Traders,
It look likes that Bitcoin has completed its first impulse up. Break of 8H 50 EMA means that the correction has started. Expecting this correction to be completed around our buy zone.
LONG Setup:
- Wait for subwave 2 to be formed.
- Watch any rejection at the buy zone
- Stoploss: Below recent lows
- Targets: 73k,80k,90k, and 100k
Good Luck and Trade Safe.

Gold Dominance in age of fiscal dominance Gold price made triple bottom at 1620 two years ago since than gold flying on daily chart
Rich people and central bank gold buying because us fiscal policy is dominating fed monetary policy. One of the biggest reasons economists forecast of recession has been proven wrong constantly.
If USA doesn’t stop its government spending and fed easy money policy aka fed put
Than dollar collapse can drive gold price much higher longer term
Or if things reverse soon or after election than gold can stop going up too

#CHFJPY elliot wave analysisAs can be seen, it looks like we are dealing with an ABC bullish corrective wave pattern, currently in wave 4 of wave C. There is a possibility of another short-term bullish move to complete wave C.
From there, we could look for selling opportunities in the direction of the higher timeframe trend.
Let me know if you would like me to publish an analysis in a lower timeframe on this chart to take advantage of this rally.

GBPAUD Potential Buy SetupGBPAUD Buy setup in view
One more leg before a reversal ?
Time will unveil

Gold's Next Big Move: Will It Skyrocket or Plummet? Expert View!Major Support / Resistance Zone:
This zone is marked clearly on the chart and acts as a significant level where price has previously reversed or consolidated. It's crucial to monitor how price reacts around this area.
Wave Analysis:
The chart shows a clear Elliott Wave structure, with a 5-wave pattern identified. Waves (1) to (5) represent the motive waves, and the correction waves are seen in between.
Bearish Flag #1 and #2:
These flags indicate periods of consolidation following a downward movement, suggesting potential for continuation to the downside. They are often characterized by lower highs and lower lows forming within a channel.
Descending Channel:
The descending channel provides a clear bearish structure, with price making lower highs and lower lows. This channel acts as a guide for potential price movement, indicating bearish sentiment as long as the price remains within this structure.
Daily Bull Flag:
This larger bullish flag formation suggests a longer-term bullish potential if price breaks above the flag's upper boundary. It's a key pattern to watch for potential upside.
1HR LQZ / Reversal Zone:
This liquidity zone (LQZ) is marked as an area where a significant amount of orders might be present, potentially leading to reversals or significant price reactions.
4HR LQZ:
Similar to the 1HR LQZ, but observed on the 4-hour timeframe, suggesting a more significant potential reversal or consolidation area.
Bullish Potential:
If the price breaks above the 1HR LQZ / Reversal Zone and the descending channel, there is a bullish potential up to the levels marked on the chart. The structure would need confirmation through higher highs and higher lows.
Bearish Potential:
If the price fails to break above the descending channel and instead moves below the 4HR LQZ, a bearish continuation is likely, potentially targeting lower support levels.
Summary
The chart indicates a potential for both bullish and bearish scenarios depending on how the price reacts to the identified key levels (major support/resistance zone, 1HR and 4HR LQZs, and the descending channel).
Bullish scenario: Break above the 1HR LQZ and the descending channel, leading to a continuation towards higher levels.
Bearish scenario: Failure to break above the descending channel and a move below the 4HR LQZ, indicating a continuation to the downside.
This analysis should help in making informed trading decisions based on the observed technical patterns and key levels.

USD/CAD: Bullish impulse is calling for a breakout USDCAD is making a pretty strong rise after the Bank of Canada lowered rates by 25 basis points as expected this month. The price is now testing the major trend line resistance of higher degree triangle on the daily chart, connected from October 2022, and we are wondering if will breakout, which is certainly possible in a risk-off environment, with lower stocks and also lower crude oil.
Support on dips is at 1.3780
GH

Clarifying Solana's Path Hey friends,
I always try to stay away from any specific news or events and focus solely on clarifying my path using Elliott Waves.
After spending some time analyzing Solana's chart, here's what I've found:
Solana has recently completed its fourth wave and has started forming its fifth wave. In the image, there's a clear parallel channel that I've explained.
The question is: What happens now? ☝️
There are two possibilities:
1. All five waves have formed correctly and completely.
2. The fifth wave is not complete and is still forming.
Let's examine both scenarios 🙌🏽. I'm approaching this with an unbiased perspective.
If the first scenario is correct and the five waves are complete, we are now in wave a, which could present good selling opportunities. If the second scenario is true, we are now in wave 2 of the five waves, which could present good buying opportunities.
But how can we determine which scenario will play out? I'd love to hear your thoughts, whatever they may be.
Your friend, Rabbit ❤️

notcoinnotcoin techinical analysis basically on elliott waves Principles and price action strategies
not coin can be give you a great opp to trade..short it
wait and watch

#BTCUSD next week predictionIn BTC, we are either in wave 5 of iv, which could mark the end of the rally that started on July 5th, leading to an abc corrective move as indicated by the dotted line.
Alternatively, we could be in wave 5 of iii. In this scenario, we might see a bearish corrective move followed by wave iv, which would then complete the rally.
In either case, it appears that we are approaching a top, and the extent of the impending bearish move depends on the wave count.
Let me know if you would like me to publish an analysis in a lower timeframe on this chart to take advantage of this rally.

BLX Global Final View - BTC - $1 000 000 ?According to Wave Theory:
In the impulses of a wave of the same degree, channelization is observed
2 wave is most often a zigzag
2 wave is most often a deep correction
3 wave equals 1.618*1 wave.
The 3rd wave is the most powerful
4 wave is most often flat according to the rules of alternation
5 wave is mostly equal to 1 wave
BUT
Bitcoin is a commodity market
And in commodity markets, the 5th wave is most often extended.
At what price will YOU exit?

btcbtc technical analysis basically on elliott waves Principles and price action strategy
bitcoin can be make a wave 2 in 60000$
wait and watch...

Wipro Case Study: Elliott Wave Analysis for Educational PurposesWIPRO multi time frames charts updated
Weekly Chart
Daily Chart
4 Hourly
60 Min
In this educational case study, we delve into the chart analysis of Wipro using Elliott Wave Theory. Our analysis focuses on identifying potential wave patterns and understanding the current wave structure for educational purposes only.
Overview:
After a significant decline in the larger Wave (4), Wipro appears to have initiated Wave 1 of (5). Within Wave 1 of (5), we have observed completion of sub-waves (i)-(ii)-(iii), and (iv) is nearing completion. The current structure suggests that sub-wave (v) of Wave 1 of (5) could soon commence.
Detailed Analysis:
Wave (4) Correction: Wipro experienced a notable decline in Wave (4), signaling a potential shift in sentiment.
Wave 1 of (5): Following Wave (4), the stock initiated Wave 1 of (5), marked by the completion of sub-waves (i)-(ii)-(iii).
Current Structure: We are currently witnessing the final stages of sub-wave (iv) of Wave 1 of (5), with sub-waves i-ii-iii-iv completed.
Anticipated Movement: Sub-wave (v) of Wave 1 of (5) is expected to commence soon, potentially marking the final fall before an upward move.
Risk Management and Wave Highlights:
It's essential to implement proper risk management strategies, including setting stop-loss levels to mitigate potential losses.
Traders should exercise caution and remain vigilant for any deviations from the expected wave counts.
Understanding Elliott Wave Theory can provide valuable insights into market trends and potential price movements.
Remember, this analysis is for educational purposes only and should not be considered as trading advice.
I am not Sebi registered analyst.
My studies are for educational purpose only.
Please Consult your financial advisor before trading or investing.
I am not responsible for any kinds of your profits and your losses.
Most investors treat trading as a hobby because they have a full-time job doing something else.
However, If you treat trading like a business, it will pay you like a business.
If you treat like a hobby, hobbies don't pay, they cost you...!
Hope this post is helpful to community
Thanks
RK💕
Disclaimer and Risk Warning.
The analysis and discussion provided on in.tradingview.com is intended for educational purposes only and should not be relied upon for trading decisions. RK_Charts is not an investment adviser and the information provided here should not be taken as professional investment advice. Before buying or selling any investments, securities, or precious metals, it is recommended that you conduct your own due diligence. RK_Charts does not share in your profits and will not take responsibility for any losses you may incur. So Please Consult your financial advisor before trading or investing.

BTCUSD BTC Dominance 61.8%After a long triangle in wave 4
Domination Bitcoin went for a breakout to possible 61.8% Fibonacci targets

SOLUSD Next Move ~$200+ After reaching the $185 mark, Solanium headed for a correction.
Within the channel there was a decline to the lower boundary
The 4th wave basically always comes in the range of the 4th wave of a smaller degree
The correction in the 4th wave mostly occurs within the 61.8% Fibonacci range
According to the wave theory, all the necessary conditions for correction have been met and Solanium is most likely moving within the 5th wave to the $200+ mark

BTCUSD Next Move ~$75kAfter reaching the $68k mark, Bitcoin headed for a correction.
Within the channel there was a decline to the lower boundary
The 4th wave basically always comes in the range of the 4th wave of a smaller degree
The correction in the 4th wave mostly occurs within the 61.8% Fibonacci range
According to the wave theory, all the necessary conditions for correction have been met and Bitcoin is most likely moving within the 5th wave to the $75k mark
