AVAX: Low in Sight?AVAX continued its expected decline into the magenta Target Zone between $24.42 and $13.31, before reversing course over the weekend with a modest bounce. While it's possible that this marked the low of the wave ii correction, we're not ruling out the potential for another dip within the zone. For now, the setup remains open-ended. Once orange wave ii has been confirmed as complete, we expect a strong rally to follow in wave iii, likely driving the price beyond resistance at $49.95.
📈 Over 190 precise analyses, clear entry points, and defined Target Zones - that's what we do.
Elliotwaveanalysis

BTC: Still in the Grip of Wave BBitcoin is holding steady near the same levels seen at the time of yesterday’s update — and so is the structure. According to our primary scenario, we expect the current corrective wave B to complete soon within the blue Target Zone between $117,553 and $130,891. Once that happens, a wave C selloff should follow, likely targeting the lower blue Target Zone between $62,395 and $51,323. That said, our alternative scenario (30% probability) remains intact. In that case, the high of blue wave (i) has yet to form — a breakout above $130,891 would confirm that view and open the door to further upside before a correction resumes.
📈 Over 190 precise analyses, clear entry points, and defined Target Zones - that's what we do.

ADA is going to catch big targetsWe are currently experiencing a Wave 2 correction after completing an impulsive Wave 1. Once the ABC correction is complete, we can expect to enter an impulsive Wave 3. As time goes on, if it seems like we are entering Sub-Wave 1 of Wave 3, I will publish an idea to outline new targets. For now, we should anticipate new movements in the market.

EUR/USD Forecast: Impulse Wave Progressing TowardThe EUR/USD is currently exhibiting a well-defined impulsive structure following the completion of a corrective (ABC) phase. The market has successfully formed waves (1) and (2), and is now advancing within wave (3), which typically carries the most momentum in an Elliott Wave cycle.
The ongoing rally suggests wave (3) is targeting the 1.15350 level — a key Fibonacci projection area that aligns with previous structural resistance. Momentum remains strong, supported by bullish market structure and sustained buying pressure.
Should wave (3) conclude near this zone, a brief corrective pullback into wave (4) is anticipated, likely retracing toward the 1.14440–1.14730 support range. This would offer a potential entry opportunity before the market resumes its higher trajectory in wave (5), targeting the 1.16077 level.
T1: 1.14857
T2: 1.15090
SL: 1.13867

BTC: Slowing DownBitcoin managed to stabilize over the weekend after its recent slide, nudging slightly higher from local lows. We continue to expect the current rebound—interpreted as wave B—to stretch into the blue Target Zone between $117,553 and $130,891. Once that move tops out, the next leg lower should follow, with wave C driving the price into the lower blue zone between $62,395 and $51,323. That would likely complete wave a in orange and pave the way for a temporary recovery before wave b rolls over into the final drop of wave (ii). The alternative scenario, which we’re still assigning a 30% probability, assumes Bitcoin is already in wave alt.(i) in blue—a more bullish path that would extend the rally well beyond $130,891 without another major correction first.
📈 Over 190 precise analyses, clear entry points, and defined Target Zones - that's what we do.

Mastercard: Approaching the Top of Wave BMastercard has rebounded after a brief cooling period, and we now expect turquoise wave B to complete just below resistance at $620. Once that top is in, wave C should drive a meaningful retracement, ending with the low of magenta wave (4). Alternatively, if turquoise wave alt.(4) has already bottomed — which we estimate as a 40% probability — then a direct breakout above $620 would suggest a shift toward a much more aggressive advance. That path would take the stock straight into magenta wave (5), completing blue wave (I) with a strong rally.
📈 Over 190 precise analyses, clear entry points, and defined Target Zones - that's what we do.

NZDUSD SHORTNZDUSD could possible short to complete a C leg of a possible expanded flat or running flat correction before the big buy

PIXELUSDTThe outcome of this analysis is that based on the structure of a zero - D wave, which may be a pig or triangle, or even a pig, we should look for the optimal areas to buy Spot …
In the event that this analysis is correct, it may be ideal to purchase Spot in the vicinity of Beijing to the tribes.
A cautious target for the Chinese outbreak and a more risky target could be a dollar casualty.
In time terms too, mid - June and more accurately the beginning of the third week of June would be the ideal approximate time for the start of the DC wave …
As indicated in the chart late July and early September are important times in the chart that will probably work depending on the structure and my guess is that the mentioned times are the ideal time for the end of the larger D - wave …

Link Analysis (12H)Chainlink (LINK) Technical Outlook – Elliott Wave Perspective
After applying Elliott Wave Theory, the chart appears to speak for itself — the downward corrective phase seems to have concluded.
Zooming into lower timeframes, there are several bullish signs suggesting that LINK is primed for an upward move.
Key Technical Reasons Supporting Upside Potential:
Bullish Flag Formation: A clear flag pattern has formed in lower time frames, and LINK is currently testing its resistance level.
Elliott Wave Count: Based on wave structure, Wave 3 appears to be nearing completion. Should we see a short-term pullback, it would likely be Wave 4, offering a strong buy opportunity around the support zone of the flag.
Fib Confluence: The potential retracement aligns perfectly with the 50% Fibonacci level — a typical target area for Wave 4 corrections.
Two Possible Scenarios:
Immediate Breakout: With support from Bitcoin’s continued momentum, LINK could extend its current Wave 3 and break out from the flag without any significant pullback.
Healthy Correction: Alternatively, LINK could retrace to the 50% Fib level before initiating the final leg of Wave 5 — providing a textbook buying opportunity.
Target:
In both scenarios, the upside target remains the same: $18.00 to $18.40 range.
— Thanks for reading.

SUI (Daily) Elliot wave ii underwaySUI appears to have completed a motif wave (1) with an ending diagonal after finding a bottom at the major support high volume node (HVN) macro wave 4.
Wave 2 has not retraced as deep as other alt coins showing strength in the move up. The downside target is the HVN it has just tested at the 0.382 Fibonacci Retracement $2.95.
Wave 3 should be a powerful move up taking price into all time high.
Failure to hold this support could see price heading back to fresh lows and testing the $1.6 HVN once more.
Safe trading

SOL Local Elliot Wave ii UnderwaySolana appears to have completed a motif wave 1 after finding a bottom at the major support high volume node (HVN) macro wave 4.
Wave 2 has not retraced as deep as other alt coins showing strength in the move up. The downside target is the HVN at $140 at the 0.5 Fibonacci Retracement.
Wave 3 should be a powerful move up taking price into all time high.
Failure to hold this support could see price heading back to fresh lows and testing the $90 HVN once more.
Safe trading

ONDO (Daily) Elliot Wave ii UnderwayONDO appears to have completed a leading diagonal for wave 1 after finding a bottom at the major support high volume node (HVN).
Wave 2 has retraced to the expected alt coin Golden Pocket at the 78.6% retracement tapping high volume node.
The descending resistance line has been tested as support leaving a dragonfly doji but does not look strong enough to be the bottom yet.
Wave 3 should be a powerful move up.
This analysis is invalidated below macro wave 2 -$0.65
Safe trading

HBAR (Local) Elliot Wave ii UnderwayHBAR appears to have completed a leading diagonal for wave 1 after finding a bottom at the major support high volume node (HVN).
Wave 2 has retraced the expected 61.8% Fibonacci but alt coins have their own Golden Pocket at the 78.6% retracement which aligns with the S1 pivot and high volume node.
The descending resistance line has been tested as support leaving a doji but does not look strong enough to be the bottom yet.
Wave 3 should be a powerful move up.
This analysis is invalidated below macro wave 4 -$0.12556
Safe trading

Elliot wave - Elopak This is my analysis of Elopak in Norway. We are facing a final push before we might see a potential correction

Maybe your biggest risk is your biggest chance !!!The price is currently forming the second corrective wave, and a slight price drop to reach higher levels is normal.
Give me some energy !!
✨We spend hours finding potential opportunities and writing useful ideas, we would be happy if you support us.
Best regards CobraVanguard.💚
_ _ _ _ __ _ _ _ _ _ _ _ _ _ _ _ _ _ _ _ _ _ _ _ _ _ _ _ _ _ _ _
✅Thank you, and for more ideas, hit ❤️Like❤️ and 🌟Follow🌟!
⚠️Things can change...
The markets are always changing and even with all these signals, the market changes tend to be strong and fast!!

"Gold Analysis Using Elliott Wave: Prolonged ABC Correction"I believe that gold is currently undergoing a significant and prolonged ABC correction. At the moment, we are in a subordinate wave structure, specifically within a WXY correction pattern, marked on the chart with , , , , , and in red.
For the upcoming weeks and days, it is crucial to observe the potential price movements. In my chart, I have drawn the larger timeframe with white lines to illustrate the overarching trend, while a red line indicates the smaller, subordinate wave structure.
Currently, we are in the red-marked WXY zone, which suggests that around the 3,286 level could be an ideal point to enter a long position targeting higher levels in wave Y. Conversely, this could also be an opportune moment to short down to wave B and then C.
On the short-term chart, we are at point A, marked in yellow. After reaching A, I expect a trend reversal within the highlighted rectangle towards B (also marked in yellow), followed by an upward move to C.
Subsequently, we may see a five-wave decline labeled as i, ii, iii, iv, v. After this decline, a corrective upward movement is anticipated, characterized by an ABC pattern.
These are my expectations for gold based on this analysis. Please note that this information is for educational purposes only; there are no guarantees regarding trade execution or outcomes. Whether you decide to enter a position or not depends solely on your own judgment.

SUSDT - 1WThe previous bullish analysis failed and I currently expect a correction to the range of 0.3 to 0.33 cents...

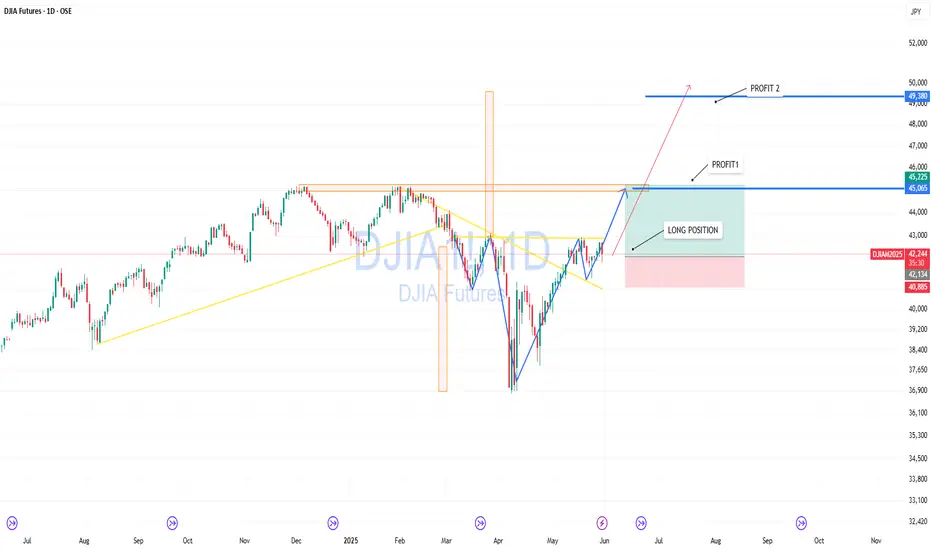
DJIA — Setting Up for Breakout and New ImpulseThe Dow Jones Index is approaching a critical resistance zone. After a deep V-shaped recovery and clear bullish structure, price is preparing for a breakout.
Chart shows a clean long entry with a stop below the recent consolidation. A break and hold above 45,000 could lead to a move toward 46,000, and if momentum holds — up to 49,300.
Partial profit-taking levels:
— Target 1: 45,225
— Target 2: 49,380
Fundamentally, US equity markets remain strong, and DJIA may play catch-up after lagging during the last correction.
CHFJPY SHORTCHFJPY is expected to continue tanking to complete the ABCDE triangle corrected before the up-surge to follow the dominant trend. shorting on current price action to complete the triangle wave correction

EURJPY SHORTwith safe haven assets expected to be bullish, i expect JPY to be strong against risk on currency like euro. EURJPY is expected to fall to complete a triange formation in the coming weeks before the bullish impulsive leg.

A look at monthly Chart of BTCIf we count Elliot Wave at weekly or monthly, we see we are at the ABC Correction of the Primary Impulsive wave, that the ABC might create an Irregular or Expanded Flat. I think the chart is going to create a C wave of the ABC Primary wave, and those numbers might be a target, but according to Fibbonaci Levels, 0.618, which is 40,000. Other targets can also be seen on the chart.

Tracking a pattern that could signal the Top is In I am tracking a micro pattern with the new local high made in the ES last night and today's price action as a micro 5-down....we should get a slight retrace into the 5960 ish area. Maybe tomorrow...maybe in the overnight session tonight.
If price can then breach todays micro low of 5884 in the ES futures...we need to then follow through with a breach of 5857 to give us our first indication, we may have struck a top.
From there I am following 2 counts...Purple, or my primary count which is a minor C of Intermediate (A).
Best to all,
Chris
