Ripple is Nearing The Main Trend!!Hey Traders, in today's trading session we are monitoring XRPUSDT for a selling opportunity around 2.16 zone, Ripple is trading in a downtrend and currently is in a correction phase in which it is approaching the trend 2.16 support and resistance area.
Trade safe, Joe.
Elliotwaveanalysis

Hellena | GOLD (4H): LONG to resistance area of 3400.Colleagues, I've redrawn the waves a bit, because it looks like the correction should be over.
I believe that the upward movement will resume soon.
I expect two variants of events:
1) the price will reach the support area 3162, form wave “4” and after that we will see an upward movement - this is a variant of entering a position with pending limit orders.
2) Price has already formed wave “4” and then we will see only upward movement. This is a variant of market entry.
In both cases I expect the price to come to the target in the resistance area of 3400. This is a pretty strong level from which there could be a strong correction.
Manage your capital correctly and competently! Only enter trades based on reliable patterns!

PENGUUSDTA risky analysis of a popular meme coin..
Based on this analysis, we are in wave 4 and it is expected to end soon and enter wave 5..
Around 0.091 to 0.085, if the price reaches it, it will be suitable for a short swing to the target of 0.0163 and 0.0175..
Ideal time zones are also marked with low tolerance..
This analysis can be easily filled..

$SPX Rejection at Resistance – Watch 5582 for the Next Major Mov📉 After tagging the 5685–5750 resistance zone, SP:SPX is flashing major downside risk.
🔍 Key Zones:
✅ Resistance tapped: 5705–5838
🟨 FVG (Fair Value Gap): 5642–5582
❗ Daily close below 5582 → Bearish WXY structure confirmed
🟥 Hard invalidation for bulls: 4835.04
💡 I’m open to a retest of the 200DMA (currently 5746), but below 5582 I wouldn’t expect a new high.
This setup offers clear structure, risk-defined short entries, and a measured breakdown scenario if support fails.

Looking for One More High So far, our minor B wave price action has not thrown us any curveballs, which is somewhat unusual considering B waves can become very complex. As I get into the micro price action, this pattern would fit better completed with at least one more high.
Nonetheless, I will offer a warning, we are in the target box...if you are long, please use stops, and make sure your position size is risk managed.
Best to all,
Chris

USD/MXN Mirrors 2017 Reversal; Elliott Wave Pointing Lower Back in 2016–2017, we first saw a very sharp recovery on USD/MXN, but when Trump took office in January 2017, the market reversed strongly lower, falling all the way from 22 to 17.60, lost nearly 20% . That very similar pattern is now becoming visible again with 2024–2025 price action. Last year, after Trump won the US election, we saw significant depreciation of the Mexican peso, but since he has officially taken office in January, we’re seeing a complete reversal—just like in 2017.
In fact, the Mexican peso has been gaining nicely over the past few months, likely based on speculation that Trump will find the agreement and trade deals with other countries, particularly related to tariffs. Since no one really benefits from trade wars, it’s not surprising that even Trump’s recent remarks reflect an acknowledgment of the global situation being unsustainable, especially when it comes to CHINA-US trade.
With that in mind, markets in general are likely to recover, and we’re already seeing some nice rebounds. And when stocks are in recovery mode, commodity currencies—including the peso—tend to perform well.
Looking at USD/MXN specifically, we’re seeing a strong reversal down from February highs, just like in 2017. The current drop hasn't even retraced 38.2% of the 2024 rally yet, which suggests more downside is likely—ideally toward the 19.00 area, maybe even 18.00 by year-end.
From an Elliott Wave perspective, it's useful to zoom in on smaller time frames. The structure doesn’t look like completed impulse yet, so technically there can be more weakness coming. Resistance for wave four rally sits around the 19.77–19.84 zone, which aligns with Fibonacci projections for wave four, as well as swing lows from March and April.
This area could serve as a nice resistance of the current bounce, especially if the Fed delivers any dovish remarks this week. No rate cuts are expected, but even a hint at future cuts could send the US yields lower, which would weigh on the dollar and support risk assets—meaning commodity currencies could outperform.
In that case, USD/MXN could ideally fall back below 19.50.
Elliott Wave analysis also helps define clear invalidation levels, very important when it comes to potential trade setups. In this scenario, 20.16 is a key level to watch. A break above it would overlap with the start of the current move and signal that the bears are finished for now, thus I would need to adjust the view accordingly.
Grega

SPX Running Into Important Resistance At 5780Last week we saw a weaker-than-expected Advance GDP in the first release, which led some to believe Powell might consider cutting rates. But Friday’s NFP came in better than expected. Expectations are no change for the Fed, and I honestly don’t believe they’ll move either.
Despite Trump putting pressure on them, inflation is still not at their 2% target, and the job market remains solid—so there may be no real reason to cut yet.
They’re watching markets too, and we've seen a pretty strong rebound, so there’s likely no urgency to act now.
Also, if they were to cut, it could appear politically motivated due to Trump, and that could seriously damage investor trust in the Fed’s independence.
So with that being said, we are wondering if the SPX can find some resistance if FED does not deliver a dovish view at this moment. Well, looking at the price action, it certainly looks overlaping recovery from April low, that can face limited upside near 5780, at April 2nd high.
If by Friday, we close above the 78.6% Fib then we may look at wave 3, alt sceario.
Grega

Hellena | Oil (4H): SHORT to support area of 55.204.Colleagues, I believe that the price will continue its downward movement. At the moment we are observing a combined correction. I expect the completion of wave “Y”. Even if it is already completed, the price is still waiting for a downward correction to the support area of 55.204. Therefore, I think that 55.204 is the 1st minimum target.
There are two possible ways to enter the position:
1) Market entry
2) Pending Limit orders.
Manage your capital correctly and competently! Only enter trades based on reliable patterns!

Hellena | EUR/USD (4H): LONG to the resistance area 1.15878.Colleagues, I believe .that the five-wave movement is not over yet and another wave of upward movement is waiting for us.
I believe that wave “4” has almost completed the correction or has already completed it. In any case, I consider the main target to be the resistance area at 1.15878, which is the minimum target and the top of wave “3”.
Manage your capital correctly and competently! Only enter trades based on reliable patterns!

possible short entry reversal point!Levels to keep an eye on for BOS for a high possibility short entry. In order to reach the higher levels a ABC structure is vital. looking for trendline break for confirmation.

BTC.D(based on NEo wave)I changed my idea about midterm but not about longterm!
Altseason will make a heavy downtrend for this in a few months later which I call it wave E

Hellena | BITCOIN (4H): LONG to resistance area of 98,000.Dear colleagues, in this forecast I will not make too forward-looking plans. I believe that the upward movement is not over yet, because the wave “C” is not yet completed and consists of five waves.
I think that we should expect to reach the resistance area of 98,000. A small correction to the support area of 90,000 is possible.
Manage your capital correctly and competently! Only enter trades based on reliable patterns!

USD/JPY Eyes Breakout After Healthy Wave 4 CorrectionThe USD/JPY pair is currently unfolding a clean impulsive 5-wave structure to the upside. The price action has already completed Waves 1, 2, and 3, and has entered a probable Wave 4 correction.
Wave 3 appears extended and tapped into a key Fair Value Gap (FVG), which acted as resistance.
Wave 4 is likely to develop as a shallow retracement, possibly forming a bull flag or expanded flat before launching into Wave 5.
The ascending channel supports the bullish structure with both Wave 2 and Wave 4 respecting lower bounds.
Targets: 144.750 - 144.351
Stoploss: 146.268

B wave short incoming!if eth breaks its local top before making a double bottom this trade idea is invalid.

Hellena | GOLD (4H): SHORT to 38.2%-50% Fibo lvl 3228.Colleagues, last week we got a stoploss, but I still believe that we should expect a correction in wave “2”. We will try to catch this movement this week.
I believe that the price will correct to the area of Fibonacci 38.2% - 50% levels (3228.41).
Perhaps the price will slightly renew the maximum of wave “1”, reaching the level of 3438. In this case I recommend to work with pending limit sell orders.
And some data:
The prevalence of bulls according to CME reports additionally increased by 13%.
The 23% increase in market volume, meanwhile, indicates a likely strong momentum pattern during the trading week.
Despite the 13% increase in buyers, selling patterns towards the balance level of the week (3200.00) are recommended for the current trading week.
Manage your capital correctly and competently! Only enter trades based on reliable patterns!

Hellena | SPX500 (4H): LONG to resistance area of 5682.Colleagues, I think that the deep downward movement is over and at the moment I expect an upward movement in a five-wave impulse. At the moment I expect a correction in wave “2” to the area of 5100, after which I expect the development of wave “3” at least to the resistance area of 5682.
There are two possible ways to enter the position:
1) Market entry
2) Pending Limit Orders.
Manage your capital correctly and competently! Only enter trades based on reliable patterns!

Bajajfinance holding periods decades#bajfinance will break out of this two year triangle, has a huge potential for long run of becoming blue-chip stock,

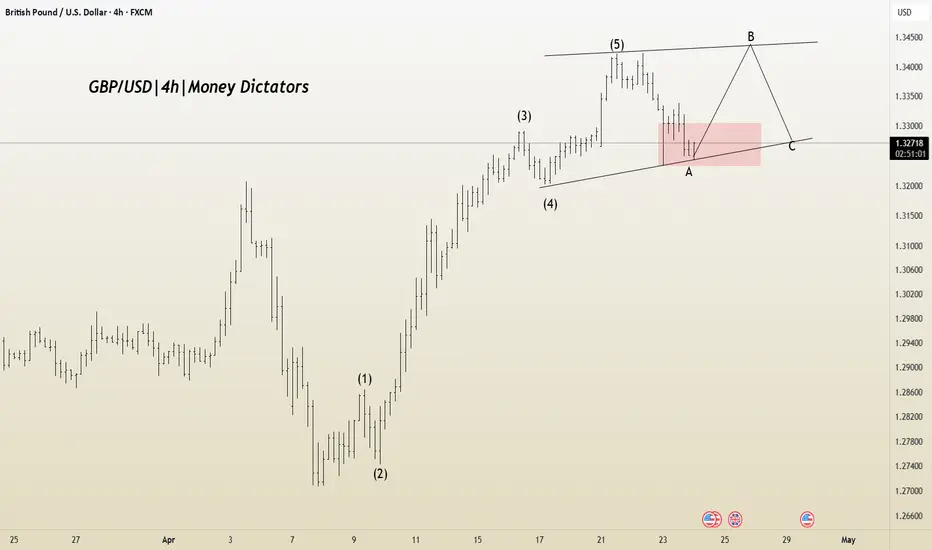
GBP/USD at a Turning Point – Correction Pattern in PlayIt appears that corrective Wave A in the GBP/USD pair is nearing completion, and Wave B may be forming. The Wave 1 to 5 structure seems to have been completed, indicating the beginning of an A-B-C corrective phase.
If the correction unfolds as expected, potential upside targets are 1.32918 and 1.33555. However, if the market faces rejection below the trendline, the stop-loss level would be 1.32021.

MACD says a little higher for a little longerAs per the individual stocks I cover that have not yet reached their ideal retracement areas I am looking for the SPX to get higher into my target box. In any event it's reasonable for me to say we're in a B wave and therefore our pattern can develop into something more complex. Nonetheless, I am mainly looking for MACD to reach the zero line at the very minimum.
The take-a-way from this update is I am looking slightly higher in the markets for slightly longer...before our minor C wave takes hold of the market.
Best to all.
Chris

SPY Green Light to All Time Highs?As VIX is sitting around 25, this is the first Monday in I can't remember how long we aren't gapping down at open! I'll take it! There is a ton on the calendar this week: jobs, first print for Q1 GDP, PCE, ISM mfg, and a ton of consequential earnings! Not to mention will we get a couple deals announced this week. Feels like India, UK and Japan are close. This could spur a market rally to continue! Did a ton of work on Elliott this weekend, but didn't create a video. Essentially, since we closed in the wave 1 of the red C leg (on daily and weekly basis), we have invalidated a chance of a fifth leg lower (thank God!). This means we are in first impulsive intermediate 5 wave that should go to all time highs (next Apr)! Since we already have two minute impulsive waves that were similar in size, we likely will finish the minor wave 3 as pictured and then since 1 & 3 of minor waves will be similar in size the impulsive 5 wave target will be as pictured as well. Remember it is simply the net of waves 1 through 3 times 0.618 and add that to the finish of wave 4 in either case. After wave 3, we will get a pullback, but this will be a buy the dip opportunity finishing the 5th wave around 580ish. After this we will get a deeper corrective wave but if sentiment is positive it may be shallow, only 38% to 50%, so will want to re-evaluate at that point! This is why it is important if you are investing not to FOMO, as there will be many opportunities to buy the dip!

PEPEUSDTBased on this analysis, wave E is complete and any retracement to around 0.0000078 is a buying opportunity.. and around 0.000017 to 0.000022 is the possible end zone of wave F..
Even if the price returns to the levels of 0.0000058 to 0.000005 once again, it will still be an ideal buying opportunity to buy spot.. And this is just a simple analysis and there is a possibility of error in it..

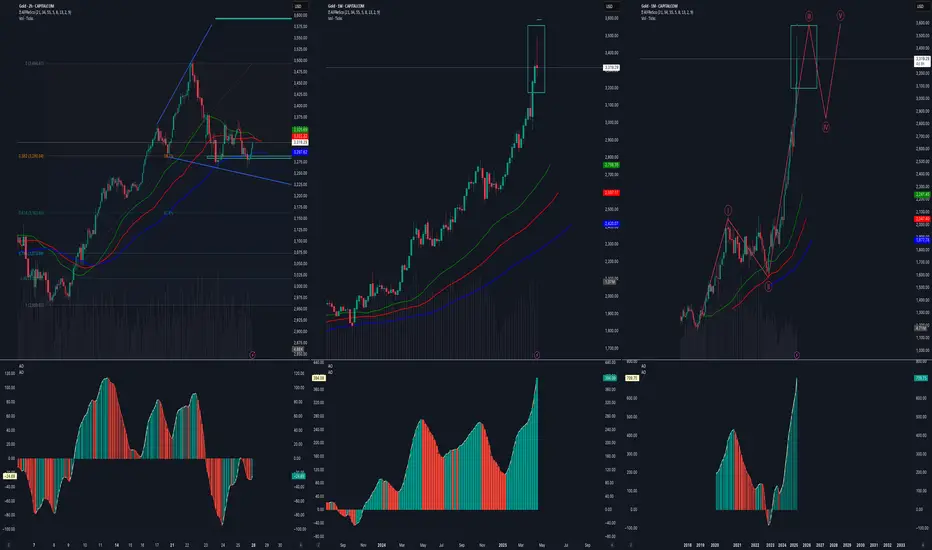
GOLD Analysis (April 26, 2025) - 2 hours, weekly & MonthlyChart 1: 2-Hour Chart (Short-Term View)
Pattern Observed:
Clear Elliott Wave structure identified.
Wave ①, ②, ③, and ④ are completed.
Currently in Wave ⑤ (ongoing impulsive up move).
Current Setup:
Wave ⑤ has started and appears to be very impulsive.
The target for Wave ⑤ is near $3600 zone.
Expect a sharp upside move toward $3600 in coming sessions (possibly within next 1–2 weeks).
Important Note:
Since Wave ⑤ is impulsive, price may move very fast with little retracements.
Strategy:
Short-term bullish until $3600 is reached.
After completing ⑤, expect a strong and sharp correction downward.
Chart 2: Weekly Chart (Medium-Term View)
Pattern Observed:
Weekly candle has formed a long-legged inverted hammer, almost like a high wave spinning top.
This is a warning sign indicating strong indecision and possible trend exhaustion.
Interpretation:
Weekly structure is signaling that GOLD is losing strength at higher levels.
There is hesitation for further continuation of the uptrend.
After a small last push (likely completing the final Wave ⑤), there are high chances of a bigger retracement.
Strategy:
Watch closely how next week’s candle forms.
If next week closes weakly or forms a bearish pattern (like bearish engulfing), expect bigger fall.
Chart 3: Monthly Chart (Long-Term View)
Pattern Observed:
Monthly chart shows momentum loss at top.
AO (Awesome Oscillator) indicator is flattening after a massive upmove.
Momentum divergence starting to appear (price made higher high, AO showing flattening/slightly diverging).
Interpretation:
GOLD is still strong, but momentum is clearly reducing at the top.
If GOLD touches $3600 next month and fails to sustain, a big red monthly candle can form.
This could mark the start of a medium-term bearish phase (several months correction).
Strategy:
Next month (May 2025) is extremely critical for GOLD’s major trend decision.
If a red candle forms in May after touching $3600, it could trigger a multi-month downward correction.
Conclusion:
In the short term (next few days), GOLD likely continues to rally towards $3600.
Next 2–3 weeks are critical — observe if reversal signs appear near $3600.
May 2025 is very important:
A monthly red candle after touching $3600 can confirm a bigger downward correction.
If correction starts, it will likely be sharp and deep, matching the intensity of the 5th wave up.
Disclaimer:
This analysis is for educational purposes only and not a financial advice. Trading involves risk. Please consult your financial advisor before making trading decisions.