SSIA idx stock :Example of Complex Correction Wave Here is the example of complex wave calculation based on elliott wave principle.
Overall complex correction wave consists of 5 combined wave (w)-(x)-(y)-(x)-(z).
These complex correction played out for very long period time thus can be very confusing. (w) wave is a zigzag of a-b-c, followed by triangle a-b-c-d-e (x), another zigzag a-b-c (y), followed by flat a-b-c (x) and last, completed with zigzag a-b-c (z).
This educational analysis provided also with example entry strategy, my entry strategy placed on top of last wave 4, why? Well, it gives slight confirmation that the (z) wave of zigzag is completed. The stop loss placed on the very bottom of (z), which means the invalidation zone. Apparently, this strategy only compatible for a long term investing.
This educational analysis is not a financial advice, you should do your own research and always make sure to criticize before consummation.
And last, because the asset is stock, always compare with the fundamental condition of the company.
Thank you, share and like if you found it helpful!
Elliotwavecount

NEO Longer term Elliot wave countHere i have depicted my longer term elliot wave count based on the structure we are seeing and the reaction off the lows. There is a count to say we are getting an impulse off the lows. Again this to me will only be as a result of a C wave and do see us putting in a final low before seeing the true bull run commence.

#DXY to #SP500 #SPYTVC:DXY
We are back to Chinese trade tensions with Chinese companies possibly to be delisted from the NASDAQ and Hong-Kong protests back on.
If we want to see a pullback on US indices, I am convinced this will depend on the USD. The demand and surge of it will mean pain for equities.
With that said, I can see 5 waves to the upside in micro degree to complete a corrective structure before lower lows.
Complicated to see this five wave rally breaking March highs given the count and also the undoubtable final stimulus package.

#AAPL updateNASDAQ:AAPL
This has the chance to play really well.
I see two scenarios.
One, this fails against the previous high and starts five waves to the downside.
Or two, makes a slight higher high, which is quite normal price action in FLAT types of correction, and from there five waves down.
Waiting on the NASDAQ to play this.

BTCUSD H1Price has put in a possible turnicated 5th leg in. Therefore, I expect more downside in price unless this is just a flat correction. Shorts will be invalidated if price breaks the high. Happy trading!

#SPY #SP500 UpdateAMEX:SPY
Correction well in progress.
In my opinion, this might turn out to be a more complex and deep correction.
That is because discussions of the next stimulus bill may not resume until June.

#ATVINASDAQ:ATVI
Great support area for minor 4 around $68-$67.
While bearish in the overall market in the short term, have to consider the fact videogames MUST be doing great in this time.
And so, projecting a short lived downside before the dip is bought.

Correction Wave 4 in play - XAUUSDElliot wave count adding further confluence to my previous ideas.
Expecting a bullish breakout from current consolidation.
Quarterly outlook:-
2nd: Bullish
3rd: Bearish
*Disclaimer*
This is not trading advice. All content/ information shared in this idea is purely educational in nature and is expected to be used for analysis and illustration purposes only.
Do not trade or speculate based solely on the information provided.
Trust you own analysis.
Beyond Edge

BTC Macro Corrective WaveMacro horizontal triangle correction. Long term position: short to Support @ 5800. Targeting June 2020
Then... well we all know the answer to this one. To the Moon!

#AAPL updateNASDAQ:AAPL
Looking impulsive now and looking to finish 5 waves up.
Closing the gap soon? There is plenty of fibonacci correlation around $310.

#NASDAQCURRENCYCOM:US100
The stock market will not go down till the NASDAQ says so.
Looking at an extending ending diagonal for wave 5 micro in blue.
Meaning submicro waves should be 1<3<5 giving a minimum final target of 9219.
As days go by, this upcoming pullback is less likely to break March lows.
I go by the book. Questions or concerns please go right ahead.

#PYPL #NASDAQNASDAQ:PYPL
"The stock market is not the economy" How true is that today?
Wouldn't be surprised this dip is bought. Possibly looking at a 4th wave correction before higher highs.
The gap at 118-117 with particular interest.
I go by the book. Questions or concerns go right ahead please.

W5T Roller Coaster picks up nice 100 tick move on ES in 30 minW5T Roller Coaster indicator picks up nice 100 plus tick move on the ES this morning in 30 min with 2 - 15 candles.

#SPY #SP500AMEX:SPY
Is the market sustainable on its own?
Be skeptical but learn to listen.
Specting a third relief bill mid month maybe, will that do it?
I go by the book. Questions or concerns go right ahead please.

#KO #SP500 NYSE:KO
Coca-Cola looking particularly weak unable to reach a 1:1 Fibonacci extension within its bear market rally.
Whether the corrective rally continues or not, I see low 40s coming in the short term.
Holding 42/40 put spreads expiring this week.
I go by the book. Questions or concerns go right ahead please.

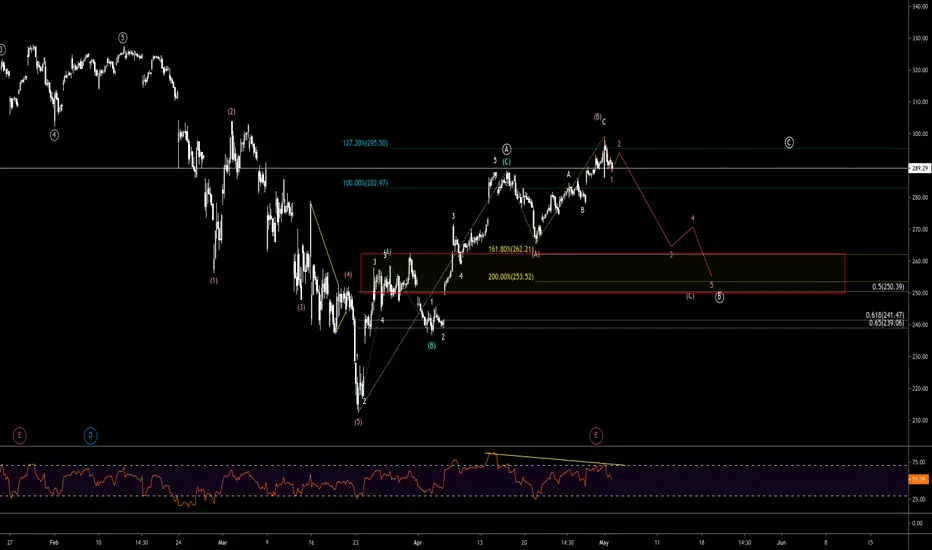
#AAPL #SP500 #NASDAQNASDAQ:AAPL
Doubt the corrective rally is over but leaning towards a red first week of May.
Fibonacci Extensions between 1 to 1.272 are all over this rally from March lows which scream "correction" for me personally.
Thinking of a FLAT corrective pattern for B minor to finish anywhere between 260-250 before a final rally to wave C minor.
I go by the book. Questions or concerns go ahead please.
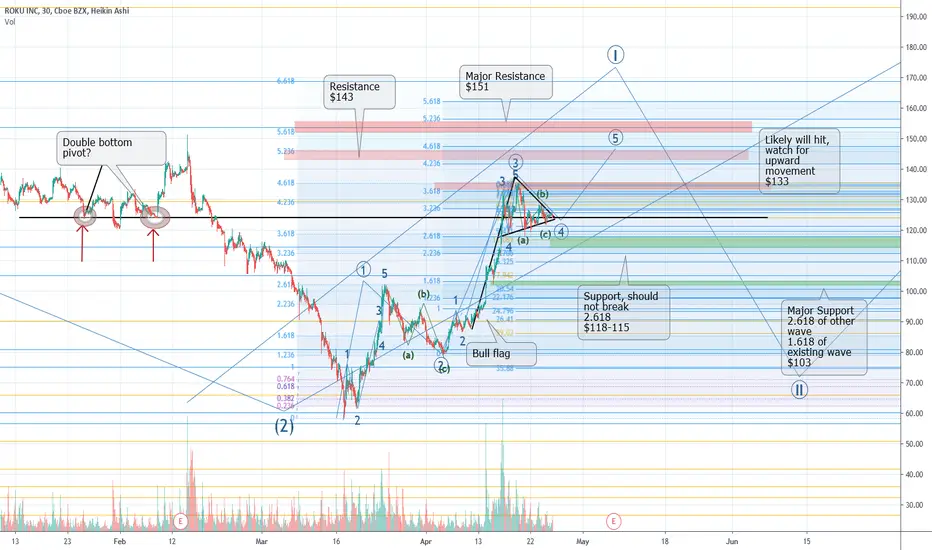
Roku Breakout?
Strong evidence based on ideas of Fibonacci and Elliot wave suggest that Roku is currently on a smaller scale wave 4 OF a large scale wave 1 .
Look at the bull flag formation. Consolidation at the double bottom pivot from Feburary. Roku may be able to make a strong breakout.
Major Support- $103-102
Support- should not break if bullish- $115-118
Likely- watch for upward movement $133
Resistance- $143
Major Resistance- $151
German BUND Approaching Resistance - Elliott wave analysisHi traders,
German BUND made a clear, five-wave drop in March, which is a sign of a bearish trend, however as we know after every five waves a temporary pullback may show up. Here we are observing a w-x-y correction underway, with resistance/bearish turn at the 174.80/176.8 region, where Fib. ratios of 0.618 and 0.786, and also equality measurement of waves w and y can suggest where price can slow down.
Once we see a five-wave minor rally within a (c) wave of y, and a sharp drop from potential resistance levels, and a breach below the lower channel line, that is when BUND can resume its bear run.
Trade well,
The EW-Forecast team


Litecoin Enters Elliott Wave Sell Zone LTCUSD's decline unfolded in five waves with an extended move in wave v.
Since the market bottomed around $25 price has been moving upward in a sideway manner, which is what to expect after an impulsive move according to Elliot Wave theory.
The correction seemed completed and unfolded as a double zigzag. Further confluence suggesting the end of the correction includes the rejection of 38.2 Fibonacci level, 50 EMA, S&R level, and retest of the broken ascending trendline.
Price has the potential to move lower from or near the current level and retest the wave (a) low and even extends lower.
The bearish wave count remains valid as long as the price stays below the red line, "47.69" level.
What's your thought on Litecoin?

S&P 500 Is Printing Bearish Elliot Wave PatternThe S&P 500 massive decline and the subsequent rally makes Elliot Wave sense.
The coronavirus 35% sell-off was a classic five-wave EW impulse pattern. According to the theory, this implies that at least a three-wave correction should be expected.
In SPX's case, the 28% rally that follows the decline is in three-wave so far and taking the shape of an a-b-c zigzag corrective pattern.
Not only that, but the price has also already retraced 50% of the decline and testing an important weekly resistance level.
I'm not interested in catching the top, so I will wait for price action to confirm this scenario. The breaks of the counter trend line and previous swing low at 2656 area will be a good confirmation that the bears are ready for the run.
Price has the potential to move below the previous low in the anticipated decline.
Do you think S&P 500 has already bottomed? Let me know your view in the comment.

Elliot Wave View: Bitcoin Sets a Stage for Further DeclineThe rally from $4000 low moved correctively and took the shape of Elliot Wave double zigzag pattern, labeled w-x-y.
According to the theory, once a correction is completed the price resumes in the direction of larger trend, which is bearish in the BTCUSD case.
Prices also break out of the rising wedge support decisively further signaling the completion of the correction.
Price has the potential to take previous low in the anticipated decline.
Do you think BTCUSD will retest $4000 again?

S&P million dollar chart In blue colour are all the daily gaps of the index. If it manages to close the one at 2899 and then A=C then it reaches the lowest gap which is between 0.382 and 0.50. Magic
