Don't Buy BITCOIN yet! You Can Get a Cheaper Price!Bitcoin has the potential to drop to $7400 - $7300 in Wave 2 correction that's anteceding the leading diagonal. Leading diagonal always point towards the direction of the major trends according to the EW principle.
Wave (iii) has the potential to travel 1.23x or 1.618x wave (i), which is within the range of $9000 - $9500 area.
Thanks for reading!
Veejahbee.
Elliotwavecount

GOLD Is Setting Up For Massive Rally - Don't Loose GuardGold is in Wave 5 of the major advance as I've already discussed in the higher timeframe post I published 3 days ago.
Kindly find the related idea links to read full articles.
It's setting up for wave iii of (iii) of 3, and this usually the wave that drives the price so rapidly according to Elliot Wave Principle.
So keep eyes on it! Don't lose guard!
Best of luck on the chart,
Veejahbee!

EW: USDCHF Should Start a Major Down Turn SoonUSDCHF seems to be making a double zigzag Elliot Wave corrective chart pattern.
The wave X of the double zigzag is currently retesting the upper trend channel that lined up with key psychological number 1.0000.
The price of USDCHF has the potential to turn lower as other negative correlated pairs like EURUSD, GOLD are heading higher.
What's your thought about USDCHF?
Kindly drop some comments.
Thanks for reading!
Veejahbee.


XAUUSD "GOLD" Sets to Resume Wave 5 RallyGold has been making an impulsive advance since August 2018.
According to Elliot Wave Theory, a five-wave move is known as an impulsive wave and sets the direction of the major trend.
Gold seems to have completed wave 4 corrective pattern, as the correction terminated at upper boundary channel that connects wave 1-2 extends to the high of wave 1. The level also lined up with 38.2 Fibonacci retracement of wave 3 advance.
Breaking down to lower timeframe:
The price made a five-wave impulse in wave (i) from the 1446.07 area, and subsequent corrective move is an a-b-c expanded flat pattern in wave (ii). The correction also terminated at critical support circa comprising of 61.8 Fibonacci retracement, 1.236 extension of wave a of flat, and wave c support trendline.
If this count is correct, Gold should resume higher from or near the current level, the breach of 1473.08 will confirm that wave (ii) has really bottomed. And if price trade below the invalidation level on the chart, I will need to review the analysis.
What's your thought about Gold? Kindly let me know in the comment.
Thanks,
Veejahbee.

AUDUSD Made A Double Bottom at a Critical Support ZonePrice is sitting at key support, which is in confluence with 61.8 Fibonacci retracement. Price has also made a double bottom formation at the key confluence zone. Price should resume higher from or near the current level. The breach of the confirmation level indicated on the chart will further confirm the bullish setup.
If the price moves above 0.6800 confirmation level, it would have broken the high of wave iv of an ending diagonal pattern and a descending trendline, which is a strong signal for trend resumption.
What's your thought on AUDUSD? Kindly let me know in the comment.
Thanks for reading!
Veejahbee.

Confluence Set Up AUDCAD for Potential RallyAUDCAD reversed from a daily ascending trendline that lined up with 61.8 Fibonacci retracement of the advance from 0.8903 and broken out of daily descending trendline.
Price also broke the daily counter trend line structure and it's currently retesting it inline with key support, and descending trendline.
Price has the potential to move higher from or near the current level and rally towards the resistance with 1.236 and 1.618 extensions as indicated on the chart.
This setup remains valid as long as the Invalidation Level at 0.8966 remains intact.
What're your thoughts about AUDCAD? Let's discuss this in the comment.
Good Luck!
Veejahbee

Elliot Wave: EURJPY Set Up for a Massive Advance The five-wave rally from 119.25 in wave (i) favors the idea wave 2 ended at 119.25, and wave 3 is underway.
It also set the stage for a three-wave correction, which is unfolding as a double zigzag pattern.
I anticipate that wave (ii) will find support circa at 119.560 area, comprising the 78.6 Fibonacci retracement of the advance from 119.25, a key support level, and retest of the weekly descending trendline.
The invalidation level has been indicated on the chart, and the breach of the green line will confirm the pullback has bottomed, and that may trigger upside acceleration for wave (iii) of 3.
Kindly let me know your thoughts in the comment.
Thanks for reading!
Veejahbee

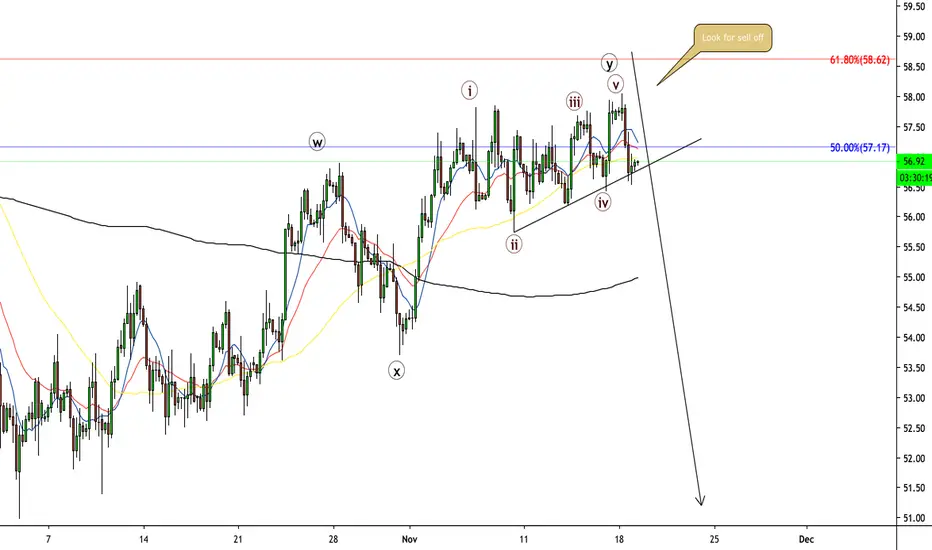
Gold Wave Analysis Potential Sell Set Up Wave YGold have been in a corrective structure since September of this year moving lower. I believe we are in a complex corrective structure and we are going to get another push lower in wave Y of the complex structure

EUR/USD Wave Analysis Buy Set UpI am looking for a buy set up, I believe we are in a impulsive wave with a completed 3 wave corrective flat structure.

Oil Wave Analysis Potential Sell Set UpI believe Oil is finish a "W-X-Y" corrective structure. It appear that wave Y could be completing a ending diagonal. I am looking for a reveral in price and a swift move to the downside
Gold Wave Analysis 3 Potential Trade Set UpsGold is setting up for some really good trading set ups. Depending on what type of trader you are, Trend following or counter trend, will determine which set up is suitable for your trading plan. The arrows give somewhat of a map of the movement that I am expecting to take place.


GBP/NZDI am looking at the choppy sideways movement in GBP/NZD as a corrective Triangle structure. This week I will be looking for price to break out impulsively pushing higher

Gold Wave Analysis Potential Trade Set UpWatch as I forecast Gold and identify potential trade set ups

US Dollar Wave Analysis Potential Trade Set upsWatch as I forecast potential trade set ups on the US Dollar


USDJPY (h4)intraday tradeplease to be inform we inviting you to join our premium channel telegram for free!!jois us now!!
t.me/rakangoldmalaysia

Can this Elliott Wave Setup Send USDJPY Go Downhill?The Daily chart of USDJPY reveals not only the recovery from 104.450, but also the preceding decline from 112.416. As visible, it is a five-wave leading diagonal pattern, labeled (i)-(ii)-(iii)-(iv)-(v) in wave 1. The five sub-waves of wave (i) can be recognized, as well.
Ending diagonals form in the position of the first wave (A Or 1) of the larger sequence, which means that the overall bias is bearish.
According to the Elliott Wave theory, a three-wave correction follows every impulse. This means the recovery to 109.296 by 30th October is hardly the start of a new uptrend. Instead, it is most likely a simple (a)-(b)-(c) zigzag correction within the larger downtrend from 112.416.
Note how the 61.8% Fibonacci level discouraged the bulls in wave (c), and the entire recovery formed a wedge pattern. Those are confluence that the entire 5-3 wave cycle is complete.
If this count is correct, we can expect the trend to resume in the direction of the impulsive sequence. Targets below wave 1 low (104.477) make sense for USDJPY in the weeks ahead.
Thanks for reading!

Triangle Breakout on Silver Set a Stage for a Bullish Reversal Just as in the case of Gold (XAUSUD) analysis published previously; Silver (XAGUSD) seems to have formed a contracting triangle corrective pattern in wave 4 as indicated by the wave structure of the sideways price action in September and October and by the converging trendlines that connected the extremes of waves (a), (b), (c), (d) and (e).
What is most interesting is that Elliot Wave alternation guidelines were followed correctly. Wave 2 unfolded as a zigzag and retraced 78.6% of wave 1, while wave 4 unfolded as a triangle and retraced 50% of wave 3.
According to Elliot Wave Theory, triangle always precedes the final move of a sequence. And once a correction is completed, the price resumes in the direction of the major trend, which is bullish in this case.
The triangle correction has set up a potential Wave 5 rally in Silver, and the projected target is 61.8 Fibonacci extension (blue area) on the chart.
Price has broken the extreme of wave (d) of the triangle, so the pattern has been confirmed, and traders should be looking for buy opportunity in subsequent HL on the lower timeframe.
Thanks for reading!
Veejahbee.

Triangle Pattern Set up XAUUSD (GOLD) For a Potential RallyGold (XAUSUD) seems to have completed a contracting triangle corrective pattern in wave (4) as indicated by the wave structure of the sideways price action in September and October and by the converging trendlines that connected the extremes of waves (a), (b), (c), (d) and (e).
According to Elliot Wave Theory, once a correction is completed, the price resumes in the direction of the major trend, which is bullish in this case.
So a potential rally is highly probable in Gold in the weeks ahead, and the projected target is 61.8 Fibonacci extension (blue area) on the chart.
TIP: The best entry guideline for Triangle is to wait for the price to break the extreme of wave (d) of the pattern and then placing the protective stop at the extreme of wave (e).
Best of luck on the chart!
Veejahbee.


