XAG/USD Long 15.33976 Target: 15.75860 Hi Guys, XAG/USD (Silver) Looking For Buy Setup at the break of 15.33976 Target: 15.75860
Elliotwavecount

GBP/USD Long Setup 1.26164 Target: 1.28369Hi Guys, GBP/USD Looking For Buy setup at 1.26164 Target: 1.28369 ( pattern completion )

EUR/AUD looking for Buy/Long PositionsHi Guys, EUR/AUD Correction could be completed ( 4th wave or X as it's very similar to the last correction as well )
for another up move ( 5th or Z ) Looking for buy setups back towards current down trendline

XLM/USD Correction finished? 0.13179393 vs 0.10563678Hi Guys, XLM/USD has made a large
correcting move sideways waiting to see if it has completed
and give us a nice buy/long setup ( impulse flag )
to head back up ( 0.13179393 vs 0.10563678 )

BSV/USD Correction Completed? 181.020 vs 245.000 Hi Guys, BSV/USD Rejected 181.020 another time Looking for buy flag/setup and see if we can break 245.000 to continue the upside momentum.

NEO/USD Correcting 20.35 vs 17.05Hi Guys, NEO/USD Expecting a larger corrective pattern (slow sideways movement) to develop before we can start looking for buys again.

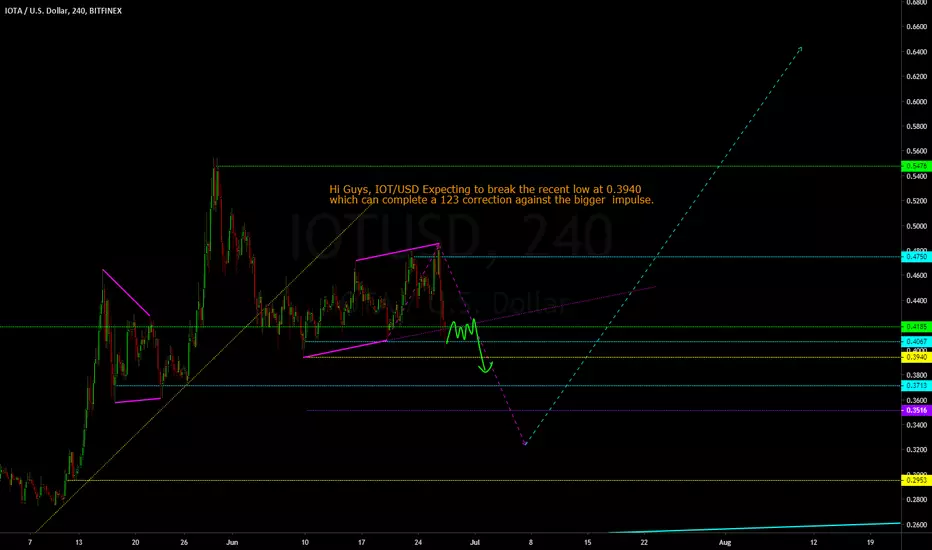
IOT/USD expecting continuation for the down move Hi Guys, IOT/USD Expecting to break the recent low at 0.3940
which can complete a 123 correction against the bigger impulse.
GBP/USD looking for Short Term SellHi Guys, GBP/USD Correcting after its 1st wave down against the last impulse that broke our bigger downtrend if we can break there's a short term trade to the downside which can complete the corrective pattern for the upside

ETH/EUR Due for bigger correctionHi Guys, ETH/EUR Broke out after it completed its 5th wave up in the last impulse,
I expect we are due for a bigger correction before we can continue the upside, looking to revisit the bigger trendline first

US Dollar(DXY) Sell Set Up Wave AnalysisThis week I will be looking for shorts in the US Dollar, A potential 3rd Wave to the downside. Wait for price to give us confirmation

Soybean Futures Buy Set Up Wave AnalysisLook for a Bullish wave to the upside, in either a wave 5 or wave c

EUR/CHF Potential Sell Set Up Wave AnalysisLook for a break in trend line to give us more confluence of a bearish wave trend continuation

EUR/AUD Potential Long Term Sell Set Up Wave AnalysisWe could be near the end of a corrective structure that started in 2012, Look for signs of a sell off.

EURAUD - A TUG OF WAR BETWEEN BULLS & BEARS CONTINUEThe EURAUD weekly chart above reveals that the rally from February 2017 low to as high as 1.61957 in March 2018 took the shape of a textbook Elliot Wave leading diagonal structure. The pattern is labeled (i)-(ii)-(iii)-(iv)-(v); wave (iv) overlap wave (i) high which make the whole advance an Elliot wave motive diagonal rather than an impulse.
The Big Picture Still Remains in Favour of the Bulls
According to the theory, the motive waves “leading diagonal in this case” point in the direction of the larger sequence, and a three-wave retracement in the opposite direction follows every motive pattern.
Here, EURAUD correction seems to be unfolding as a "top flat ascending triangle" pattern labeled (a)-(b)-(c)-(d)-(e). Price has drawn wave (a)-(d) of the triangle and remain wave (e). So, in the short term, the price has the potential to move lower to complete the wave (e) of B.
However, once the corrective phase of the cycle is over, the larger trend resumes in the direction of the motive wave. This means that once the corresponding triangle correction in wave B is over, another rally in wave C can be expected.
The resistance area around 61.8% Fibonacci level of the monthly impulse structure “Not show on the chart” is plausible for the bulls.
Bottom Line
If this count is correct, traders should expect a short term decline and long term advance in EURAUD as planned on the chart.
Did you like this analysis? Let me know your thoughts in the comment.

Crude Oil Sell Set Up Wave Analysis Complex CorrectionLook for the sell set up to finish the complex W-X-Y corrective structure.

Bitcoin Wave Analysis Bullish Wave To Create Higher HighsBitcoin formed a big corrective structure all of 2018 and I believe it have ended. Price have began to rise quite impulsively from the $3,270 low of December 2018. Price is approaching a strong resistance/supply area around the $10,000 level wgere I believe we will encounter some weakness which will give people a chance to buy the pullback. In conclusion I do believe Bitcoin will keep gaining strength throughout the year eventually creating new highs.

Crude Oil WaveAnalysis Buy Set UpI believe the bearish corrective structure is near the end and the Bullish wave have started. Look for a small corrective structure to ride the wave up to retest the highs and create new highs.

USD/JPY Sell Set Up Wave AnalysisLook for price to break out of the corrective structure to head lower in the bearish trend towards the support level of 108.490

Elliot Wave Count on ETH/USD - 5th wave upBased on my Elliot Wave count we will finish the 5th wave above the strong ~200 USD resistance. After buying volume drops you can expect a retest of the resistance, this time as a support. Therefore, you can time your short and enter accordingly.
S

LTCUSD EW Count with Pitchfork & Orderblocks
LTC has been leading the market with small and shallow retracements since Jan 2019. What is that screaming? A wave 3 push.
Forecast:
Short Term: waiting for a retracement and complex wave 4 correction before pushing higher. Long Term, the completion of wave 5 which should take us to the 0.5 fib level (around 160) of the Y move before starting the Z of a WXYXZ (confirmation after breaking Dec 2018 lows) or push higher to break ATH.
Trade Status:
Neutral until support by the weekly order block is held and high is broken along with Pitchfork warning line.

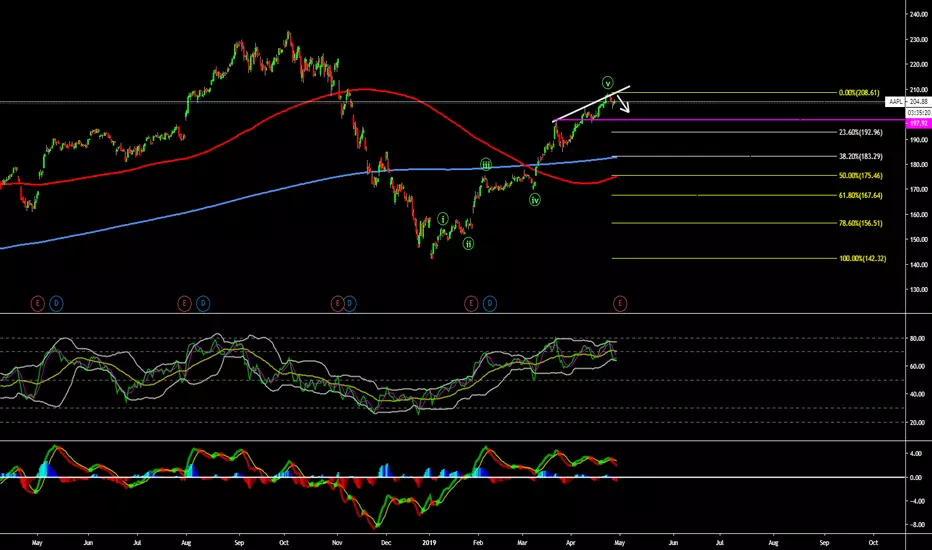
AAPLEnding diagonal. Looking for shorts to at least the 200.00 level should it turn into a running flat. Keep in mind a 5 wave can retrace 50-62%.
EURAUD - POTENTIAL 1000 PIPS BULLISH TRADE SETUP Hi Traders,
The EURAUD daily chart shows that the sharp bullish run from 1.53505 low in December 2018 can be seen as a five-wave impulse in wave (A), labeled 1-2-3-4-5.
.
The Elliot wave theory states that a three-wave correction in the opposite direction follows every impulse. In EURAUD's case, wave (B) looks like a W-X-Y double zigzag/double three retracement.
.
The correction in wave (B) retraced 61.8 - 78.6% of the impulsive move in wave (A). If this count is correct, a 5-3 wave cycle is completed, and the trend can be expected to resume in the direction of the impulsive sequence.
.
Target above 1.65547 "wave (A) high" make sense in the mid-term, unless the price drops to a new low below 1.56911 "current wave (B) low."
.
Did you like this Elliot Wave Analysis? Kindly let me know in the comment.
.
Thanks for reading!
Veejahbee.

AUDUSD is Approaching a Dangerous Area for the BearsHi Traders,
The daily chart of AUDUSD allows us to put the decline from 2018 high at 0.81340 into an Elliott Wave perspective. As can be seen, the market is drawing a textbook five-wave impulse, labeled 1-2-3-4-5. Wave 1-4 is completed, and we are currently in wave 5. The sub-waves of wave 3 are clearly visible, as well.
.
In addition, the market took the guideline of alternation into account. Wave 2 is a simple a-b-c zigzag, while wave 4 is a triangle correction. If this count is correct, AUDUSD is now in the last phase – wave 5 – of this impulsive decline.
.
Once the wave Wave 5 is over, which will most likely be terminated within the gray area on the chart, a sharp bullish reversal can be expected.
The anticipated recovery has the potential to lift AUDUSD price to the resistance area of wave 4 near 0.74006 if it's a corrective wave. In other words, a 100% rally seems to be around the corner if it's unfolded as an impulse wave.
.
Till then, we will be shorting AUDUSD in the shorter cycle.
Thanks for reading!
Veejahbee.
