DOGE FIBDogecoin cannot sustain the daily close above .36 so next level on the fib is .32 which is a crucial point of support. Still floating under the trendline on the RSI. MACD starting to trend under which means potential bearish signals. Keeping eye on this, and waiting to see what happens with community and team.
ELON

$DOGEHello Shibs, hope you still HODL Dogecoin. Thi the accumulation part, market correcting itself for another run. Bitcoin also down today, keep that in mind. A crucial support level I’m looking at is .35 to close above in the daily. If that breaks buckle up, and HODL.
Dogecoin was recently attacked, and hacked. “Exploited a vulnerability called “DogeReaper” crashing 69% of nodes. A fix was quickly deployed, and network’s functionality was not severely impacted.” Which makes me to believe a lot of people are panic selling. How could you sell DOGE? It’s literally the Department of Goverment Effeciency!!
Anyways, don’t panic sell. DOGE TO DA MOON!

TESLA 206 - 216 - 230 TP
Why Tesla is Poised for a Bull Run
Tesla Inc., the leading electric vehicle (EV) manufacturer, has shown remarkable resilience and growth potential, making it a strong candidate for a bull run. Here are some key reasons:
1. Strong Financial Performance
Tesla’s financial performance has been impressive. The company’s revenue reached $81.5 billion in 20221, and its stock price has seen a 5-year total return of 795.71%, placing it in the top 10% of its industry2. Despite a decrease in net income in Q3 20233, Tesla’s overall financial health remains strong.
2. Market Leadership
Tesla continues to lead the EV market. It was the most valuable automotive brand worldwide as of June 20231 and led the battery-electric vehicle market in sales1. Despite increased competition, Tesla’s market share in the U.S. and Canada is growing, heading towards 3%, while in Europe and China, 2% is within range4.
3. Production and Delivery Growth
Tesla’s vehicle deliveries reached a record 1.31 million units in 20221, showing a steady year-over-year growth. The company’s long-term target is to increase electric car sales by an average of 50% year-over-year4.
4. Expansion Plans
Tesla is expanding its manufacturing capacity with new factories in Germany and Texas5. These new facilities will help meet the growing demand for Tesla’s vehicles, potentially driving further growth.
5. Innovative Product Line
Tesla is not resting on its laurels. The company plans to launch new models, including the Cybertruck, Semi, and Roadster6. The introduction of these new vehicles could attract new customers and boost sales.
6. Charging Infrastructure
Tesla’s plans for the world’s largest Supercharger station in California7 indicate the company’s commitment to developing a robust charging infrastructure. This will not only benefit current Tesla owners but also make EVs more appealing to potential buyers.
7. Strategic Market Moves
Tesla is making strategic moves to capture more market share, such as lowering the price of its cars in China and emphasizing online sales8. These strategies could significantly impact future earnings.
In conclusion, Tesla’s strong financial performance, market leadership, production growth, expansion plans, innovative product line, development of charging infrastructure, and strategic market moves position it well for a bull run

Tesla 205 After earnings !!!after earnings Tesla going back to 205 . !! TP wait for a possible 220 or Pull back to 193
Keep it simple
Be Patient
Believe in your Strategy
DO NOT OVER TRADE OR OVER LEVERAGE !!!


Dogelon Mars (ELON)Dogelon Mars is another dog-themed meme coin on Ethereum and Polygon that followed other successful dog coins like Dogecoin, Shiba Inu, and Floki Inu. Anyway, Elon's chart is simple, a sharp upward wave started after Elon broke the triangle pattern in which it was oscillating. Then, the correction phase started which unfolded in a big inverted wedge pattern. Now it seems Elon started an upward wave to break this inverted wedge upward. Let's see what happens.

TESLA 160 IF EARNINGS ARE POSITIVE !!Tesla doing good so far , waiting for Earnings to Tesla Rally to 160 TP 1 180 TP 2 250 TP and wait for a BIG SELL according to Wall Street Experts !!!
happy Trading !!
Stay Profitable !!!

DOGE - SHORT TERM $0.75 or $0.38 - CryptoManiac101DOGE / USD
Doge is currently in the upward accumulation pattern and even on a shorter time frame we see that it is nearing a possible breakout point within the coming hours, and it is in the position where it will either break it or make our December.
Short Term Targets Upon Upward Breakout
3 Days - $0.52
7 Days - $0.75
3 Weeks - $1.12
Let's see what happens
This is solely for entertainment purposes only and is not financial advice.

$1 TRILLION penny stock moves No, this is not a penny stock, bitcoin or some 💩coin, it's just 1 Trillion dollar company trading like one

DON'T SLEEP ON TESLA ON A... WELL, NEVER SLEEP AGAIN. TSLA 420.
ALRIGHT, LET'S TRY THIS AGAIN.
Tesla has a cool trend setup, retracement setup and indicator alignment into earnings.
A REALLY STEEP DROP from earnings, past 134 and all the way down to around 96, could trigger a nice move to the upside that you won't want to miss.
I know, TSLA to 74 or 30 or 10 (it's garbage).
Well, no, I disagree. At least in the short term. After it runs up again, I could easily see it back down to some low numbers.
But right now, heading into earnings, a big move is showing that looks very similar to what I've shown.
My line, expect it to be inaccurate, instead focus on the price targets.
At 175.01 = full bull to the moon 238k miles, maybe overshoots that.
There will be retracements, but if this move is based around btc, it could be FAST.
So, probably best to never sleep again, and watch the tsla chart 24/7.
RSI technically bearish, but they all look like they are about to flip, BUT they haven't yet, so we can't assume. We have to keep the projection based on charts, which says, if 134 holds and we get over 175 with stability, then green light, probably.
If earnings crashes price to under $100 for a brief amount of time, you probably want to yolo the dip. Calls would be very cheap at that point, and if you're bullish in any way, even if it's not to my numbers bullish, then it's still probably free money.
I won't be upset should you disagree, feel free.
And I look forward to your rubbing of profits in my face, should you be correct.
Truthfully, I'd like to see everyone make a ton, no matter what your opinion is (bear/bull).
LOTS OF MOVEMENT to trade in two directions.
Things don't go up forever, things don't go down forever, and if they do, it would be an outlier to most market movements.
Good luck!!
SOME FUNDAMENTAL RESEARCH:
1. **Tesla Fundamentals**:
- Tesla, the electric vehicle (EV) company founded by Elon Musk, has seen remarkable growth in recent years. Their fundamentals include strong demand for EVs, innovative technology, and a charismatic CEO who captures public attention.
- However, Tesla's financials have been volatile due to high R&D costs, production challenges, and regulatory hurdles. Despite this, their stock price has surged, making them one of the most valuable automakers globally.
2. **Bitcoin and Dogecoin Investments**:
- Tesla made headlines when it disclosed a $1.5 billion investment in Bitcoin. This move signaled institutional interest in cryptocurrencies.
- Elon Musk's tweets and actions have influenced crypto markets. Tesla's investment in Bitcoin adds legitimacy to the asset class.
- As for Dogecoin, Tesla has not officially invested in it. However, Musk's tweets and memes have boosted Dogecoin's popularity. It's important to note that Dogecoin is highly speculative and lacks fundamental value¹.
3. **Software Subscription vs. Hardware Sales**:
- Morgan Stanley believes Tesla could make more money from software subscriptions than hardware sales. Tesla's vehicles are equipped with advanced software features (Autopilot, Full Self-Driving) that can be unlocked via subscription.
- By offering software upgrades, Tesla can generate recurring revenue. This model aligns with the trend toward software-defined vehicles².
4. **Data Collection and Auto Driving**:
- Tesla collects vast amounts of data from its vehicles, especially those equipped with Autopilot. This data helps improve autonomous driving algorithms.
- Tesla's fleet provides real-world data for training AI models, giving them a competitive edge in self-driving technology.
- Monetizing this data could be lucrative. Tesla could license it to other companies or use it for targeted advertising.
5. **Leasing Software vs. Selling Cars**:
- Leasing software (e.g., Full Self-Driving subscription) allows Tesla to generate ongoing revenue without selling additional hardware.
- Traditional automakers rely on upfront car sales, which can lead to debt if demand fluctuates.
- Tesla's approach disrupts the industry by emphasizing software and services over traditional car sales.
In summary, Tesla's fundamentals, crypto investments, software subscriptions, data collection, and unique business model contribute to its success and potential for future growth. However, risks remain, and the EV landscape is evolving rapidly. Other automakers are also adapting to these changes, but Tesla's early lead gives it a competitive advantage¹². 🚗💡📈
Source: Conversation with Bing, 4/22/2024
(1) Tesla, Dogecoin & Institutional Interest: A Data Perspective by .... coinmarketcap.com
(2) Tesla (TSLA) could make more money from software subscription than .... electrek.co
(3) Dogecoin | Tesla Support. www.tesla.com

DOGE - MANY WILL CALL THIS BEARISH - CryptoManiac101DOGE / USD TA
Many will call this a bear flag and automatically short, at which point I will wish you all luck and success. Short it to the bottom.
In my view with all the whales buying in the last 48 hours, this thing is going to $0.75 - $1.25 in December and there's really not much you can do about it.
We should have a move coming from DOGE any day now. Keep in mind that a tweet from Must in one way or another is coming soon, whether he integrates DOGE for Tesla purchase or announces something, that will likely highlight a top for us which will usually get hit within 3-7 days of his bullish statement and will mark either a local top or a season top for us, depending on when exactly we get the news release.
This is for entertainment purposes only and is not financial advice.


Shrub (SHRUB): The Adorable Hedgehog Turned Crypto StarIn a world where memecoins capture the hearts and wallets of crypto enthusiasts, Shrub ($SHRUB) stands out—not just as a quirky token but as a symbol of resilience and charm. Inspired by Elon Musk’s latest family pet, Shrub the Hedgehog, this cryptocurrency is turning heads and making waves in the market. Let's explore the fundamental and technical aspects driving SHRUB’s potential.
Why SHRUB Matters
Shrub’s appeal goes beyond its spiky mascot. This memecoin combines the lighthearted nature of internet culture with the innovation of decentralized finance. With ties to the Musk family, it carries the hallmark of media attention and investor curiosity.
Key Highlights
- Celebrity Connection: Shrub’s link to Musk's family adds credibility and visibility, making it a magnet for retail investors.
- Community Spirit: Beyond the meme, SHRUB represents resilience—mirroring the tenacity of the crypto community itself.
- Growing Accessibility: SHRUB is available on major exchanges like Uniswap V2, Uniswap V3, and Gate.io, ensuring wide accessibility.
Market Data Snapshot:
- Daily Trading Volume: $6.60 million (+18% in the last 24 hours)
- Current Market Cap: $24.82M million, ranking #630 on CoinMarketCap
- Circulating Supply: 942.18 million tokens (FDV: $26.33 million)
- 24-Hour Price Increase: Up 2.4%
Technical Analysis:
Currently trading 75% below its all-time high of $0.2581 (recorded Nov 14, 2024), $SHRUB shows signs of potential recovery.
$SHRUB’s chart indicates a symmetrical triangle, suggesting a significant breakout is on the horizon. The direction—bullish or bearish—depends largely on Bitcoin’s next move.
With an RSI at 50, $SHRUB is at a crucial pivot point. If it holds its current block structure (BS), it could avoid a bearish break of structure (BOS). Strong support lies near the current levels. If the broader altcoin rally continues, $SHRUB could challenge its all-time high, potentially entering a new bullish phase.
Outlook for SHRUB: What’s Next?
The memecoin market thrives on momentum and community engagement. With altcoins already outperforming, the next surge could spotlight tokens like $SHRUB. Its celebrity endorsement, combined with solid technical support, makes it a contender in the next meme rally.
Key Catalysts:
- Media Attention: Any endorsement or mention by the Musk family could trigger a sharp rally.
- Altseason Momentum: As the broader market heats up, smaller tokens often follow, and $SHRUB is well-positioned to capitalize.
Conclusion:
Shrub ($SHRUB) isn't just another meme; it’s a symbol of charm, resilience, and community spirit. With technical indicators hinting at an impending breakout and fundamental factors driving interest, SHRUB could be poised for significant gains. Keep an eye on this spiky contender—it might just surprise the market!.

DOGE - OH, IT WILL BE GLORIOUS - CryptoManiac101DOGE / USD TA
This is a Quick Look at a new pattern Doge is exhibiting on the daily timeframe, forming an ascending triangular pattern which statistically is a highly bullish pattern for crypto markets.
Upon breakout from this ascending triangle, we would be looking at a max conservative target of around $1.00 - $1.27 in December. Keep your eyes open.
This is not a financial advice, and is solely for entertainment purposes.

BITCOIN about to do things!Possible cup and handle breakout coming. Need volume. Neckline is either here or at 97k. We are breaking through the 1hr triangle at this point though. Already have broken the golden area. 103k target if momentum continues. Posting chart just so I can look back at this and see how this plays out.

DOGE - ROAD TO $1 IN DECEMBER - CryptoManiac101Dogecoin (DOGE) vs USD
1. Trend:
Dogecoin appears to be in a strong upward trend with a series of higher highs and higher lows.
Two distinct consolidation patterns (flag/pennant-like structures) are highlighted with yellow arrows, followed by strong upward breakouts.
2. Patterns:
The first consolidation occurs after an initial rally, forming a bullish flag. The breakout from this flag leads to a significant price increase.
The second consolidation is a continuation of the bullish pattern, again resulting in another breakout to the upside.
3. Price Action:
Each breakout has been followed by steep price increases, signaling strong bullish momentum.
The recent steep move at the top of the chart suggests an acceleration in buying pressure, possibly driven by market sentiment or external events.
4. Key Levels:
Support: The lower trendlines of the consolidation patterns act as short-term support levels.
Resistance: The upper boundaries of the consolidation channels act as resistance prior to the breakout.
Conclusion:
The chart displays a textbook bullish continuation pattern with steep uptrends and consolidations. If the trend holds, there could be further upside to $1
And as always, remember that this is not financial advice and is simply for entertainment purposes.

Inverse head and shoulders patterb on TeslaI noticed the previous chart I posted for tesla I accidentally had logarithmic mode turned on so. Wanted to show the more realistic linear chart breakout target here. *not financial advice*

XRP - HYPER BULLISH CASE - CryptoManiac101In this updated chart, the projection highlights an exponential growth curve, modeling a highly optimistic hyper bullish case scenario for XRP. Let's begin?
This projection suggests XRP could embark on a parabolic growth phase, potentially driven by significant catalysts such as regulatory clarity, market adoption and speculative demand.
Bullish Case Extension:
$3.50-$5.00: Earlier projections align with this level being the first target (previous all-time high and beyond).
The chart and fractal suggests that XRP could go beyond $10.00-$25.00 in the mid to long term, potentially driven by mass adoption, speculation, and favorable macroeconomic conditions.
The extended projection indicates that you see on the chart of $50.00-$100.00 could be a theoretical long-term ceiling under extreme bullish conditions, possibly dependent on XRP capturing a significant share of global cross-border payments or/and institutional investment.
Exponential Growth Possibility:
This kind of growth typically occurs during parabolic blow-off tops, similar to what Bitcoin and other altcoins have experienced in previous hyper cycles.
Updated Bullish Case Targets
Timeframe | Projected Price Range | Catalysts
Short-Term | $1.20 - $3.50 | Breakout momentum, key technical resistance
Mid-Term | $5.00 - $25.00 | Adoption growth, institutional involvement
Long-Term | $50.00 - $100.00 | XRP as a global cross-border payment system
Broader bearish trends in the cryptocurrency market could slow or reverse growth and these targets.
Remember that this is not financial advise and is intended for entertainment purposes only.

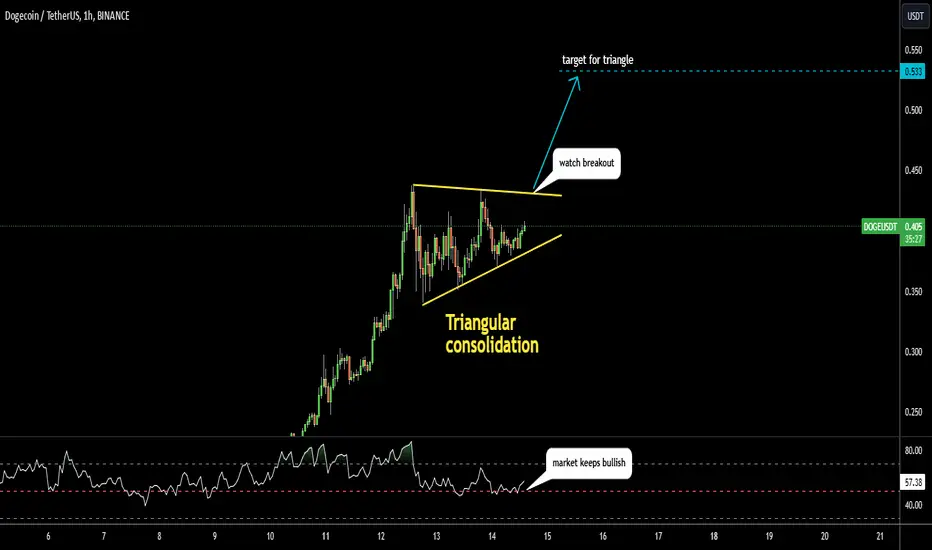
DOGE/USDt: Famous Pattern Indicates Continuation To The Upside Falling peaks and rising valleys have built famous Triangle pattern
on the hourly chart of DOGE/USDt.
It's a consolidation after a big rally, which means more upside move is ahead.
Watch the price to break out of the pattern.
The target is located at the widest part of Triangle added to the break point.
Its located at 0.533
Breakdown of Triangle would invalidate the pattern.
RSI has managed to keep above the neutral point during this consolidation.
This supports the idea of further move to the upside
THE BULLS OF BITCOIN [TRUMP+ELON] We're coming out of our corrective pattern with the chance to break into a new ATH once break our ascending triangle. This pattern is often bullish but with CME futures gap in play we can still see another correction before we're off to the 2nd phase of our pattern. Keep an eye on the altcoins and notice the money flow cycle. > > as we make our correction or we see a continuation with our ELLIOT WAVE THEORY . As we enter Q4 we can see people selling for losses or taking profits as we continue to crash upwards into 2025 with interest rates projected to fall in Dec.
Buy. Hold. Realize your profits once your PT's are hit.
With Trump taking office along with Department of Government Efficiency
The digital gold rush begins now.

DOGE to a DOLLARElon Musk's preferred cryptocurrency!
Let’s not forget, he is the wealthiest person in the world.
This coin is definitely a favourite of his.
Reaching new highs is absolutely within the realm of possibility.
I have a positive outlook on TSLA stock, with potential targets exceeding $900, which could bring Elon’s net worth close to a trillion dollars on paper. While the timing is uncertain, the potential for growth when investing in him is significant.
I also believe that his top cryptocurrency could very well hit a dollar during this cycle.
With the recent breakout candle, it seems we've witnessed the completion of a pattern and the breakout of a substantial cup and handle formation.
I've included the targets for your reference.

TSLA Robotaxi “one for the history books” - Elon MuskIf you haven`t bought the dip on TSLA:
Now you need to know that Tesla’s Robotaxi unveiling is generating excitement with its “We, Robot” tagline, a clear signal that the automaker is about to unveil something groundbreaking, potentially bigger than what was imagined in the sci-fi classic I, Robot.
Tesla began sent exclusive invitations to retail investors, influencers, and owners, fueling anticipation around its latest innovation—the Cybercab. Drawing from the attention-grabbing design of the Cybertruck, the Cybercab could mark a significant leap forward in autonomous transportation.
Elon Musk called the event “one for the history books” in a post on X, further boosting speculation about what this could mean for Tesla's future. With heightened interest in the Warner Bros. Studio event in Burbank, California, the buzz surrounding Tesla’s Robotaxi unveiling could signal strong momentum for TSLA stock, as investors anticipate the potential long-term impact of this revolutionary technology.

Bitcoin will hit 100 000 usd in 30 days with or without you🔸So I'm tired of all the bearish BTC charts popping up on
page one and getting 500+ likes doesn't make any sense to me.
My target is 100 000 USD in 30 days or less, so in December we will hit it.
🔸Previously recommended buying low at/near 60 000 usd. trade made money.
🔸We just broke out of major trading range established since March.
This is SUPER bullish. Make no mistake about it. Also DJT won the Elections
this is another massive bullish catalyst. What else do you need?
🔸If you can't make money trading crypto next 30 days probably means
that trading is not for you, look for other opportunities. Harsh reality
and wake up call. If in 30 days or less you can't make 30% unleveraged
gain, it's time to look for other options somewhere else.
🔸Recommended strategy bulls: there will be a pullback. you got two
options. either market buy now and hold for 100 000 USD. or option2
is wait for a shallow pullback and BUY/HOLD from the BUY ZONE on
my price chart. so near 74/75K is the best reload for the BULLS.
good luck, traders!
🎁Please hit the like button and
🎁Leave a comment to support our team!
RISK DISCLAIMER:
Trading Futures , Forex, CFDs and Stocks involves a risk of loss.
Please consider carefully if such trading is appropriate for you.
Past performance is not indicative of future results.
Always limit your leverage and use tight stop loss.
