Tesla Stock Plummet On China's Production CutTesla ( NASDAQ:TSLA ) has reduced production at its Shanghai factory amid slowing EV demand in the world's largest auto market. The move to cut production in China also comes as the global EV giant is heading towards a likely first-quarter delivery miss and has announced vehicle prices will begin to increase.
Tesla ( NASDAQ:TSLA ) is reducing production at the China plant to five days a week. The output cuts started earlier in March and could continue through April, Bloomberg reported Friday.
The action comes amid slowing EV growth in China and with Tesla's Shanghai facility already not producing at full capacity. Tesla ( NASDAQ:TSLA ) observers have repeatedly said in recent weeks that global inventory appears high.
This week, local media reported Tesla ( NASDAQ:TSLA ) will slightly raise China list prices on Model Y vehicles starting on April 1, following similar plans in the U.S. and Europe. Tesla ( NASDAQ:TSLA ) is also offering discounts between $1,000-$1,500 in China on inventory Model Y vehicles. Inventory discounts are more significant in the U.S. and Europe.
First-Quarter Deliveries Below Expectations
The global EV company ended 2023 on a high in China. However, the EV dynamic in China has changed early in 2024. Tesla Chief Executive Elon Musk has also said China's EV companies are Tesla's main competition — with BYD (BYDDF), Nio (NIO), Li Auto (LI) and others all making inroads in the EV market.
Tesla China delivered 60,365 in February, down around 19% compared to last year, according to the China Passenger Car Association (CPCA). Chinese New Year ran for two weeks in February, from Feb. 10-Feb. 24. Tesla deliveries of China-made vehicles in January and February totaled 131,812, down 6% compared to 2023.
Cutting Shanghai production would be further confirmation of weakening demand not only in China, but in Europe and other key markets. Shanghai exports to Europe have waned over the past several months, while the Tesla Berlin factory is running well below capacity.
Meanwhile, with the first quarter ending soon, Tesla ( NASDAQ:TSLA ) appears to be heading for a delivery miss. Wall Street consensus currently still has Q1 deliveries of 481,000 units, according to FactSet, but many analysts have cut predictions in recent days. Tesla is expected to report Q1 deliveries in early April.
Tesla Stock Performance
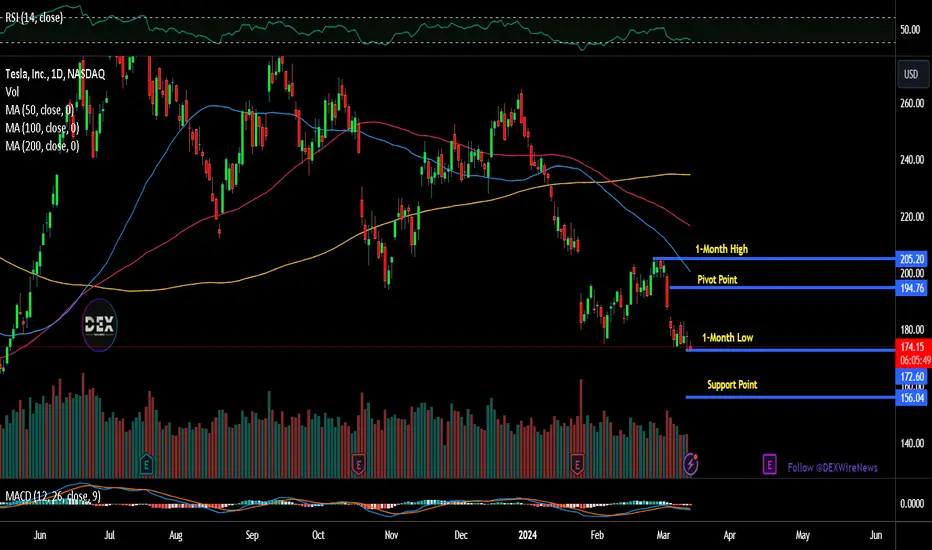
TSLA shares fell 3.3% to 167.14 during market action Friday. Tesla ( NASDAQ:TSLA ) shares has a weak Relative Strength Index (RSI) of 38.26 indicating selling pressure.
Last week, Tesla ( NASDAQ:TSLA ) stock dropped 6.7% to 163.57, hitting new 2024 lows and levels not seen since May 2023. NASDAQ:TSLA is down more than 14% in March and the biggest loser on the S&P 500 index so far in 2024.
UBS last week cut its Tesla stock price target to 165, from 225, and maintained a neutral rating on the shares. UBS lowered its Q1 delivery forecast to 432,000 units, from its previous 466,000 view. The firm also cut full-year deliveries to 1.96 million units, from 2.02 million previously.
With 2023 in retrospect, analyst consensus now has 2024 Tesla earnings below 2023's level. That signals another year of earnings declines for this growth stock. Wall Street expects Tesla earnings per share of just $2.96 a share in 2024, according to FactSet. That would be around a 5% decline vs. last year's $3.12.
Elonmusk

DWAC Acquisition Faces Rollercoaster Ride Amid Trump Merger The tumultuous journey of NASDAQ:DWAC stock, the special purpose acquisition company (SPAC) aiming to take former President Donald Trump's tech and social media platform public, continues to captivate investors amidst a whirlwind of events. From surging highs to staggering lows, the stock's trajectory reflects the intricate interplay between market expectations, legal challenges, and the enigmatic allure of the Trump brand.
In recent weeks, NASDAQ:DWAC shares have faced downward pressure as traders grapple with the implications of Trump's financial struggles. Amidst mounting concerns, the stock plunged to a monthly low of $32.25 before staging a partial recovery to $36.42. However, buoyed by optimism surrounding the pending merger with Trump Media & Technology Group (TMTG), DWAC saw a resurgence in pre-market trading, reaching a high of $38.
The merger between NASDAQ:DWAC and Trump Media has been fraught with controversy, marked by lawsuits, regulatory scrutiny, and speculation surrounding the viability of Truth Social, the conservative social media platform owned by Trump Media. Allegations of stock grabs, legal battles, and Trump's efforts to secure substantial bond funds to appeal a civil business fraud judgment have added to the uncertainty surrounding the merger.
Despite the challenges, NASDAQ:DWAC shareholders are poised to vote on the merger with Trump Media on Friday, signaling a pivotal moment in the company's trajectory. If approved, the merger could see Trump's stake in TMTG valued at a staggering $4 billion, a testament to the enduring allure of the Trump brand in the eyes of investors.
However, DWAC's fortunes remain intrinsically linked to Trump's political ambitions and legal battles. The former president's status as the top Republican candidate for president has fueled optimism among investors, with hopes of a Trump victory in the election potentially driving further gains for the stock.
Yet, concerns linger over the impact of federal charges and ongoing legal battles on the Trump brand and, by extension, NASDAQ:DWAC stock. Despite a recent decline in March and a substantial drop from its peak in October 2021, DWAC shares remain up 128% in 2024, underscoring the enduring interest in the company's potential.
As NASDAQ:DWAC navigates the choppy waters of Trump's financial woes and legal challenges, investors remain on edge, eagerly awaiting the outcome of Friday's merger vote and the subsequent implications for the company's future. With volatility likely to persist in the short term, DWAC's journey serves as a testament to the unpredictable nature of the market and the enduring fascination with the Trump phenomenon.

Tesla - Confirmed BreakdownHello Traders, welcome to today's analysis of Tesla.
--------
Explanation of my video analysis:
For more than three years, Tesla stock has been trading in a bullish flag formation. Two months ago Tesla once again retested the upper resistance trendline and failed to break out towards the upside. There are two major support levels below current market price which I do expect Tesla to retest. Then you can absolutely consider long setups again on Tesla stock.
--------
I will only take a trade if all the rules of my strategy are satisfied.
Let me know in the comment section below if you have any questions.
Keep your long term vision.

DCA on DOGEI'm positioned on DOGE from my DCA zone.
I'm expecting new highs for 2024/2025, be patient.

Elon Musk Poised To Open Dogecoin (DOGE) Payments For Tesla CarsElon Musk To Introduce Dogecoin Payments For Tesla
Elon Musk recently visited the German Tesla factory near Berlin due to a suspected arson attack and mentioned Dogecoin ( CRYPTOCAP:DOGE ) during his speech on the stage. He underscored the significance of launching DOGE as a payment method for Tesla and noted that it will be possible at some point. Moreover, he expressed optimism on the meme coin’s future and ecstatically remarked, “Dogecoin to the moon.”
If the announcement becomes true, it would mark a massive milestone for the DOGE crypto, which is currently vulnerable due to its rival Shiba Inu ( CRYPTOCAP:SHIB ). Meanwhile, Musk concluded that CRYPTOCAP:DOGE can be used as a means of payment to acquire Tesla merchandise currently. Furthermore, Musk spotlighted his unwavering support for the doge-themed crypto and highlighted why he endorsed Dogecoin in the past.
Musk revealed that while working in the Tesla and Space X plants, so many people asked him to support Dogecoin. Eventually, Musk agreed that CRYPTOCAP:DOGE is the “people’s crypto” and decided to back the King of meme coins. Moreover, he also highlighted that loads of “rich people” were supporting Bitcoin (BTC) but he chose DOGE owing to the request made by the general people. In addition, Musk spread optimism declaring, “DOGE is for you.”
DOGE Competition Intensifies
Shiba Inu has seen a surge in demand, overtaking Dogecoin in terms of the weekly trade volume. Despite Dogecoin’s status as the market leader in the meme coin space, Shiba Inu outshined DOGE’s trading volume last week. SHIB recorded an impressive $31 billion in trading volume last week.
Technical Outlook
Dogecoin is trading above its 200-day Moving Average with a Relative Strength Index (RSI) of 70 indicating moderate growth from the memecoin. The asset could find new resistance at the $0.236 mark.

TESLA just set the new target down to $100 - Problems for EVsTechnically we see an M Formation on Tesla.
The price broke below the neckline and the price is both below the 20MA and the 200MA.
The nature of this analysis is HIGH probability.
We, can set the first target to $100 and then next to $80. And if it breaks further we are talking $60....
But let's see.
There is fire in the EV space. With crashes, glitches, malfunctions, issues with snow, unable to track correctly objects on the streets and identifying.
There are also issues with having parts reordered when they breakdown.
And Elon is focussing more of his attention on X and SPace X. So this is not convincing and promising to shareholders to keep holding.

LTC, the Sleeping Giant now break out!! its ready to takeoff!!Technical Analysis: #LTC (Monthly Update)
#Litecoin now breakout the 238 days accumulation zone, This is just the beginning of new uptrend.
#Litecoin is ready to take off and looks too bullish, it will ready to test its previous high and make new ATH at year-end or earlier.
🥰If you find this helpful and want more FREE forecasts in Tradingview😍.
Please show your support back🙏,
Hit the 👍 LIKE button,
Drop some feedback below in the comment✍️!
❤️🤝 Your Support is very much 🙏 appreciated!❤️🤝
💎 Want me to help you become a better Crypto trader?
Now, It's your turn!
Be sure to leave a comment; let me know how you see this opportunity and forecast.
Trade well, 💪
#LTCCOIN #CRYPTO #BULLISHRUN #ALTCOIN #UPTREND

Tesla Faces Headwinds: Analysts Downgraded TSLA StockTesla ( NASDAQ:TSLA ), the electric vehicle (EV) pioneer, finds itself at a crossroads as analysts' sentiments diverge on the company's prospects. Recent downgrades and contrasting opinions reflect uncertainty surrounding Tesla's ( NASDAQ:TSLA ) delivery expectations, pricing strategy, and the viability of its next-generation vehicles. Let's delve into the nuanced landscape of Tesla's stock analysis and the divergent views shaping its trajectory.
Downgrades and Concerns:
Wells Fargo's downgrade of Tesla ( NASDAQ:TSLA ) to underweight, with a reduced price target, highlights concerns over disappointing first-quarter deliveries and ongoing price cuts. The firm's skepticism extends to Tesla's next-generation offering, particularly the economics of the anticipated Model 2. Everscore's projection of delayed ramp-up for Tesla's cheaper vehicle further compounds apprehensions, indicating potential challenges ahead.
Optimism Amidst Uncertainty:
Despite the prevailing skepticism, Wedbush Securities' analyst Dan Ives maintains an outperform rating for Tesla, albeit with reduced Q1 delivery expectations. Ives remains bullish on Tesla's long-term prospects, emphasizing a positive outlook for deliveries throughout the year. His optimism stems from observations during a recent trip to Asia, suggesting a slowdown in price cuts and potential stabilization in demand, benefiting Tesla and the broader EV industry.
Contrasting Views on Earnings and Performance:
Analyst consensus for Tesla's 2024 earnings paints a mixed picture, with projections below 2023 levels, indicating another year of negative growth. Morgan Stanley's Adam Jonas echoes concerns, lowering earnings projections and envisioning potential losses for Tesla in 2024. Despite trimming his price target, Jonas maintains an overweight rating, underscoring the complexity of Tesla's performance outlook amidst evolving market dynamics.
Market Response and Outlook:
Tesla's ( NASDAQ:TSLA ) stock performance reflects investor uncertainty, with recent declines and contrasting analyst opinions shaping market sentiment. As Tesla ( NASDAQ:TSLA ) navigates through delivery challenges, pricing adjustments, and the development of next-generation vehicles, stakeholders remain vigilant for signs of sustained growth and profitability. With Tesla's position in the EV landscape evolving, market watchers await clarity on its strategic direction and execution in the coming quarters.
BTC 📍 macro analysis ⏰ BULL 🚀🐂 RUN Hello 👋 it's me your RAJ 🙂 professional trader ✨
This idea 💡
is completely my own analysis to explain situation _&_ market conditions of BITCOIN 🪙
How this coin valid for long term 📌 including fud & news 🗞️ explained clearly 📌 #DYOR
📅 ....... BINANCE:BTCUSDT 👑 BITSTAMP:BTCUSD ........ 🌴
28TH - OCTOBER - 2024
/
10TH - FEBRUARY - 2025
🔝 $121236.10 🪙 🎯 ⚠️
>>> leading pressure stretch 💹
8-18TH - SEPTEMBER -2025
🤝 $175576.43 ❣🦩 ( 15-12-25 )
__________________________________________________________________________________________
🪩 disclaimer :
▶️ TQ u for supporting 💚 follow idea 💡 get updates everytime ⏰ when I updated 📌
Note 👀
👉 keeping comments , reacting with emojis , pointing us is very easy to some people
They think 💬 what they see 📌 that was knowledge 📌
We need to learn market in many ways and should get adopted with experience, TECHNICAL ANALYSIS won't help understanding market structure and understanding bull 🐂 and bear 🐻 is more important
Economical conditions
Fundamentals
Technical
News
Sentiments
Checking macro to micro having good plan and build it is very important ☺️
Some Times market easily turn suddenly bear // bull 🤣 even we need to catch 🫴 those movements is also very important ☺️ 💛
I hope i cleared my view 🙂 if any points if I miss I will add in update 📌 post
Try to understand, try to learn - try to move with flexibility with market is important
Have good day 😊
----------------------------------------------------------------------------------------------------------------------------------------------------------
Let's discuss about buy zone 📌 🙄
Support 📌 $21480 - $23368 - $26800 - $29800 - $33690
Accumulation range was $20000k to $36000 below 📍
Distribution zone 📌 $80k to $175k ( IMO :-: $100k to $140k )
Resistance 📌 $80000 - $104600 - $120000 - $135000 - $146000 - $168000
🚀🚀🚀🚀🚀🚀🚀🚀🚀🚀🚀🚀🚀🚀🚀🚀🚀🚀🚀
Note 📌 understood every update and take decision ⚡
90% chance there is no new low 🔅
90% chance max bull run will complete below $120K
90% chance BITSTAMP:BTCUSD will complete $80-100k wick $120k
Everything thing 📌 will be explained as thread 🧵 how and why
✨ Start 🧵👉

BITCOIN ALL TIM HIGH IN 3..2..1...With current market conditions it could be easy, the downside is limit
If you open short positions now you make it for us 𓄀
positions
by market price SL 65393
65212 SL 62883
62751 SL 61084
Follow for more!

Exactly the same as doge coin 2020, at least 2000% profitExactly the same as doge coin 2020, at least 2000% profit
Be ready for turbo flight
Elon Musk

Why I technically feel, Tesla is ready to build 30X againKeep It Simple and Trade With the Trend.
As a trader, you have probably heard the old adage that it is best to "trade with the trend." The trend, say all the pundits, is your friend. This is sage advice as long as you know and can accept that the trend can end. And then the trend is not your friend. There are multiple ways to spot trends, direction, and momentum.
So how can we determine the direction of the trend?
Let's take a look on the KISS rule, which says, "Keep it (as much as possible) simple, stupid!" Here is a method of determining the trend, and a simple method of anticipating the end of the trend.
Before we've started, it should be mentioned the importance of time frames in determining the trend. Usually, when we are analyzing long-term investments, the long-term time frame (one-week or larger) dominates the shorter time frames. However, for intraday purposes, the shorter time frame could be of greater value. Trades can be divided into three classes of trading styles or segments: the intra-day, the swing, and the position trade.
Large commercial traders, such as those companies setting up production in a foreign country, might be interested in the fate of the currency over a long period of such as months or years. But for speculators, a weekly chart can be accepted as the "long-term".
Averages Moving in Pairs
With a weekly chart as the initial reference, we can then go about determining the long-term trend for a speculative trader. To do this, we will resort to two very useful tools that will help us determine the stage of the trend. These two tools are the simple moving average and the exponential moving average.
Going further and keeping in mind all the mentioned above rules, lets build the trend.
Darlings, well graphed Tesla stocks trend is still the same as in 2019, where it started 30x gain.
Anybody tried to get all the path at those times? There's a chance you'll miss it again!

Tesla Just a ViewTesla seems to be in a longer term Head and Shoulder Pattern.
Please refer to the chart and see what i mean to say....
Regards.
Pls do subscribe...!

XRP, the Sleeping Giant Looks good!! could it ready to Breakout?Technical Analysis: #XRP (Monthly Update)
#Ripple coin is now trying to break out of the 1065-day accumulation zone, if it could, this is just the beginning of a new uptrend.
#Rpple Coin is almost ready to takeoff and looks too bullish, if march closes upper the trend line so will be ready to test its previous high and make a new ATH at year-end or earlier.
🥰If you find this helpful and want more FREE forecasts in Tradingview😍.
Please show your support back🙏,
Hit the 👍 LIKE button,
Drop some feedback below in the comment✍️!
❤️🤝 Your Support is very much 🙏 appreciated!❤️🤝
💎 Want me to help you become a better Crypto trader?
Now, It's your turn!
Be sure to leave a comment; let me know how you see this opportunity and forecast.
Trade well, 💪
#XRPCOIN #CRYPTO #BULLISHRUN #ALTCOIN #UPTREND

Makes and Breaks Level for BTC in Monthly Timeframe!!Technical analysis:
#BITCOIN (Monthly update)
* BTCUSD is trying to break the Raising wedge Pattern resistance in Monthly timeframe.
Bitcoin Bulls need to Reclaim the 66k Horizontal Resistance for further Upside movement ..
*BTC is now the most important zone right now, its makes or breaks level for bitcoin. if BTC doesn't break out may reach the 40k level again.
* RSI above 70 means bulls are in the upper hand, it will take the momentum from here and still have room to go upside..
🥰If you find this helpful and want more FREE forecasts in Tradingview😍.
Please show your support back🙏,
Hit the 👍 LIKE button,
Drop some feedback below in the comment✍️!
❤️🤝 Your Support is very much 🙏 appreciated!❤️🤝
💎 Want me to help you become a better Crypto trader?
Now, It's your turn!
Be sure to leave a comment; let me know how you see this opportunity and forecast.
Trade well, 💪
#bitcoin #crypto #nextmove #bullmarket #sideways #btcusdt #monthlyclosed

DOGE , long time no seeDOGE breakout above $0.090
MACD slope up with bullish momentum.
next strong resistance for DOGE at 0.105.
with current market sentiment, we believe DOGE has the potential to clear 0.105.
DYODD

Dogecoin... Pivot point 🐕Doge is in good support areas in the weekly time frame.. in terms of Fibonacci and trend channels. In my opinion, it can climb and reach the goals I specified on the chart in the long or medium term. be profitable

TSLA - I’m a believer, Are you ?TSLA has been hammered while rest of the MAG7 doing wonders.
IMO, soon or later Elon matters gonna settle.
and Tesla gonna showcase their AI potential to the world.
Technicals says 300 on the cards.
I’ve a starter position in commons and gonna add more as it moves up or pullbacks.
Gonna supplement with TSLL, TSLY and day-trade with weekly calls.
Long - Low 180-190s would be optimal.
Stop Loss - 174
Target #1 - 220
Target #2 - 280
Target #3 - 300

Qrdo analysis Qredo usdt analysis
Time frame weekly
Patern , 2 bottom
Risk rewards ratio >4
First target 0.84

DOGE Dogecoin Price TargetIf you haven`t sold DOGE after the bull run:
nor reentered on the Double Bottom:
Then you need to know that it potentially has a significant upcoming catalyst!
The recent launch of XPayments has generated excitement around $DOGE.
There is speculation about whether Elon Musk will fulfill his promise to accept #Dogecoin payments on X.
The unveiling of a new payments account by X opens up the possibility of Dogecoin becoming a payment option.
The GitHub account of X (Twitter) Developers apparently includes code mentioning DOGE.
If an integration with X payments materializes, things could become very intriguing and fast-paced for Dogecoin and other dog-themed meme coins. 🚀
I am optimistic about Dogecoin's potential to achieve a new all-time high!
With the stock market reaching record highs, there is growing optimism that the positive momentum could spill over into the crypto market.
Historically, we've seen a correlation between bullish sentiments in traditional markets and increased interest and investment in cryptocurrencies.
As traditional investors seek diversification and alternative assets, the crypto market, with its potential for high returns, could benefit from this wave of enthusiasm.
This alignment with the prevailing positive trends in the stock market might act as a catalyst, fostering a bullish outlook for the crypto market in the coming days.
My short term Price Target for DOGE Dogecoin is the next resistance, $0.11, or even the next one, $0.145.

SHIB Shiba Inu Price TargetIf you haven`t sold the Bearish Pennant:
Nor bought the dip on SHIB:
With the stock market reaching record highs, there is growing optimism that the positive momentum could spill over into the crypto market.
Historically, we've seen a correlation between bullish sentiments in traditional markets and increased interest and investment in cryptocurrencies.
As traditional investors seek diversification and alternative assets, the crypto market, with its potential for high returns, could benefit from this wave of enthusiasm.
This alignment with the prevailing positive trends in the stock market might act as a catalyst, fostering a bullish outlook for the crypto market in the coming days.
My Price Target for SHIB Shiba Inu is the next resistance, $0.00001050.

TSLA Recovery to $4001D Chart
From a technical viewpoint, Tesla ( NASDAQ:TSLA ) is setting up for a short-term recovery to the $200-210 range before another steep correction. Should significant support be met around the $100 range, a sharp recovery back to previous highs near $415 will be in sight. The following patterns are visible on the 1D chart:
Impulse and Correction Waves
Because the 1, 3, & 5 Impulse Waves were in the down direction, then according to Elliott Wave Theory, the Correction Waves (ABC) should see the beginning of a rally. Wave A will move opposite of Wave 5 and should lose momentum between $200-220 which are 50% & 61.8% Fibonacci Retracement levels respectively. Wave C would develop a double bottom setup that could propel TSLA back to $300.
Head & Shoulders
If the Elliott Waves do not prove valid then a H&S pattern is likely with a right shoulder peak meeting resistance between $200-220 before sending share prices back to a low of $100. I am less confident of this pattern as it appears a premature recovery is about to begin. The neckline rests around $150 but Money Flow Index is already in severely oversold territory and the On-Balance Volume has an overall positive slope.
Double Bottom
In the unlikely event that the H&S comes to fruition then I believe it will serve as the setup for a larger double bottom pattern. Stepping back for a better bird's eye view, the On-Balance Volume has a healthy positive slope and Money Flow Index is in oversold territory. However this pattern will take months to develop so it is too soon to begin loading up for this particular trade as a swing or day trader.

Tesla - Is It A FakeoutHello Traders, welcome to today's analysis of Tesla.
--------
Explanation of my video analysis:
After Tesla broke out of a long term triangle formation in 2019 we saw a pump of +1.500% towards the upside. Tesla is currently once again forming a (bullish) triangle pattern but broke short term support towards the downside. If we see a retest of the bottom of the triangle which I mentioned in the analysis, I am looking for longs to capitalize on a potential bullish rejection.
--------
I will only take a trade if all the rules of my strategy are satisfied.
Let me know in the comment section below if you have any questions.
Keep your long term vision.
