$TSLL – Major Reversal in Play? Is tesla finally back???
TSLL has been in a prolonged downtrend but is now showing signs of a potential bottoming pattern. Price recently tested a key support zone between $6.26 and $7.18, holding firmly after multiple attempts to break lower.
Current price action is forming a strong base, and the first green candle breaking out of this range suggests momentum may be shifting.
The upside target is set near $20, which lines up with a previous consolidation zone and psychological resistance. A break and hold above current levels could trigger a strong move higher.
Risk is defined below support, making this a favorable risk-to-reward setup. Watching closely for follow-through confirmation.
Elonmusk

Tesla Is Retail Traders' Choice, JPMorgan Says. Are You Buying?Tesla NASDAQ:TSLA has endured a soul-crushing experience over the past three months or so. The stock is down 50% from the record high of $480 hit in December (more than $700 billion in market cap washed out). Even insiders have sold a big chunk of their holdings.
But over the past three weeks (12 trading days to be precise), investment bank JPMorgan NYSE:JPM says, retail traders just couldn't get enough of it.
Retail net buying activity in TSLA stock. Source: JPMorgan
They’ve consistently been buying the dip, and then the dip of the dip and then… you get it. Every new dip is seen as a buying opportunity to the daredevils among us who try to catch a falling knife.
In the latest issue of “Retail Radar” — JPMorgan’s weekly report revealing where the retail money is flowing — the banking giant traced a net $12.5 billion of retail cash poured into stocks or stock-related investments last week.
As much as $4.2 billion went into ETFs (diversification, nice), where a cocktail of ETFs with a broad selection of stocks took the lion’s share along with some gold ETFs . Still, the big chunk of the pie went into individual equities — $8.3 billion of cold hard cash was injected into the retail-trading darlings Tesla NASDAQ:TSLA , Nvidia NASDAQ:NVDA and other Mag 7 members.
🤿 Buying the Dip
Here’s what the bank said:
“Single stocks accounted for +$8.3B of the inflow. TSLA (+$3.2B, +3.5z) and NVDA (+$1.9B, +1.1z) collectively contributed more than half, and the rest of Mag 7 contributed another $1B. Notably, they have been buying TSLA for 12 consecutive days, adding $7.3B in total.”
The 3.5z and the 1.1z describe the standard deviation of the retail traders’ net flows compared to the 12-month average. (Keep reading, it gets even better.)
Did you hear that? Tesla dominated the charts. Day trading bros have kicked in a total of $7.3 billion into Elon Musk’s EV maker over the past 12 cash sessions. It even won some praise from JPMorgan analysts who said this endeavor represents “the highest magnitude among all past ‘buying streaks’ in over a decade.”
Here’s the best part:
“Retail investors returned as aggressive buyers on Wednesday, breaking the $2 billion threshold in the first half of the day (the 2nd time this year), and ending the day at $3.7 billion inflows (+7z),” JPMorgan noted (Wow, 7 standard deviations above the mean). “We observed their allocation into ETFs/single names are at 30/70% during a typical heavy buying day. Among single names, NVDA and TSLA led the inflows.”
JPMorgan also estimated that retail traders’ efforts to snatch the W this year are just bad.
“We estimate retail investors’ performance is down by 7% year to date (vs. -3.3% loss in S&P). Most of the drawdown came from March as they increased their holdings in Tech.”
Retail traders' performance, year to date. Source: JPMorgan
🤙 The YOLO Moment
Buying Tesla shares right now is the ultimate YOLO play. We’re only a week away before Tesla announces what’s shaping up to be the worst delivery figure in years. After a few cuts to delivery targets, considering Europe’s sales took a huge L earlier this year, analysts now predict first-quarter deliveries to land at an average of 418,000 vehicles.
Goldman Sachs NYSE:GS , for one, is bigly bearish on the number. It trimmed its target by 50,000 to 375,000 cars. If true, it would mean that Tesla’s business is shrinking by 3% compared with Q1 of 2024 when deliveries hit 387,000 units.
For the year, analysts expect sales to land anywhere between 1.9 million and 2.1 million. With looming competition in the global auto space , Tesla will need to work extra hard to meet these numbers. In 2024, Tesla rolled 1.8 million vehicles off the assembly line and into customers’ hands (down 1% from 2023).
👀 Are Retail Traders Buying the Dip?
What better place to gauge retail traders’ sentiment than the absolute best trading community out there? Let’s hear it from you — share your thoughts on Tesla! Have you been buying the dipping dip that just keeps carving out new lows? Or you’re a freshly minted Tesla bear after all the havoc and drama around Elon Musk? Off to you!

JUST IN: Elon Musk's DOGE Blocks $52 Mln Payment to WEFThe Department Of Government Efficiency (D.O.G.E) a mechanism set up by the President Donald Trump headed by Elon Musk in a shocking news has block $52 million payments intended to be given to the World Economic Forum (WEF). This and many more blockage and unnecessary spendings was tracked and blocked by the DOGE team.
Now, knowing Elon Musk's unwavering support to the altcoin Dogecoin ( CRYPTOCAP:DOGE ) a token that is based on the popular "doge" Internet meme and features a Shiba Inu on its logo, CRYPTOCAP:DOGE coin price is fundamentally tied to The Department Of Government Efficiency (D.O.G.E).
Somehow this mechanism set up by Donald Trump might be the catalyst needed by CRYPTOCAP:DOGE coin to break the psychological $1 resistant with traders eyeing a $1 move this year. As more frivolous spendings and wasting of government funds are unravel, CRYPTOCAP:DOGE coin might be on the verge of a breakout amidst a falling wedge pattern formed since the 2nd week of February, 2025.
Dogecoin Price Live Data
The live Dogecoin price today is $0.169289 USD with a 24-hour trading volume of $1,053,328,921 USD. Dogecoin is down 2.66% in the last 24 hours, with a live market cap of $25,141,281,592 USD. It has a circulating supply of 148,510,656,384 DOGE coins and the max. supply is not available.
TRB/USDT(UPDATE)Hello friends
Given the price drop, you can see that buyers supported the price on good support and were able to build a higher ceiling.
Now we have identified important and practical support areas for you to buy in steps and with capital management.
Price targets have also been identified...
*Trade safely with us*

WIF/USDTHello friends
According to the market cycle, the price decline is ongoing and is expected to continue.
Now the only important support is the green area, which the price reaches there and we will see what reaction we get from the buyers.
Will they support the price or will the decline continue...
If you want to be with us in this alt season, send us a message.
*Trade safely with us*

MAV/USDTHello friends
After a heavy fall, now with the trend line broken and the ceiling and floor hit higher, it is expected to move to the resistance area.
You can enter the capital with capital management.
*Trade safely with us*

TSLA ! You like money? You like money ?We're here to make money! I don't care about politics or idealists. If TSLA makes +20% in the next few weeks, I'll be very happy! End of story. I only do technical analysis. No emotions here.
hedge funds, YOUR pension funds and market makers have to pay themselves! They're buying the dip, while you're watching the stock collapse! Wake the hell up!
Some troll here haha

Dogelon Mars Set For Price Reversal Amidst Steep Falling Wedge Dogelon Mars is a dog-themed meme coin built on the Ethereum and Polygon chain, following the example of other successful dog coins like Dogecoin, Shiba Inu and Floki Inu is set for a price reversal after surging 250% in the Month of January 17th, 2025 before quickly retracing.
Chart pattern shows an impending 400% surge coming up on the horizon. With partnerships from top blockchains like Arbitrum, Orca, Houbi, OKX, Solana, etc. AMEX:ELON coin is set to be on a bullish course with a 400% surge in sight.
Dogelon Mars has had a market cap of $1.25 billion in the year 2021 before retracing to $72.5 Million in market with increasing momentum and an active telegram community AMEX:ELON is very much ready for the next legged-up.
About Dogelon Mars
Dogelon Mars plays on several popular themes in the meme coin space. Its name is a mixture of Dogecoin and Elon Musk, the billionaire entrepreneur who is an outspoken supporter of Doge. It alludes to Mars, a spin on the famous moon meme, implying that Dogelon will experience a massive upward movement. Beyond its tongue-in-cheek name, Dogelon Mars has managed to build a significant community, with more than 494,000 Twitter followers and more than 48,000 followers on Telegram.

TESLA road map !!!Tesla's price can drop below $200 and then have a good increase.
Give me some energy !!
✨We spend hours finding potential opportunities and writing useful ideas, we would be happy if you support us.
Best regards CobraVanguard.💚
_ _ _ _ __ _ _ _ _ _ _ _ _ _ _ _ _ _ _ _ _ _ _ _ _ _ _ _ _ _ _ _
✅Thank you, and for more ideas, hit ❤️Like❤️ and 🌟Follow🌟!
⚠️Things can change...
The markets are always changing and even with all these signals, the market changes tend to be strong and fast!!

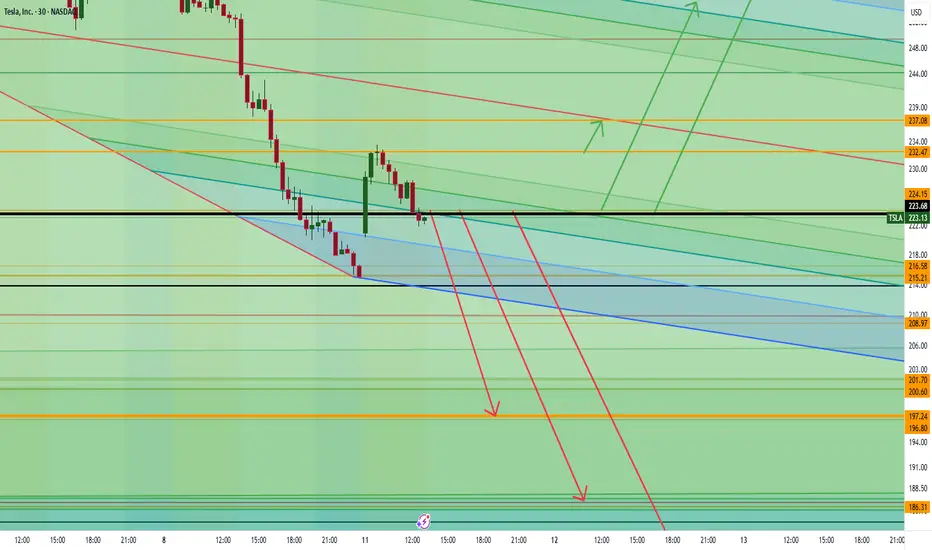
Tesla is About to Collapse… or Skyrocket—Are You In?Tesla is all over the news with boycotts, drama, and market chaos, but the real action is on the charts. If we break below 222, things could get ugly fast with a drop toward 197, 186, and even 176. But if we hold above 223, momentum could send us flying past 232, 237, and potentially 256 or even 264.
Big money is watching, and the next move could be massive. The question is—are you trading this or just watching from the sidelines?
Kris/ Mindbloome Exchange
Trade Smarter Live Better
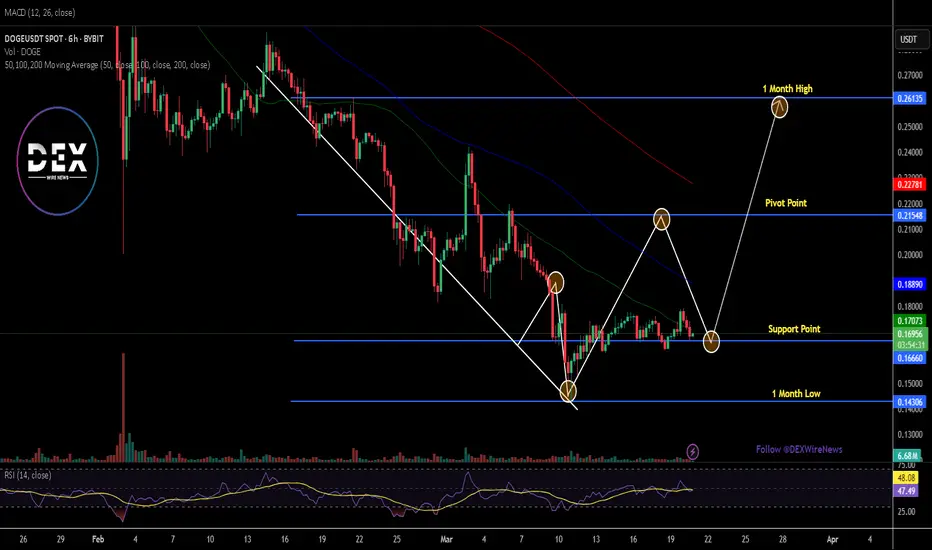
Phemex Analysis #66: Pro Tips for Trading Dogecoin (DOGE)In the volatile world of cryptocurrencies, Dogecoin ( PHEMEX:DOGEUSDT.P ) has consistently captured the attention of traders and enthusiasts alike. In October 2024, DOGE experienced a remarkable surge, climbing from $0.11 to a peak of $0.48—a gain of nearly 500%. However, this exuberance was short-lived, and the price has since plummeted by 70%, currently trading around $0.15.
A closer examination of the daily chart reveals a potential bullish reversal indicator. On March 11, DOGE's price dipped lower than its February 28 level, yet the Relative Strength Index (RSI) remained similar on both dates. This RSI divergence often signals a potential bullish reversal. However, caution is advised before making any trading decisions. Let's explore a few possible scenarios, using support and resistance levels as our guide.
Scenario 1: Bullish Reversal
The observed RSI divergence suggests that selling pressure may be waning, potentially paving the way for a price rebound. If DOGE manages to break above the immediate resistance levels, this could confirm a bullish reversal.
Pro Tips:
Monitor Resistance Levels: Key resistance levels to watch are $0.19 and $0.22. A decisive break above these levels, accompanied by increased trading volume, could signal the start of a bullish trend.
Risk Management: Consider setting stop-loss orders below recent support levels to mitigate potential losses if the bullish reversal does not materialize.
Scenario 2: Continued Downtrend
If DOGE fails to maintain its current support levels, the downtrend may persist. A drop below the critical support at $0.15 could lead to further declines.
Pro Tips:
Identify Support Levels: The next significant support levels are $0.127 and $0.10. Traders should watch these levels closely for potential buying opportunities or further declines.
Short Positions: Advanced traders might consider short positions if DOGE breaks below key support levels, aiming to profit from the continued downtrend.
Scenario 3: Sideways Consolidation
DOGE may enter a phase of sideways movement, trading within a defined range as the market seeks direction.
Pro Tips:
Range Trading: Identify the upper and lower bounds of the trading range. Buying near support and selling near resistance can be an effective strategy in a consolidating market.
Grid Bots: Since price volatility is smaller during consolidation, utilizing grid bots to capitalize on small price movements is highly recommended.
Final Thoughts
Dogecoin's recent price movements present both challenges and opportunities for traders. While technical indicators like RSI divergence suggest a potential bullish reversal, it's crucial to consider all possible scenarios and employ sound risk management strategies. By staying informed and vigilant, traders can navigate DOGE's volatility and make informed decisions.
Tips:
🔥 Break free from "buy low, sell high"! Our new Pilot Contract empowers you to profit from ANY market direction on DEX coins with up to 3x leverage. Go long, go short, go further!
Check out Phemex - Pilot Contract today!
Disclaimer: This is NOT financial or investment advice. Please conduct your own research (DYOR). Phemex is not responsible, directly or indirectly, for any damage or loss incurred or claimed to be caused by or in association with the use of or reliance on any content, goods, or services mentioned in this article.

TESLA important support. Are positive days coming?TSLA coming to an important support level. It can bounce back for a while, It dropped %55 from top.
Positive days coming?
Many cryptocurrency dominance charts, as well as Nasdaq and stock charts too, showing the same pattern. Is the reversal starting?
Check my other analysis too.
We’ll see.
This is not investment advice. Please do your own research.
Wishing you best.
-YusufDeli

Tesla I Tipping Point: Short Opportunity with Head & Shoulders Short opportunity on Tesla
Based on Technical + Fundamental View
-market structure
-Head and shoulder pattern
-Double top
-Currently trading at supply zone which was a recent support and now an ideal place for a reversal to create the right shoulder of the bigger head and shoulder pattern - Daily time frame
-Product Development Delays
-Margin Pressure
-Decreased average selling price
- Increased Competition
- Flat /Declining Sales
- Leadership Concerns: Elon Musk's polarizing political activities and his divided attention between Tesla and other ventures (such as his involvement with OpenAI) have raised concerns among investors. Some analysts suggest that Musk's public perception may negatively impact consumer sentiment towards Tesla, leading to decreased sales and loyalty among customers.
Technical view
Double top
Unlike the classic double top, where the second peak reaches or exceeds the height of the first peak, the Type III double top fails to reach the previous high. This failure signifies a significant shift in market sentiment and an increase in selling pressure than usal.
Head and shoulder pattern - Pretty visible. Right shoulder is yet to be formed, Which makes an ideal place to SELL with a Risk Reward ratio. (Approx 1:6.4)
Pro Tip
Wait for a bearish candle stick pattern to execute trades on end of the day keeping stop loss somewhere above the supply zone.
Target 1 - 307$
Target 2 - 271$
Target 3 - 237$
Stop Loss - 380.21$
Fundamental View
Valuation Concerns: Tesla's stock is currently viewed as significantly overvalued, with a fair value estimate of $210 per share according to multiple analysts, including Morningstar and Firstrade. This valuation reflects a substantial premium over its current trading price, indicating potential downside risk for investors.
Earnings Performance: Tesla's Q4 2024 earnings are anticipated to show continued improvement, with expectations of gross profit margins exceeding 20%. Analysts believe that the automotive segment's performance has stabilized after a challenging first half of the year, driven by increased deliveries and lower production costs.
Market Dynamics: Despite strong demand for Tesla's vehicles, the company faces pressures from declining average selling prices due to price cuts implemented in 2023. This trend is expected to continue as competition intensifies in the electric vehicle (EV) market.
Product Development: Tesla is set to launch new models, including an affordable SUV (Model Q) aimed at increasing market share in the lower-priced vehicle segment. Additionally, advancements in autonomous driving technology are critical for future growth, with plans to roll out Level 3 Full Self-Driving software in select states and regions.
Analyst Ratings: The consensus among analysts remains mixed, with a combination of "buy," "hold," and "sell" ratings. The average price target reflects a cautious outlook, suggesting that while there is potential for upside, significant risks remain due to valuation concerns and competitive pressures.
Not an investment Advise

ELON BUYHello friends
Given the price reaching resistance and the long price correction, now is a good opportunity to buy...
Here we suggest you buy step.
We have also specified price targets for you.
*Trade safely with us*

Tesla at a Crossroads: $257 or a Dive to $242? Alright, Tesla fam—big decision point ahead. Do we hold $257 and drop to $242, or are we about to rip to $280 and start pushing for higher highs? Either way, something big is brewing. How are you playing this?
Kris/Mindbloome Exchange
Trader Smarter Live Better

why ELON MUSK keeps talking about a US bankruptcy…I think I’ve figured out why Musk keeps talking about a U.S. bankruptcy…
They have to pay—and pay a lot!
In 2025 alone, a staggering $7 trillion needs to be repaid! 7 TRILLION DOLLARS! (image on chart)
Right now, the U.S. is trying to pull in money from all over the world, which is probably the real reason behind the tariffs.
To avoid bankruptcy, they have a few options:
1. Print more money
2. Cut spending
3. Take on new debt at higher interest rates
4. Declare bankruptcy—admit they can’t pay their debts
That’s why Musk keeps mentioning point 4. That’s why spending cuts are happening so fast. That’s why tariffs are being imposed. That’s why Trump is pushing for lower interest rates. That’s why they launched the Green Card sale. They are trying to save the U.S. from bankruptcy—and the world from a financial crisis.
Obviously, they can’t just slash spending too much. In his interview with Joe Rogan, Musk said it’s not that simple because a lot of high-level corruption is hidden in the system. He even admitted, “I won’t talk about it—if I do, they’ll kill me. It’s too much, and people wouldn’t be able to handle the truth.”
The only real solution might be Bitcoin, which can create virtual money without printing physical dollars—a profitable paradox.
To activate a real bull run that will save high-risk assets like altcoins, the U.S. must start increasing global liquidity. This is the rule—and they will do it. Even rumors about the U.S. handing out money to taxpayers (some sources mention $5K per taxpayer) are aimed at increasing market liquidity.
The end of a bull run always coincides with the highest levels of global liquidity. Currently, many large funds are overleveraged and looking to take some profits to avoid problems. This is always the moment when “large capital” waits for global liquidity to peak before strategically cashing out of positions.
Even with ETFs on altcoins, large funds will gain significant profits through annual fees. They will list any shitcoin just to collect these fees from investors. Moreover, they will control liquidity through ETFs, just as they did with the stock markets. This is an indirect way of “driving the markets like a car.”

TSLA: Down 44% – Is This the Bottom?Tesla has been absolutely crushed since hitting its all-time high at $485. A 44% drop isn’t shocking after such a huge rally, but it’s still a brutal move. Now, we’re back into support, sitting near the level of Wave 1 – so far, nothing completely out of the ordinary.
Maybe to counter some of the selling pressure, Elon Musk tweeted yesterday that he sees a 1000% price increase in the next five years – if the work is put in. Take it however you want. The tweet probably gave TSLA a short-term boost, since Musk’s words always spark some level of hope. But we’ve seen this game before – big claims, and sometimes, reality doesn’t follow through.
Technically speaking:
As long as Tesla holds the order block between $240 and $260, or at least the current support, things don’t look too bad. But if that level breaks, things could get ugly – and $150 might not be far off.
For now, this remains one to watch.

TSLA’s Next Big Move: Collapse or Skyrocket? Key Levels to WatchTesla (TSLA) is approaching key price levels that will determine its next move.
Potential Downside:
-If TSLA drops below $297, the next level to watch is $292.
-A break below $292 could lead to $283.
-If $283 fails, the price may drop significantly toward $222.
Potential Upside:
-If TSLA reverses, it could rise back to $384.
-A breakout above $384 could push it to $431 and beyond.
If this analysis added value to you, please like and share!
Kris/Mindbloome Exchange
Trade Smarter Live Better

BTC Inverse H&S ConfirmedIn recent post we slipped on the structure around 92k and are in a rebound zone around 86k with a low of 78k. I believe a bullish rebound will happen starting in the month of March all the way into October. This head and shoulders formation should be the start of a familiar pattern in the 2021 bullish run. This run may lead beyond 150k and above.
This is NFA. Good luck!
-R2C

Doge isn't looking goodDogecoin just crashed to 0.185, and it’s definitely at a pivotal spot right now.
Price Action & Key Levels
The price is testing a major support zone between 0.180–0.190, a level that’s held firm in the past. If it holds here, we could see a bounce back up. But if it breaks below 0.180, watch out, next stop could be 0.160, a strong support from earlier this year. On the upside, DOGE has been sliding in a descending channel for a while. A break above the upper trendline, around 0.200, might kick off a rally toward 0.220. So, the range to watch is 0.180–0.190 as the floor and 0.200 as the ceiling.
Technical Indicators
RSI: Sitting at 35, close to oversold. This could tempt buyers to step in soon.
MACD: Showing a bearish crossover, which means momentum’s still leaning down, but it’s not crazy strong yet.
50-day Moving Average: DOGE is below it at ~0.195. Reclaiming this level would be a bullish signal.
Volume: Spiked hard on the drop (lots of selling), but a big volume push on a bounce could turn things around.
Bullish Case: A daily close above 0.195 (50-day MA) or a break past 0.200 could signal a reversal.
Bearish Case: A close below 0.180 opens the door to more downside.
DOGE often moves with Bitcoin, and BTC’s looking shaky lately, so that’s a headwind. But meme coins like DOGE can defy logic if hype kicks in, keep an eye on social media chatter. For now, set alerts at 0.180 (support) and 0.200 (resistance), and use stop-losses to play it safe. Wait for a clear move before jumping in, this chart’s still deciding its next step.

Tesla - Elon Is Playing The Charts!Tesla ( NASDAQ:TSLA ) is perfectly respecting structure:
Click chart above to see the detailed analysis👆🏻
Two months ago Tesla perfectly retested the previous all time high resistance and closed with a massive rejection wick. This means that a correction - which is currently happening - is expected and after the bullish break and retest, we will then finally see new all time highs.
Levels to watch: $280, $400
Keep your long term vision,
Philip (BasicTrading)

2 Minute DXYZ Analysis: Key Levels to Watch for the Next MoveWe hit our 34 target on DXY, but what’s next? If we break above 49, we could see a solid bull run. However, if weakness continues, we might test lower levels at 31, then 29, and possibly 23.50 for a deeper correction.
Watching these levels closely—what’s your outlook on DXY? Drop your thoughts below.
Kris/Mindbloome Exchange
Trade Smarter Live Better

Quick 4-Min Tesla Analysis: Deeper Pullback or Ready for LiftoffJust wrapped up a quick Tesla analysis (under 4 min)! Right now, we could see a dip to the $289 zone before pushing higher, or a deeper move down to $250 before driving up toward $475.
Where do you think Tesla is headed next? Let me know your thoughts!
Kris/Mindbloome Exchange
Trade Smarter Live Better
