IOTAUSD - bullish falling wedgeIOTA formed a bullish falling wedge.
Resistance at 21-EMA-daily- line.
Just an idea
Exponential Moving Average (EMA)

VeChain - Longterm Weekly Chart AnalysisLet’s have a look at the weekly chart for the most criminally undervalued crypto EVER. A Blockchain that is actually being USED by some of the words top companies and has a client base that would make any corporate jealous & salivate with envy. It HAS and IS everything every other Blockchain wishes it was. Worthy of note it that the behemoth PwC is an actual shareholder! I’m talking of course about VeChain.
VET is below its Bollinger Bands Middle Band Basis 20 Period SMA. A weekly CLOSE ABOVE this level is crucial.
VET is still above its 50EMA on this 1W timeframe.
VET is still above its Least Squares Moving Average (LSMA) and note that the last weekly candle bounced off the LSMA as support.
Note that overall Volume is still relatively low and the last 16 weekly Volume Bars have been below its Volume 20 Period Moving Average.
VET is still above its Volume Profile Visible Range Point of Control (VPVR POC) for this charts Visible Range.
VET is below its Volume Profile Fixed Range Point of Control (VPFR POC) for the fixed range of 9 Weekly Candles that i have selected. A weekly Candle CLOSE ABOVE this POC is crucial.
I have added a few support and resistance areas. At the moment, VET has found some support from its lower support area located at around $0.107 - $0.113 . A weekly CLOSE ABOVE the support are is crucial but not the end of the world if we don’t as there is still a lot of support below.
Note that VET is in a massive Symmetrical Triangle on this weekly timeframe. Note that the APEX is around the week of the 13th December.
The Moving Average Convergence Diveragnce (MACD) is indicating momentum is downwards at the moment and note that the MACD Line (Blue Line) has crossed back under its Signal Line (Orange Line) creating a Red Histogram. Note however that the MACD Line (Blue Line) is still above the 0.0 Base Line in the Positive Zone. A drop below the 0.0 basle line on this 1W timeframe will be very bad so its crucial VET stays above the 0.0 base line in the positive zone.
The On Balance Volume (OBV) is indicating momentum is downwards within a range at the moment. Note that the OBV (Blue Line) is below its 9 Period EMA (Yellow Line). We need the OBV (Blue Line) to cross back above the 9 Period EMA (Yellow Line) as well as break back ABOVE the dotted line at around 162.8B and then at around 163.72B for upwards momentum confirmation. The OBV indicator needs to stay above the 160.079B level.
Looking at this longterm chart, even if VET does drop lower, it would still be in a longterm uptrend so long as VET CLOSES ABOVE its Longterm Trend-Line (Dashed Line).
Unless BTC massively shits the bed again down to $28k then VET won’t drop to $0.07 but VET may possibly drop to $0.099 - $0.0934 if downwards pressure continues and VET cannot make a higher low or higher high next week.
Hopefully, after the release of POA2.0, we’ll see VeChain added onto other major exchanges & platforms like Kraken, Coinbase, Phemex, eToro and Bitstamp which will bring much needed liquidity and exposure. I mean FFS, if ShibaInu & Dogecoin are good enough for Coinbase & eToro, surely VET must be. ;-)
I hope this is helpful with your Trading and Hodl-ing.
Notes for those who don’t know:
LSMA = Black Squiggly Line on Chart
50EMA = Yellow Squiggly Line on Chart
Bollinger Bands = Grey Bands on Chart
Longterm Trend-Line = Dashed Line on Chart
VPVR POC = Long Horizontal Red Line on Chart
VPFR POC = Short Horizontal Red Line on Chart
Volume Bars = Green and Red Bars Bottom of Chart
Volume 20 Period MA = Blue Line going through Volume Bars on Chart
Support and Resistance Areas = Black Lines with Yellow Shading on Chart
Symmetrical Triangle = Ascending dn Descending Trend-Lines

lUNA 1H EMA 200+STOCHAm facut backtest la tf de 1H , ema200+stoch. Capital 1000 de USDT, a rezultat un profit de 1327 dolari. 4 Loss, 7 Wins, Winrate = 64. Profit = 33%.

The big picture of BitcoinJust to show you the big picture. Still looks very good so don't panic....................!

$BTC - Showing the way forwardUsing the Ema Ribbon from Trading View to confirm bullish/bearish direction on BTC.
If price closes below the bottom of the ribbon we will see more downside. If price stays above the bottom of the ribbon it remains bullish.
So far price has been rejecting as support the bottom of the ribbon which is bullish.

FITB Nice BarNASDAQ:FITB daily chart looks good after a nice bar today showing a lot of strength. It has had a series of higher lows and broke through a trendline today.
EMA's and MACD are bullish and accelerating upward.

BTC ACTUAL SITUATIONIf we don't keep EMA 21 we're flying down for more support. Bullrun ends only after breaking the zone 32200 $ - 28900 $

BTC - Let's have a look at the Weekly ChartBTC - let’s have a look at the 1 week chart for a change:
Note that BTC is still above its 50MA for this 1W timeframe.
BTC is still above its Bollinger Bands Middle Band Basis 20 Period SMA on this 1W timeframe. Note that the Upper and Lower Bollinger Bands are looking very close to expanding, at the moment, if they do expand, this would be expansion for the downside.
BTC is still in its longterm upwards Pitchfork Pattern (A,B,C). Note that BTC has found some support from its Pitchfork Median Line. A weekly CLOSE ABOVE this level is crucial if you are waiting to go LONG. A CLOSE BELOW this level will be great if you are waiting to go SHORT.
The week hasn’t finished yet but its very likely that BTC will close this weekly candle as a massive Bearish Engulfing Candle. Note that it is a very similar looking candle to the week of 10th May which, if true, may lead to further drops.
BTC is still above its Least Squares Moving Average (LSMA) level on this 1W timeframe.
BTC is back below its Volume Profile Fixed Range Point of Control (VPFR POC) for the fixed range of 8 weekly candles that i have selected. It is very crucial that BTC CLOSES a weekly candle ABOVE this POC.
Note that Volume is still relatively low and note that the Volume Bars have not been above its Volume 20 Period MA since the week of the 17th May.
I have added the crucial support and resistance areas on this weekly chart, you can clearly see that BTC is sandwiched in between a rock and a hard place.
The Average Directional Index (ADX DI) is indicating the overall trend strength has weakened dramatically on this 1W timeframe. The ADX (Orange Line) has dropped to 27.18 and is below its 9 Period EMA (Black Line) which is at 34.01. The +DI (Green Line) is at 19.82 and the -DI (Red Line) is at 18.80. At the moment, Positive Momentum is still dominant on this 1W timeframe, but note that the +DI (Green line) is pointing downwards and the -DI (Red Line) is pointing upwards, this indicates we may see Negative Momentum become dominant on this 1W timeframe if the +DI (Green Line) crosses back UNDER the -DI (Red Line).
The Chaikin Money Flow (CMF) is actually indicating that BTC is still being Accumulated with the CMF (Green Line) in the accumulation zone at 0.12. Note that we have accumulation strength because the CMF (Green Line) is still above its Least Squares Moving Average (LSMA) which is at -0.01 for this 1W timeframe.
The Relative Strength Index (RSI) is indicating momentum is downwards on this 1W timeframe at the moment. Note that the RSI (Purple Line) has crossed back UNDER its 9 Period EMA (Orange Line) which is a sign of strong Negative Momentum on the 1W timeframe.
The Moving Average Convergence Divergence (MACD) is crucial to watch because if you are LONG then you don't want the MACD Line (Blue Line) to cross back UNDER the Signal Line (Orange Line) for this 1W timeframe. Note that the MACD Line (Blue Line) is still above the Signal Line (Orange Line) and is also still in the positive zone for this 1W timeframe.
For this 1W timeframe, the support area at $42,721 - $40,670 is absolutely crucial to CLOSE a weekly candle ABOVE. Note that this level also has the Pitchfork Median Line running through it as well as the Bollinger Bands Middle Band Basis 20 period SMA. If those levels fail as support then BTC will head to the LSMA and then 50MA level.
If we do get an influx of upwards momentum, we STILL need to keep an eye on how this weekly candle CLOSES, because the Bearish Engulfing Candle could become a potential Hanging Man Candle, which would be potentially more devastating. Note that CONFIRMATION on what candle this weekly candle becomes and what direction, will be CONFIRMED on how the NEXT weekly candle ends.
As with everything, depending on what timeframe you are in be it short-term, mid-term or longterm, confirmation is key. It should be a very interesting couple of days.
I hope this is helpful with your trading and hodl-ing.
Notes for those who don’t know:
LSMA = Black Squiggly Line on chart
50MA = Blue Squiggly Line on Chart
Bollinger Bands = Grey Bands on Chart
Pitchfork Pattern = A,B,C Pattern on Chart
VPFR POC = Short Horizontal Red Line on Chart
Volume Bar = Bottom of Chart
Volume 20 Period MA = Orange Line Going through volume Bars on Chart
Support & Resistance Areas = Horizontal Parallel Black Lines with Yellow Shading on Chart

BNB: Buying ZoneBNB seems to be going sideway/ slightly uptrend between 405-440. It failed to break above EMA100 so that is still our resistance for now (but once broken the uptrend will be strong). Most recent prices are above EMA30 which is a confirmation of the uptrend, in addition to higher highs/ lows.
I would wait for MFI to be below 25 and place my long entry as long as price are still in the “blue zone”. My tp would be 440 and sl at 404.
((Not a financial advice, use at your own risk))


BTC - Let's have a look at the Daily ChartBTC Update:
BTC has finally made it above its major resistance area and turned that level into support.
BTC is back below its Pitchfork (A,B,C) Median Line.
BTC is still above its Bollinger Bands Middle Band Basis 20 Period SMA. Note that Volatility is actually still low on this 1D timeframe because we do not yet have expansion of the Upper and lower Bollinger Bands. Note that the Upper Band is starting to point Downwards and the Lower Band is still moving upwards indicating we may see a Bollinger Bands Pinch on this 1D timeframe.
At the moment of posting this, BTC has dropped below its Least Squares Moving Average (LSMA). A close above this level is crucial. A close below the LSMA will probably mean a drop back into the support area and possibly the BB Middle Band Basis.
Using the 20,60,120,30 settings for the Ichimoku Cloud, note that we now have a Cloud (Kumo) Twist into a new Bullish Green Cloud for this 1D timeframe.
Note that BTC is still above its Volume Profile Fixed Range Point of Control (VPFR POC) for the fixed range of 7 daily candles i have selected.
BTC is still above its Volume Profile Visible Range Point of Control (VPVR POC) for this charts visible range.
Note that Volume today is still low and the Volume Bar is still under its Volume 20 Period Moving Average, that could change as the day ticks on.
Using Simple Moving Averages, note that the 50MA is still rising and it looks like we may very soon see a 50MA cross back over and above the 200MA creating a GOLDEN CROSS for this 1D timeframe.
The Average Directional Index (ADX DI) is indicating the trend strength has increased with the ADX (Orange Line) at 28.17 heading sideways but very close to crossing over and above its 9 Period EMA (Black line) which is at 28.20. The +DI (Green Line) has dropped to 23.21 and the -DI (Red Line) has increased to 11.47 at the moment. This means that Positive momentum has dropped and Negative momentum has increased on this 1D timeframe. Note however that there is still a big gap between the +DI (Green Line) and -DI (Red Line) so the price would have to drop substantially for Negative momentum to become dominant on this 1D timeframe.
The Relative Strength Index (RSI) is indicating momentum is downwards on this 1D timeframe at the moment. Note that the RSI (Purple Line) is back below its 9 Period EMA (Red Line) indicating increased strength for negative momentum at the moment.
So key levels to watch for a daily close ABOVE or BELOW on this 1D timeframe are the LSMA, VPFR POC and the Upper Support Zone. The Bollinger Bands Middle Band Basis becomes the next crucial level to watch if those previous levels mentioned fails as support.
I hope this is helpful with your Trading and Hodl-ing.
Notes for those who don’t know:
LSMA = Black Squiggly Line on chart
50MA = Yellow Squiggly Line on Chart
200MA = Red Squiggly Line on Chart
Bollinger Bands = Grey Bands on Chart
Pitchfork = A,B,C Pattern on Chart
Ichimoku Cloud = Red and Green Cloud Pattern on Chart
VPVR POC = Long Horizontal Red Line on Chart
VPFR POC = Short Horizontal Red Line on Chart
Volume Bar = Bottom of Chart
Volume 20 Period MA = Black Line Going through volume Bars
Support Areas = Horizontal Parallel Black Lines with Yellow Shading


KN Bullish DailyNYSE:KN
Bullish process with multiple bottoms and now higher lows
20 EMA just crossed above 50 EMA and they are both accelerating up
MACD turned positive and is accelerating
Last daily bar was a strong up bar with the highest close in months

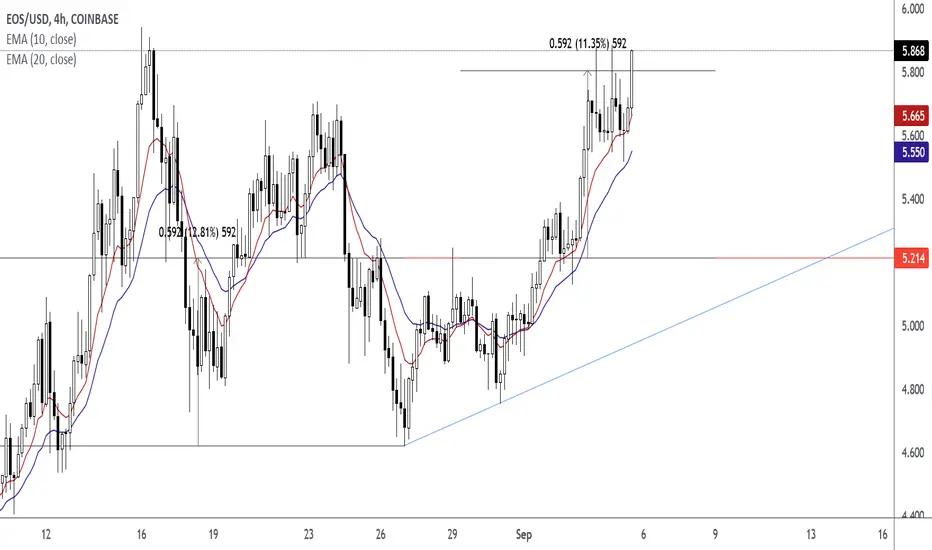
How To Trade The Ascending Triangle Trading The Ascending Triangle
Wait For The Close Above The Horizontal Level
Wait For The Retest in the form of a pin bar or rejection candlestick.
Enter At The Close Price of Pin Bar or Rejection Candlestick
Exit At The Measured Objective of Pattern. The Height of Pattern is 592.
all you need is love, ema50 and funding/premium chart <3 Funding/premium is still on very low level. Corrections to ema50 1D while funding went negative were great btfd oppurtunities. Let's see how it will go this time.

BTC - could we soon witness a GOLDEN CROSS?BTC Update:
BTC is still safely above its 50MA and its 200MA. Note that the 50MA is pointing upwards and the 200MA is pointing sideways. If the support levels hold strong and if and when BTC is able to push above the Upper Resistance Zone and the Pitchfork Median Line then........ we will witness a GOLDEN CROSS on this 1D timeframe.
BTC is back above its Bollinger Bands Middle Band Basis 20 Period SMA for this 1D timeframe.
Note that the Upper Band is starting to point downwards and the lower Band is pointing upwards indicating volatility has slowed on this 1D timeframe. With this consolidation, we are seeing the start of a potential Bollinger Band Pinch, which could lead to a big volatility induced move.
BTC has found some resistance from its Least Squares Moving Average (LSMA). Note that a daily close ABOVE the LSMA is a potential buy signal.
BTC is above its Volume Profile Visible Range Point of Control (VPVR POC) for this charts visible range.
At the moment, BTC is fighting to stay above its Volume Profile Fixed Range Point of Control (VPFR POC) the the fixed range of 14 daily candles that I’ve selected.
Volume has increased and note that yesterday and today’s volume Bar are above its Volume 20 Period Moving Average.
BTC is still in an Upwards Pitchfork Pattern (A,B,C). Note that BTC has crossed under the Pitchfork Median Line (Middle Dashed Line). The Pitchfork Median Line is a crucial level to cross and close back above.
BTC has found strong resistance from its Upper Resistance Area of $50,604 - $49,087.
BTC has now found strong support from its new Support Area of $46,693 - $46,231.
If i just use the Ichimoku Cloud (Kumo) without the other IC indicatiors, you can clearly see that BTC has found VERY STRONG support from the Ichimoku Cloud Leading Span B (Senkou Span B) support Level. This level also coincides with the new Support Area I’ve added.
If we look at the Average Directional Index (ADX DI) we can see the trend strength has dropped with the ADX (Orange Line) at 26.50 and still under its 9 Period EMA which is at 31.22. The +DI (Green Line) is pointing upwards at 18.46 and the -DI (Red Line) is pointing downwards at 14.86. This means that while the Trend strength has dropped, Positive Momentum has actually increased and Negative Momentum has decreased. The further the +DI (Green Line) gets away from the -DI (Red Line) the better.
The Relative Strength Index (RSI) is indicating Momentum is upwards at the Moment. Note that the RSI (Purple Line) is pointing upwards and looking like it may cross back above its 9 Period EMA (Red Line), this will be a good sign of upwards momentum strength for this 1D timeframe if that happens. Note that the RSI still has plenty of room to move up before becoming overbought on this 1D timeframe.
If you are uncertain to go long, then confirmation will be when BTC successfully crosses ABOVE and CLOSES a daily candle ABOVE the Upper Resistance Area. If you are uncertain to go short, then you would wait for BTC to successfully break UNDER and CLOSE a daily candle UNDER the New Support Area and the Leading Span B (Senkou Span B) support Level.
Remember that a close ABOVE the LSMA is also a potential BUY signal for this indicator. Full Bullish Confirmation on this 1D Timeframe will be when the Leading Span A (Senkou Span A) crosses back above the Leading Span B (Senkou Span B) cloud support creating a Cloud (Kumo) Twist a new Bullish Green Cloud for this 1D timeframe.
Also, don't forget to get your cameras ready for when that 50MA & 200MA Golden Cross happens. ;-)
I hope this is helpful with your Trading and Hodl-ing..... cause it does take a while to type it all up :-)
Notes for those that don’t know:
50MA = Yellow Squiggly Line on chart
200MA = Red Squiggly Line on chart
LSMA = Black Squiggly Line on chart
Bollinger Bands = Grey Bands on chart on chart
Ichimoku Cloud = Red and Green fluffy Cloud on chart
Pitchfork = A,B,C Lines on chart
VPVR POC = Long Horizontal Red Line on chart
VPFR POC = Short Horizontal Red Line on chart
Volume Bars = Bottom of Chart
Volume Moving Average = Black Line going through Volume Bars
Support and Resistance Areas = Horizontal Black Lines with Yellow Shading

GBPNZD: Lows before HighsGBPNZD is overall bearish. Now this one is approaching a support level where we will be looking for buy setups.
Meanwhile, price can still retest our trendline, making a higher low before breaking and the EMA50 where our buy trigger would be.
Conclusion: wait like a sniper !
Trade Safe

XPEV DailyNYSE:XPEV daily looks ready to break the top trendline.
EMA's accelerating upwards together
MACD positive and accelerating
Formed a nice base with multiple rounded bottoms throughout July and August

Gbpaud buy opportunity signal Gbpaud now in support daily, low risk to buy on weakness lets buy now
I place buy with
Stoploss in 1.873
Take profit in 1.896
Risk in your hand, disclaimer on

EUR GBP simetrical triangle form Eur GBP potential make simetrical triangle with one correction wave, place buy limit in support trend line and use fibonaci expansion to see take profit area, dont forget to set stoploss

DCT Launching?NASDAQ:DCT looks like it is ready to launch into a breakout. MACD just turned positive with a very bullish bar on Friday. Both the 20 and 50 EMAs are accelerating upwards together and Friday gave us the highest closing bar in months.

Bears are in full controlREJECTED FROM 50 WMA (low)...
bears are in full control
look for a rejection of the
4 & 8 EMA for potential entry
on ANY timeframe
If bullish (riding the bounces) profit taking expecting rejection of 4 & 8 ema
Negated on a bullish break of the 50 WMA
AND 4 & 8 EMA acting as support.

Quick VTHO 1D updateQuick VTHO 1D chart update:
VTHO is still in the Equilibrium Zone of the Ichimoku Cloud for this 1D timeframe.
The Ichimoku Cloud Conversion Line (Tenkan Sen) is indicating the mid-point of the short-term momentum is slightly upwards.
The Ichimoku Cloud Base Line (Kijun Sen) is indicating that the mid-point of the mid-term momentum is sideways.
The Ichimoku Cloud Lagging Span (Chikou Span) is indicating momentum is upwards at the moment.
VTHO has found support from its Ichimoku Cloud Base Line (Kijun Sen) and has bounce off this level twice over the last 3 days.
VTHO has found some resistance from its Conversion Line (Tenkan Sen) level.
VTHO is still in its triangle pattern walking downwards, keep an eye on if the breakout is upwards or downwards. We may see VTHO head to its triangle pattern APEX before we see a breakout. A successful break ABOVE the descending resistance line and re-test as support is crucial.
Volume is still relatively low and VTHO is below its Volume 20 Period Moving Average. It’s a good thing that this period of downwards movement over the last couple of days has not been on huge volume.
VTHO is still above its Volume Profile Visible Range Point of Control (VPVR POC) for this charts visible range.
VTHO is still below its Volume Profile Fixed Range point of Control, (VPFR POC) for the fixed range i have selected.
VTHO is still below its Least Squares Moving Average (LSMA) if you are waiting for LONG confirmation then a close above the LSMA and successful retest of it as support is crucial.
VTHO is above its Bollinger Bands Middle Band Basis 20 Period SMA at the moment. A daily close ABOVE this & successful re-test as support is crucial for renewed upwards momentum.
The Average Directional Index (ADX DI) is showing the trend strength has weakened with the ADX (Orange Line) at 44.63 crossing under its 9 Period EMA (Black Line) which is at 48.63. The +DI (Green Line) has dropped to 22.87 and the -Di (Red Line) is sideways at 16.81. This indicates that while we have seen a drop in Positive Momentum, Negative Momentum has not increased but is sideways at the moment.
The Relative Strength Index (RSI) is confirming that momentum is upwards at the moment. Note that the RSI (Purple Line) is still below its 9 Period EMA (Orange Line), a cross back above the 9 Period EMA will be a sign of renewed upwards momentum strength. Note that VTHO has room to move up on this 1D timeframe before it becomes overbought.
I hope this is helpful with your trading and hodl-ing.
